 Tetrate Agent Operations DirectorVersion: Latest
Monitoring Guardrails Analytics
The Analytics interface in Guardrail Studio provides critical insights into your guardrails' performance and impact. This guide explains how to effectively monitor and analyze guardrail metrics.
Understanding Guardrail Analytics
Guardrail analytics help you:
- Monitor detection rates and trends over time
- Identify patterns in guardrail violations
- Measure performance impact of guardrails
- Track false positive rates
- Make data-driven decisions for guardrail refinements
Accessing Analytics
To access guardrail analytics:
- Navigate to the Guardrail Studio section
- Select a guardrail to view its specific analytics
- Click on the Analytics tab
Key Performance Metrics
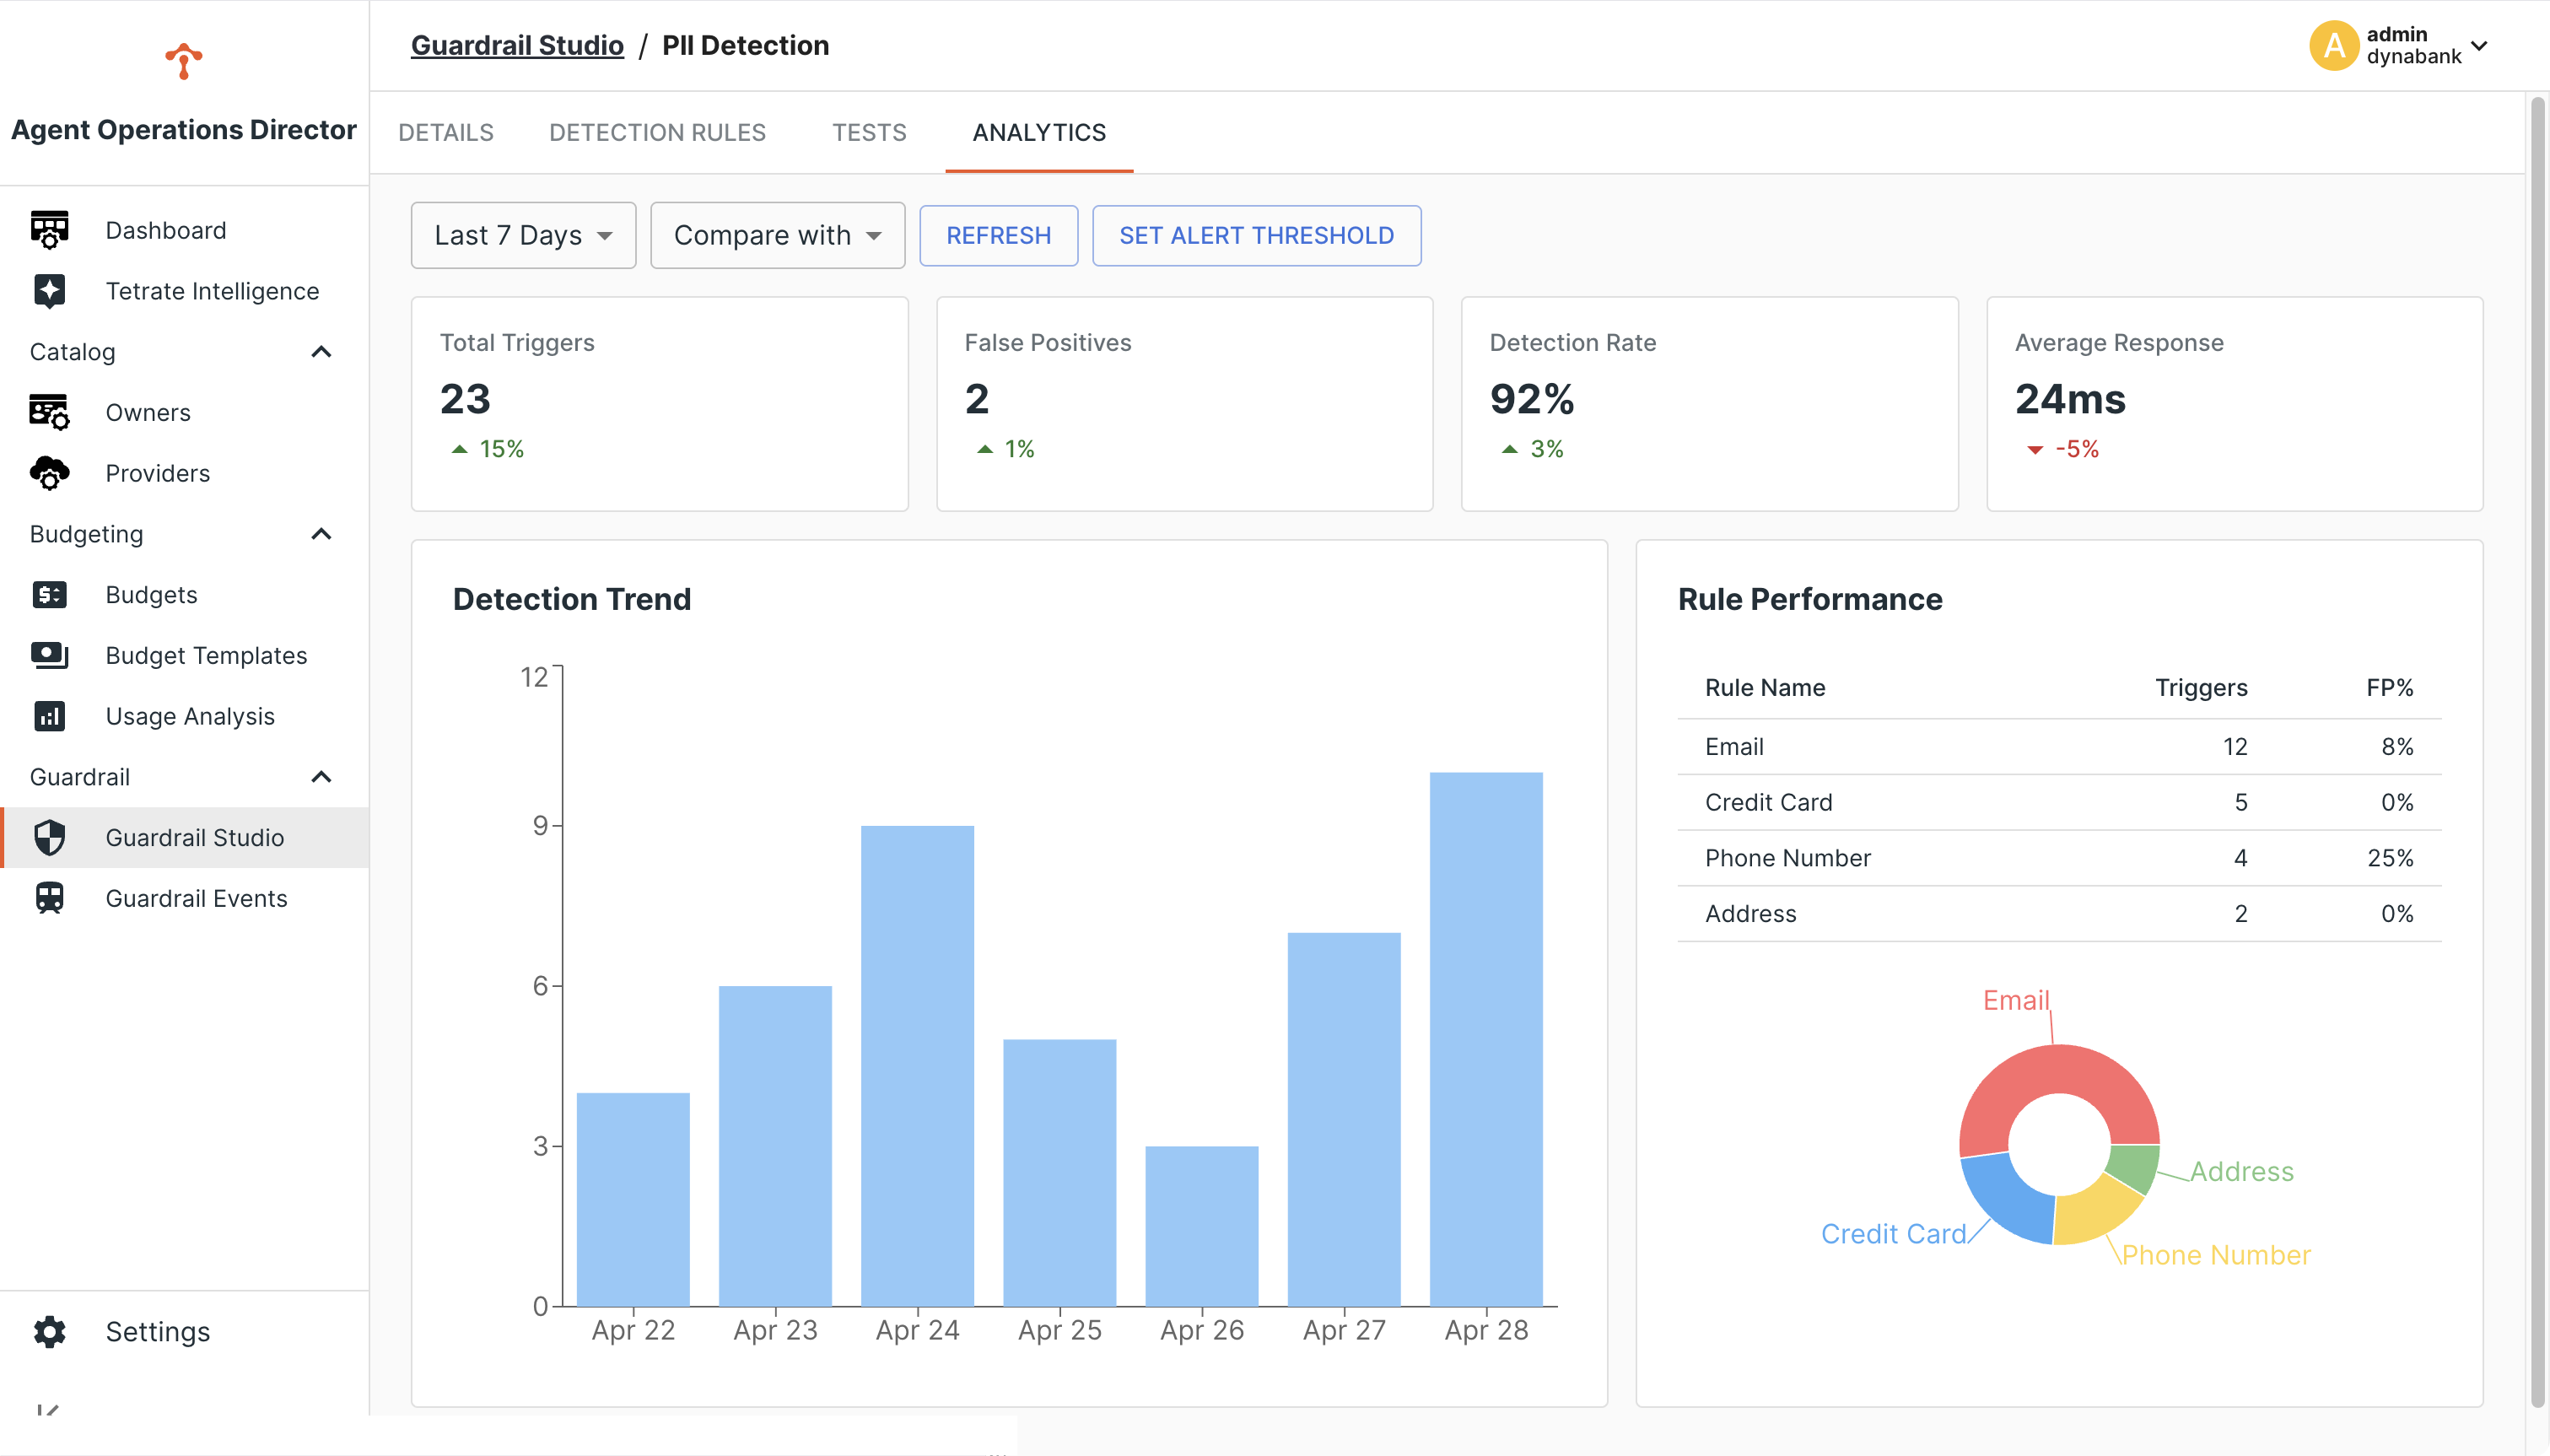
The analytics dashboard displays several important metrics:
1. Total Triggers
The number of times a guardrail has been triggered within the selected time period.
2. False Positives
The number of identified false positives reported by users or detected through analysis.
3. Detection Rate
The percentage of requests that triggered the guardrail relative to total processed requests.
4. Average Response Time
The impact on request processing time when the guardrail is applied.
Analyzing Detection Trends
The Detection Trend chart shows the pattern of guardrail triggers over time:
- Use the Time Range selector to view different time periods
- Analyze the trend line to identify spikes or patterns
- Correlate spikes with known events or changes in your environment
Sudden increases may indicate:
- New attack patterns
- Changes in legitimate usage patterns
- Recent guardrail configuration changes
- False positive issues requiring attention
Rule Performance Analysis
The Rule Performance section breaks down metrics by individual detection rules:
- Triggers: How often each rule is triggered
- FP%: The false positive rate for each rule
- Rule Distribution: Visual representation of which rules are most active
Use this information to identify:
- Rules that may need refinement due to high false positive rates
- Rules that rarely trigger and might need broader patterns
- The most frequently triggered rules for prioritizing optimization
Exporting Analytics Data
To share or further analyze guardrail metrics:
- Click the Export button in the Analytics tab
- Select the format (CSV, JSON, etc.)
- Choose the time range for the exported data
This data can be used for compliance reporting, deeper analysis, or integration with other monitoring systems.
Best Practices for Monitoring
- Regular Review: Schedule weekly or monthly reviews of guardrail analytics
- Baseline Establishment: Create baselines for normal operation to more easily identify anomalies
- Cross-Referencing: Compare guardrail analytics with other system metrics to identify correlations
- Iterative Improvement: Use analytics insights to continually refine guardrail configurations
Next Steps
- Learn how to handle false positives identified through analytics
- Explore customizing guardrails based on analytical insights
- Review creating detection rules to refine rules based on performance data