 Tetrate Enterprise Gateway for EnvoyVersion: v1.8.x
Datadog Integration Guide
In this guide you'll learn how to integrate Tetrate Envoy Gateway with Datadog's Application Performance Manager. It aims to get you up and running using Datadog Kubernetes Agent.
Prerequisites
This Datadog integration document assumes you have gone through the Demo Installation section and have a running demo TEG in your cluster. Nevertheless, the instructions are clear enough for you to integrate any TEG setup with Datadog.
At the end of this guide you will have:
- TEG exporting Traces to Datadog APM
- TEG exporting Metrics to Datadog APM
- TEG exporting Logs to Datadog APM
Installing Datadog Agent
Install the datadog-agent using your Datadog private api key:
export DD_API_KEY="<Your datadog key>"
kubectl create ns datadog-agent
kubectl create secret generic datadog-secret \
    --from-literal api-key="${DD_API_KEY}"
helm install datadog/datadog-operator  \
--version "2.9.2" -n datadog-agent \
--create-namespace
This created an operator watching for kind: DatadogAgent resources, where you configure in the spec.features the necessary settings to collect TEG metrics. In this document you find the basic instructions to get it working.
Traces
Activate APM in DatadogAgent manifest with:
    apm:
      enabled: true
      instrumentation:
        enabled: true
        targets:
          - name: "default-target"
            ddTraceVersions:
              java: "1"
              python: "3"
              js: "5"
              php: "1"
              dotnet: "3"
As The TEG demo already provides a GatewayClass with ParametersRef like
  spec:
    controllerName: gateway.envoyproxy.io/gatewayclass-controller
    parametersRef:
      group: gateway.envoyproxy.io
      kind: EnvoyProxy
      name: teg-envoy-proxy-config
      namespace: envoy-gateway-system
Edit this same teg-envoy-proxy-config adding at the .spec.telemetry.tracing the following:
        provider:
          backendRefs:
          - group: ""
            kind: Service
            name: datadog-agent
            namespace: datadog-agent
            port: 8126
          port: 4317
          type: Datadog
        samplingRate: 50
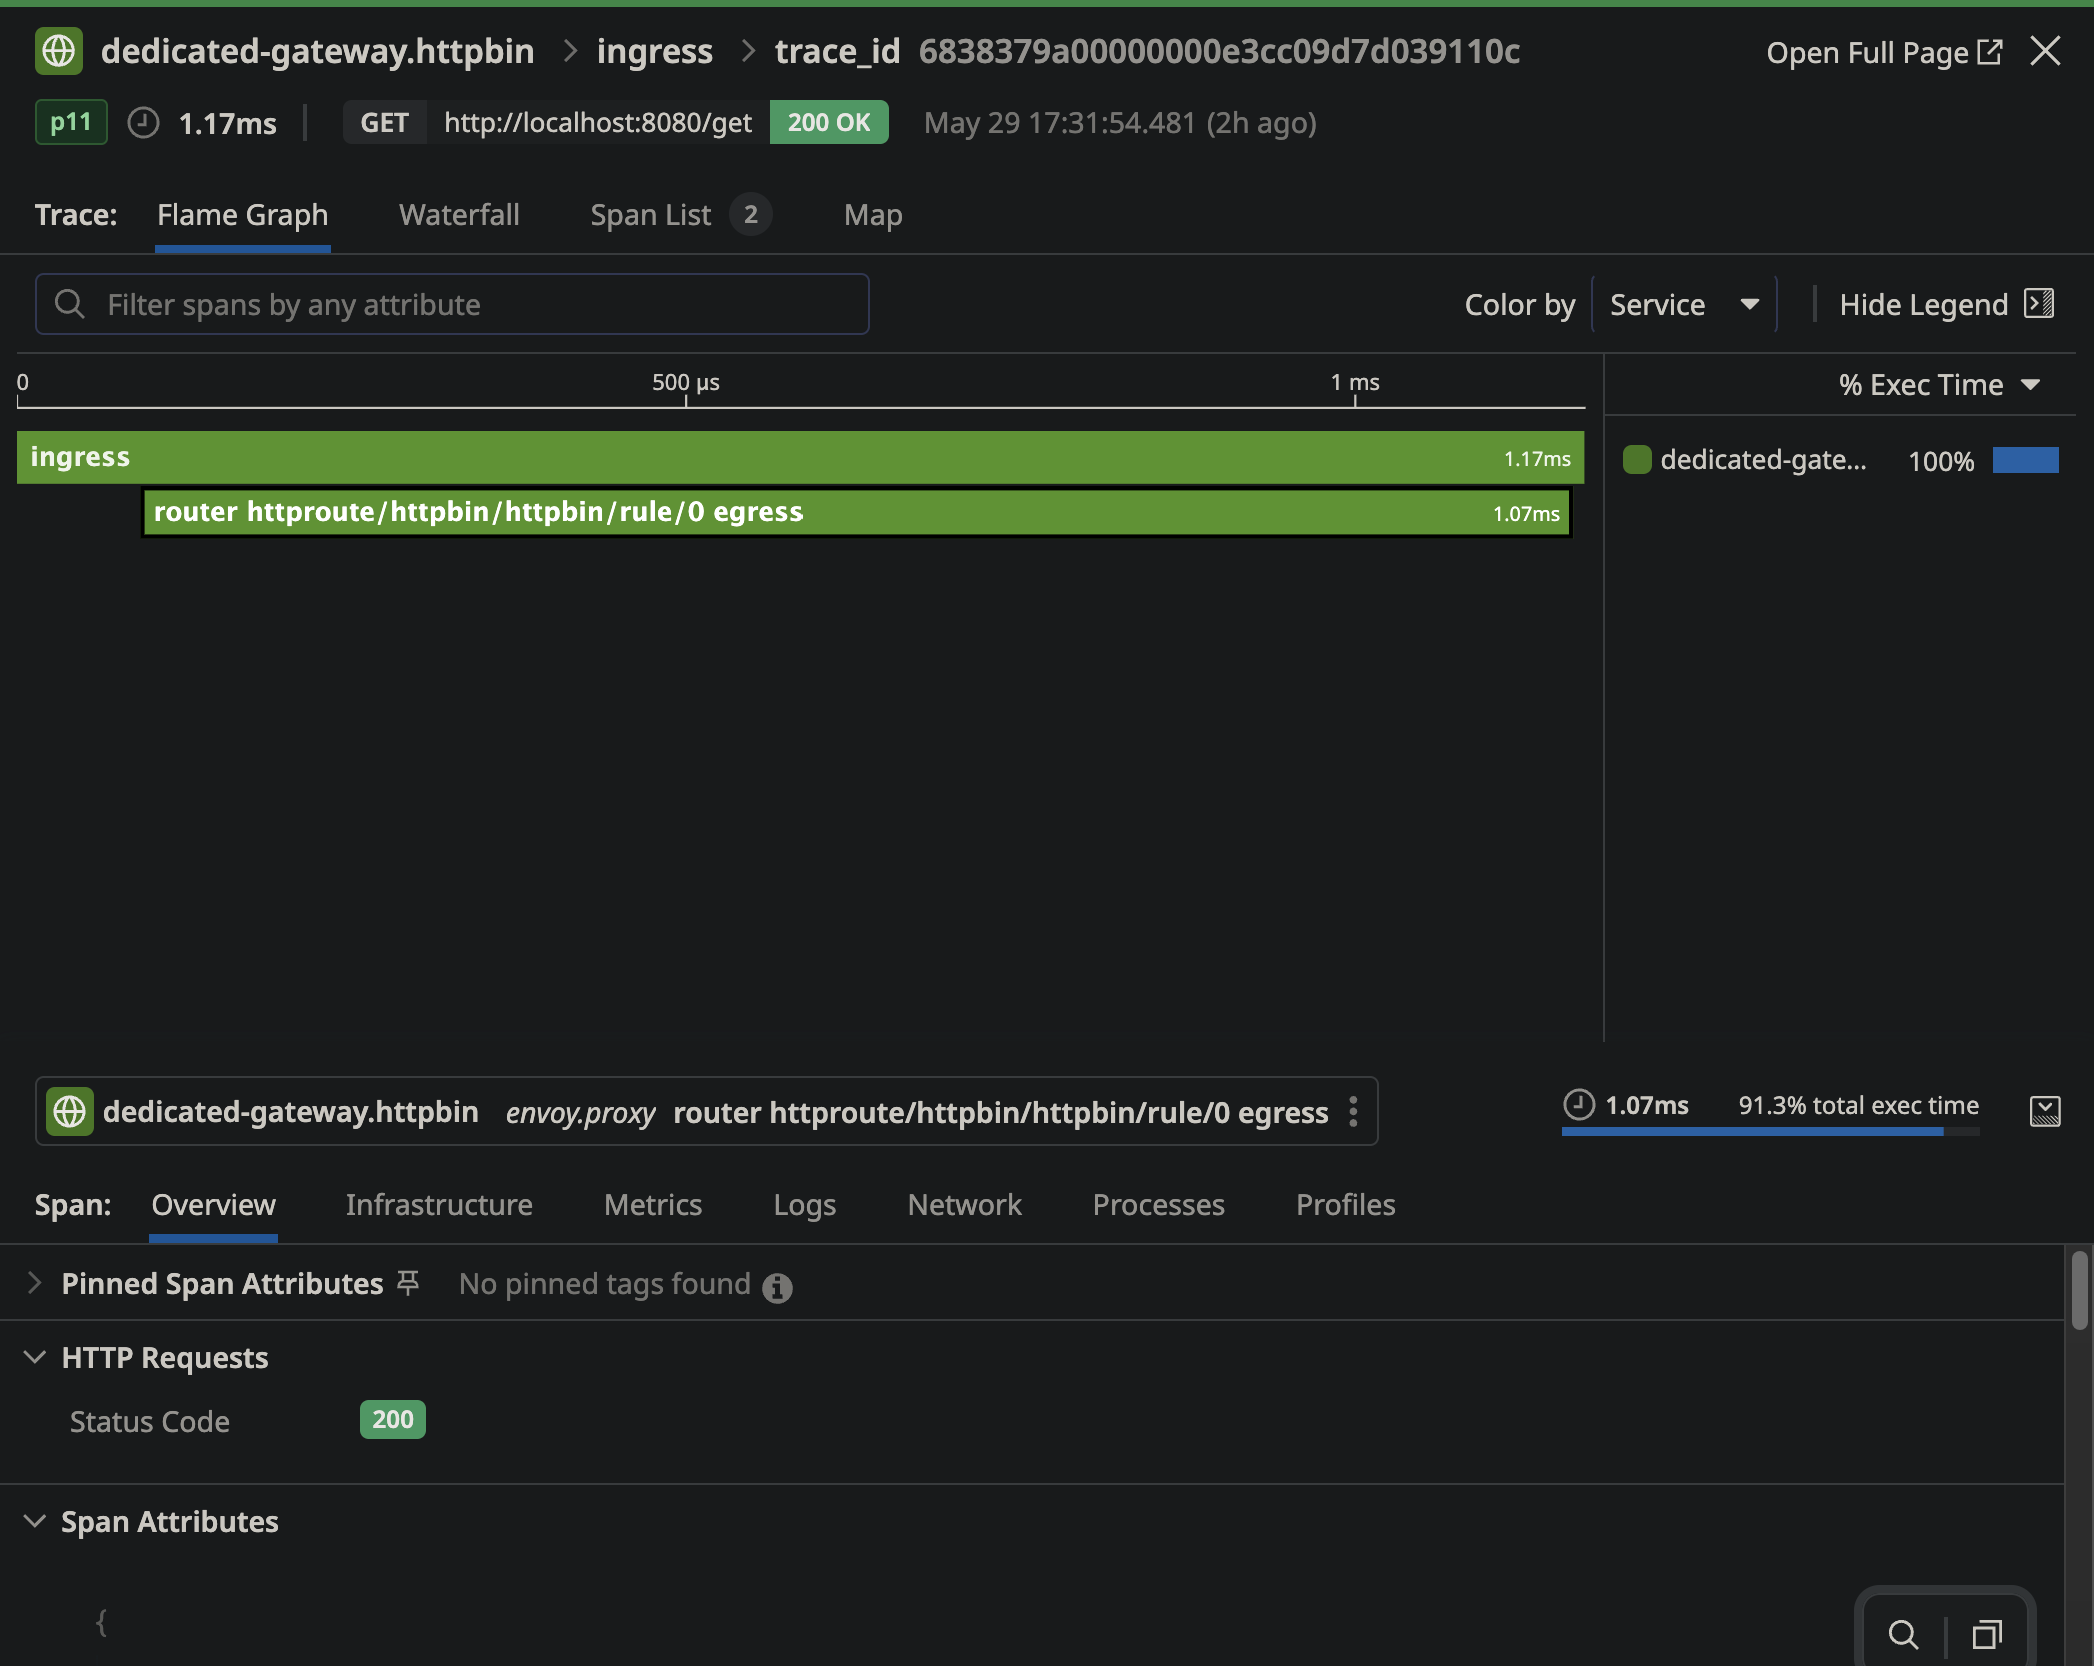
Notice by changing the samplingRate you adjust the percentage of requests to be traced. Upon generating traffic to TEG, you get to see:
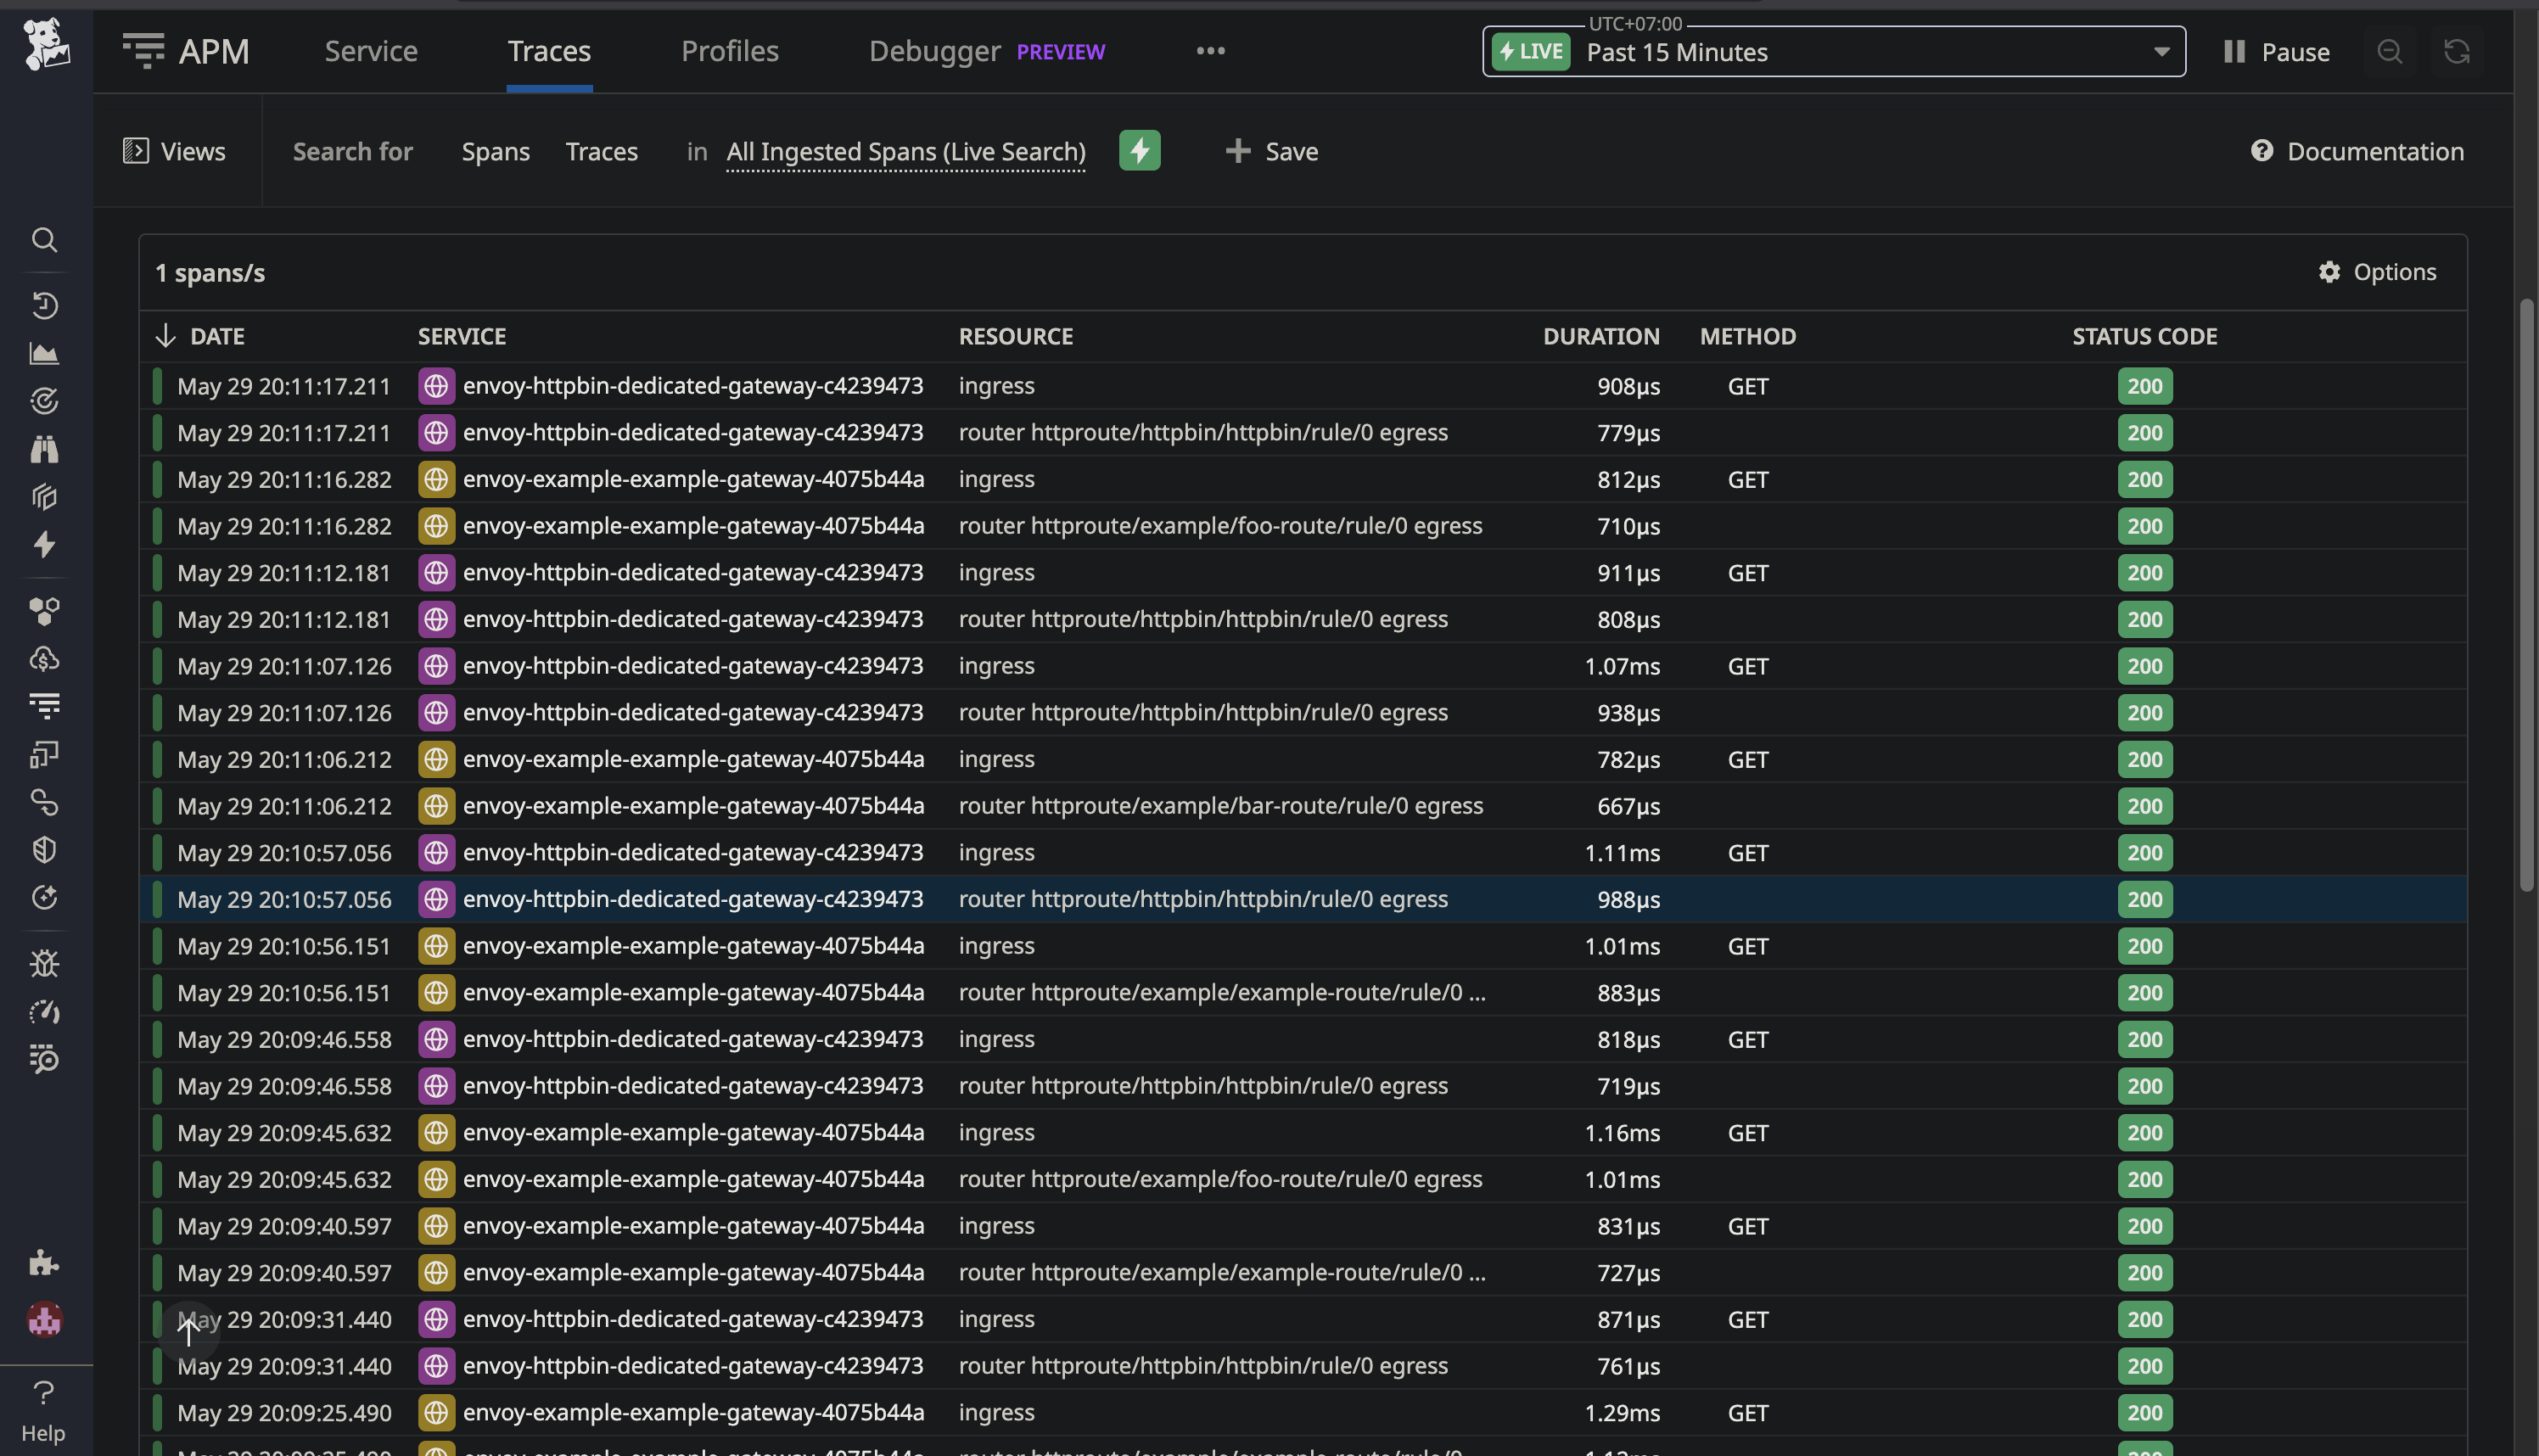
With full inspection capabilities:
Metrics
For metrics, activate Datadog's agent scraping capabilities at the same spec.features level of the kind: DatadogAgent with:
    prometheusScrape:
      enabled: true
      enableServiceEndpoints: true
Double check the EnvoyProxy teg-envoy-proxy-config already has proper prometheus annotations for the pods at the .spec:
  provider:
    kubernetes:
      envoyDeployment:
        pod:
          annotations:
            prometheus.io/path: /stats/prometheus
            prometheus.io/port: "19001"
            prometheus.io/scrape: "true"
    type: Kubernetes
The .spec.telemetry.metrics should also activate the metrics generation by:
    metrics:
      prometheus: {}
Now, the agent is scraping the metrics and they should be available like this:
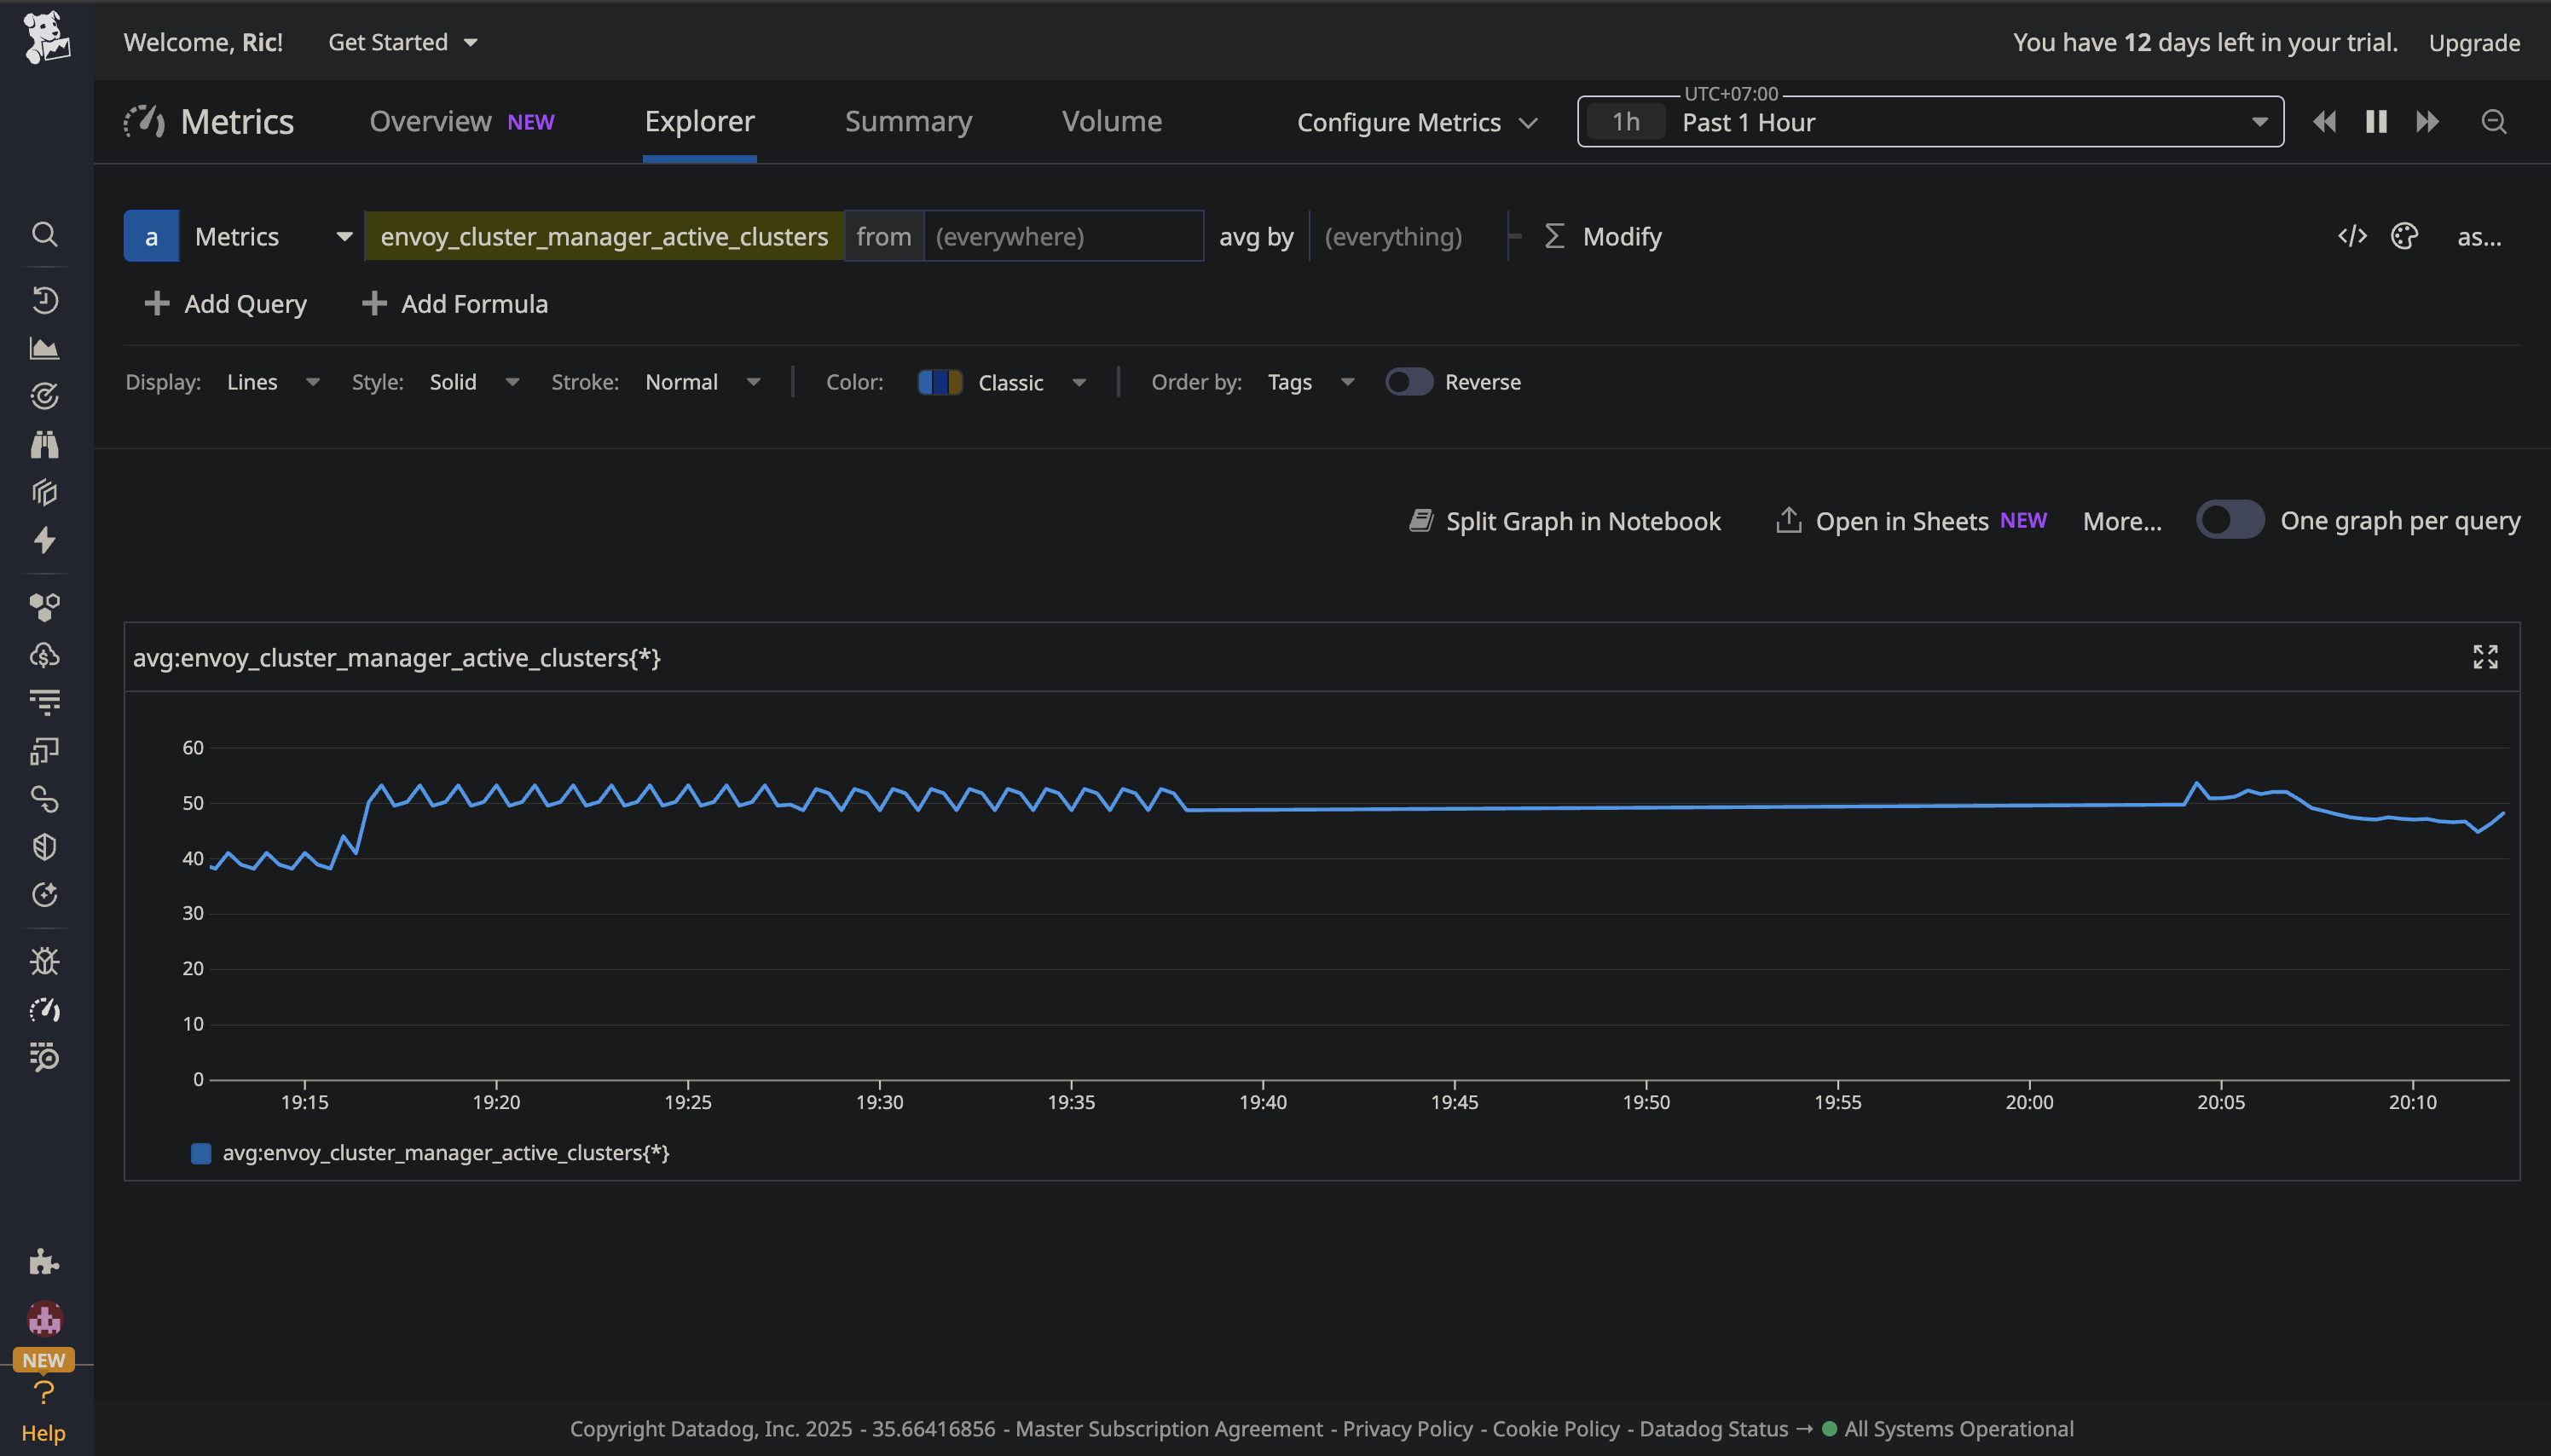
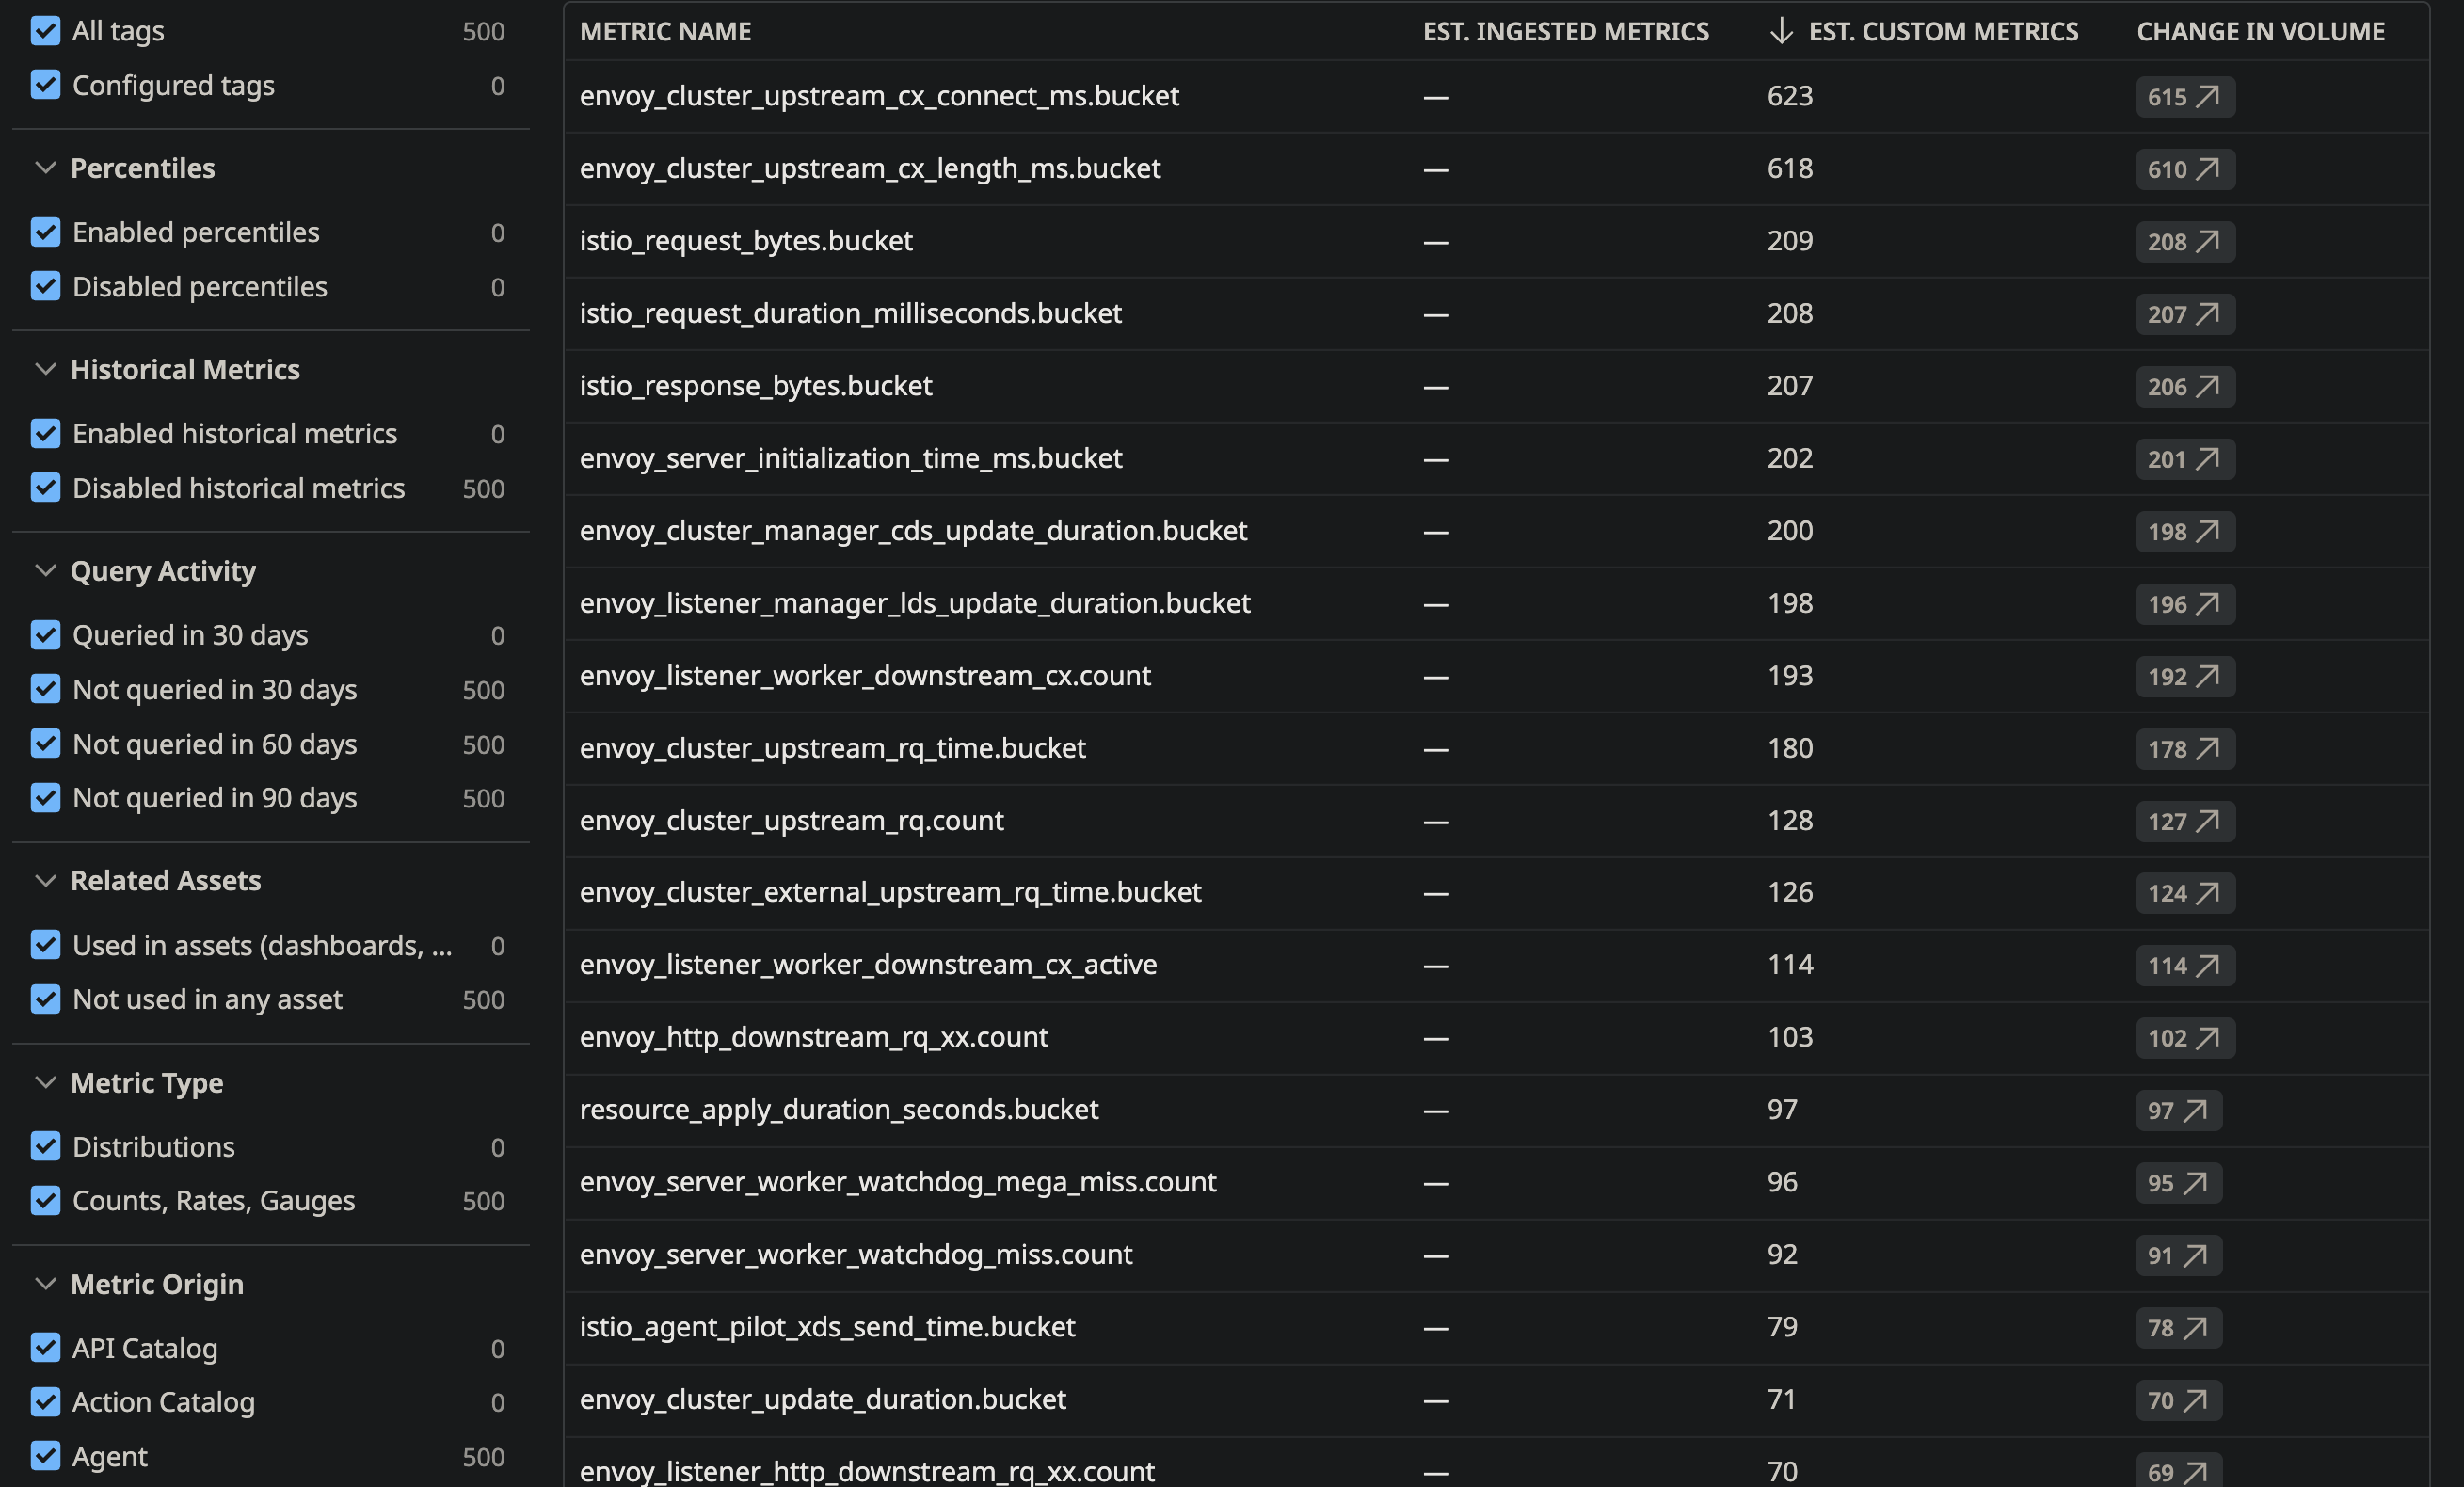
There are plenty of available metrics to keep track of your TEG:
Logs
A similar approach is to be done to ingest TEG logs into Datadog. For simplicity, this document will get the agent to get all the cluster's current containers' logs with containerCollectAll set to true, but you can advance into a recommended more sophisticated approach to bringing only the specific logs desired.
Add the following at the kind: DatadogAgent spec.features level:
    logCollection:
      enabled: true
      containerCollectAll: true
Double check the TEG demo at the EnvoyProxy teg-envoy-proxy-config already includes the file sink at .spec.telemetry.accessLog.settings[0].sinks[0].file like:
  telemetry:
    accessLog:
      settings:
      - format:
          text: '[%START_TIME%] "%REQ(:METHOD)% %REQ(X-ENVOY-ORIGINAL-PATH?:PATH)%
            %PROTOCOL%" %RESPONSE_CODE% %RESPONSE_FLAGS% %BYTES_RECEIVED% %BYTES_SENT%
            %DURATION% %RESP(X-ENVOY-UPSTREAM-SERVICE-TIME)% "%REQ(X-FORWARDED-FOR)%"
            "%REQ(USER-AGENT)%" "%REQ(X-REQUEST-ID)%" "%REQ(:AUTHORITY)%" "%UPSTREAM_HOST%"\n'
          type: Text
        sinks:
        - file:
            path: /dev/stdout
          type: File
In short, your datadog metrics explorer will start showing this:
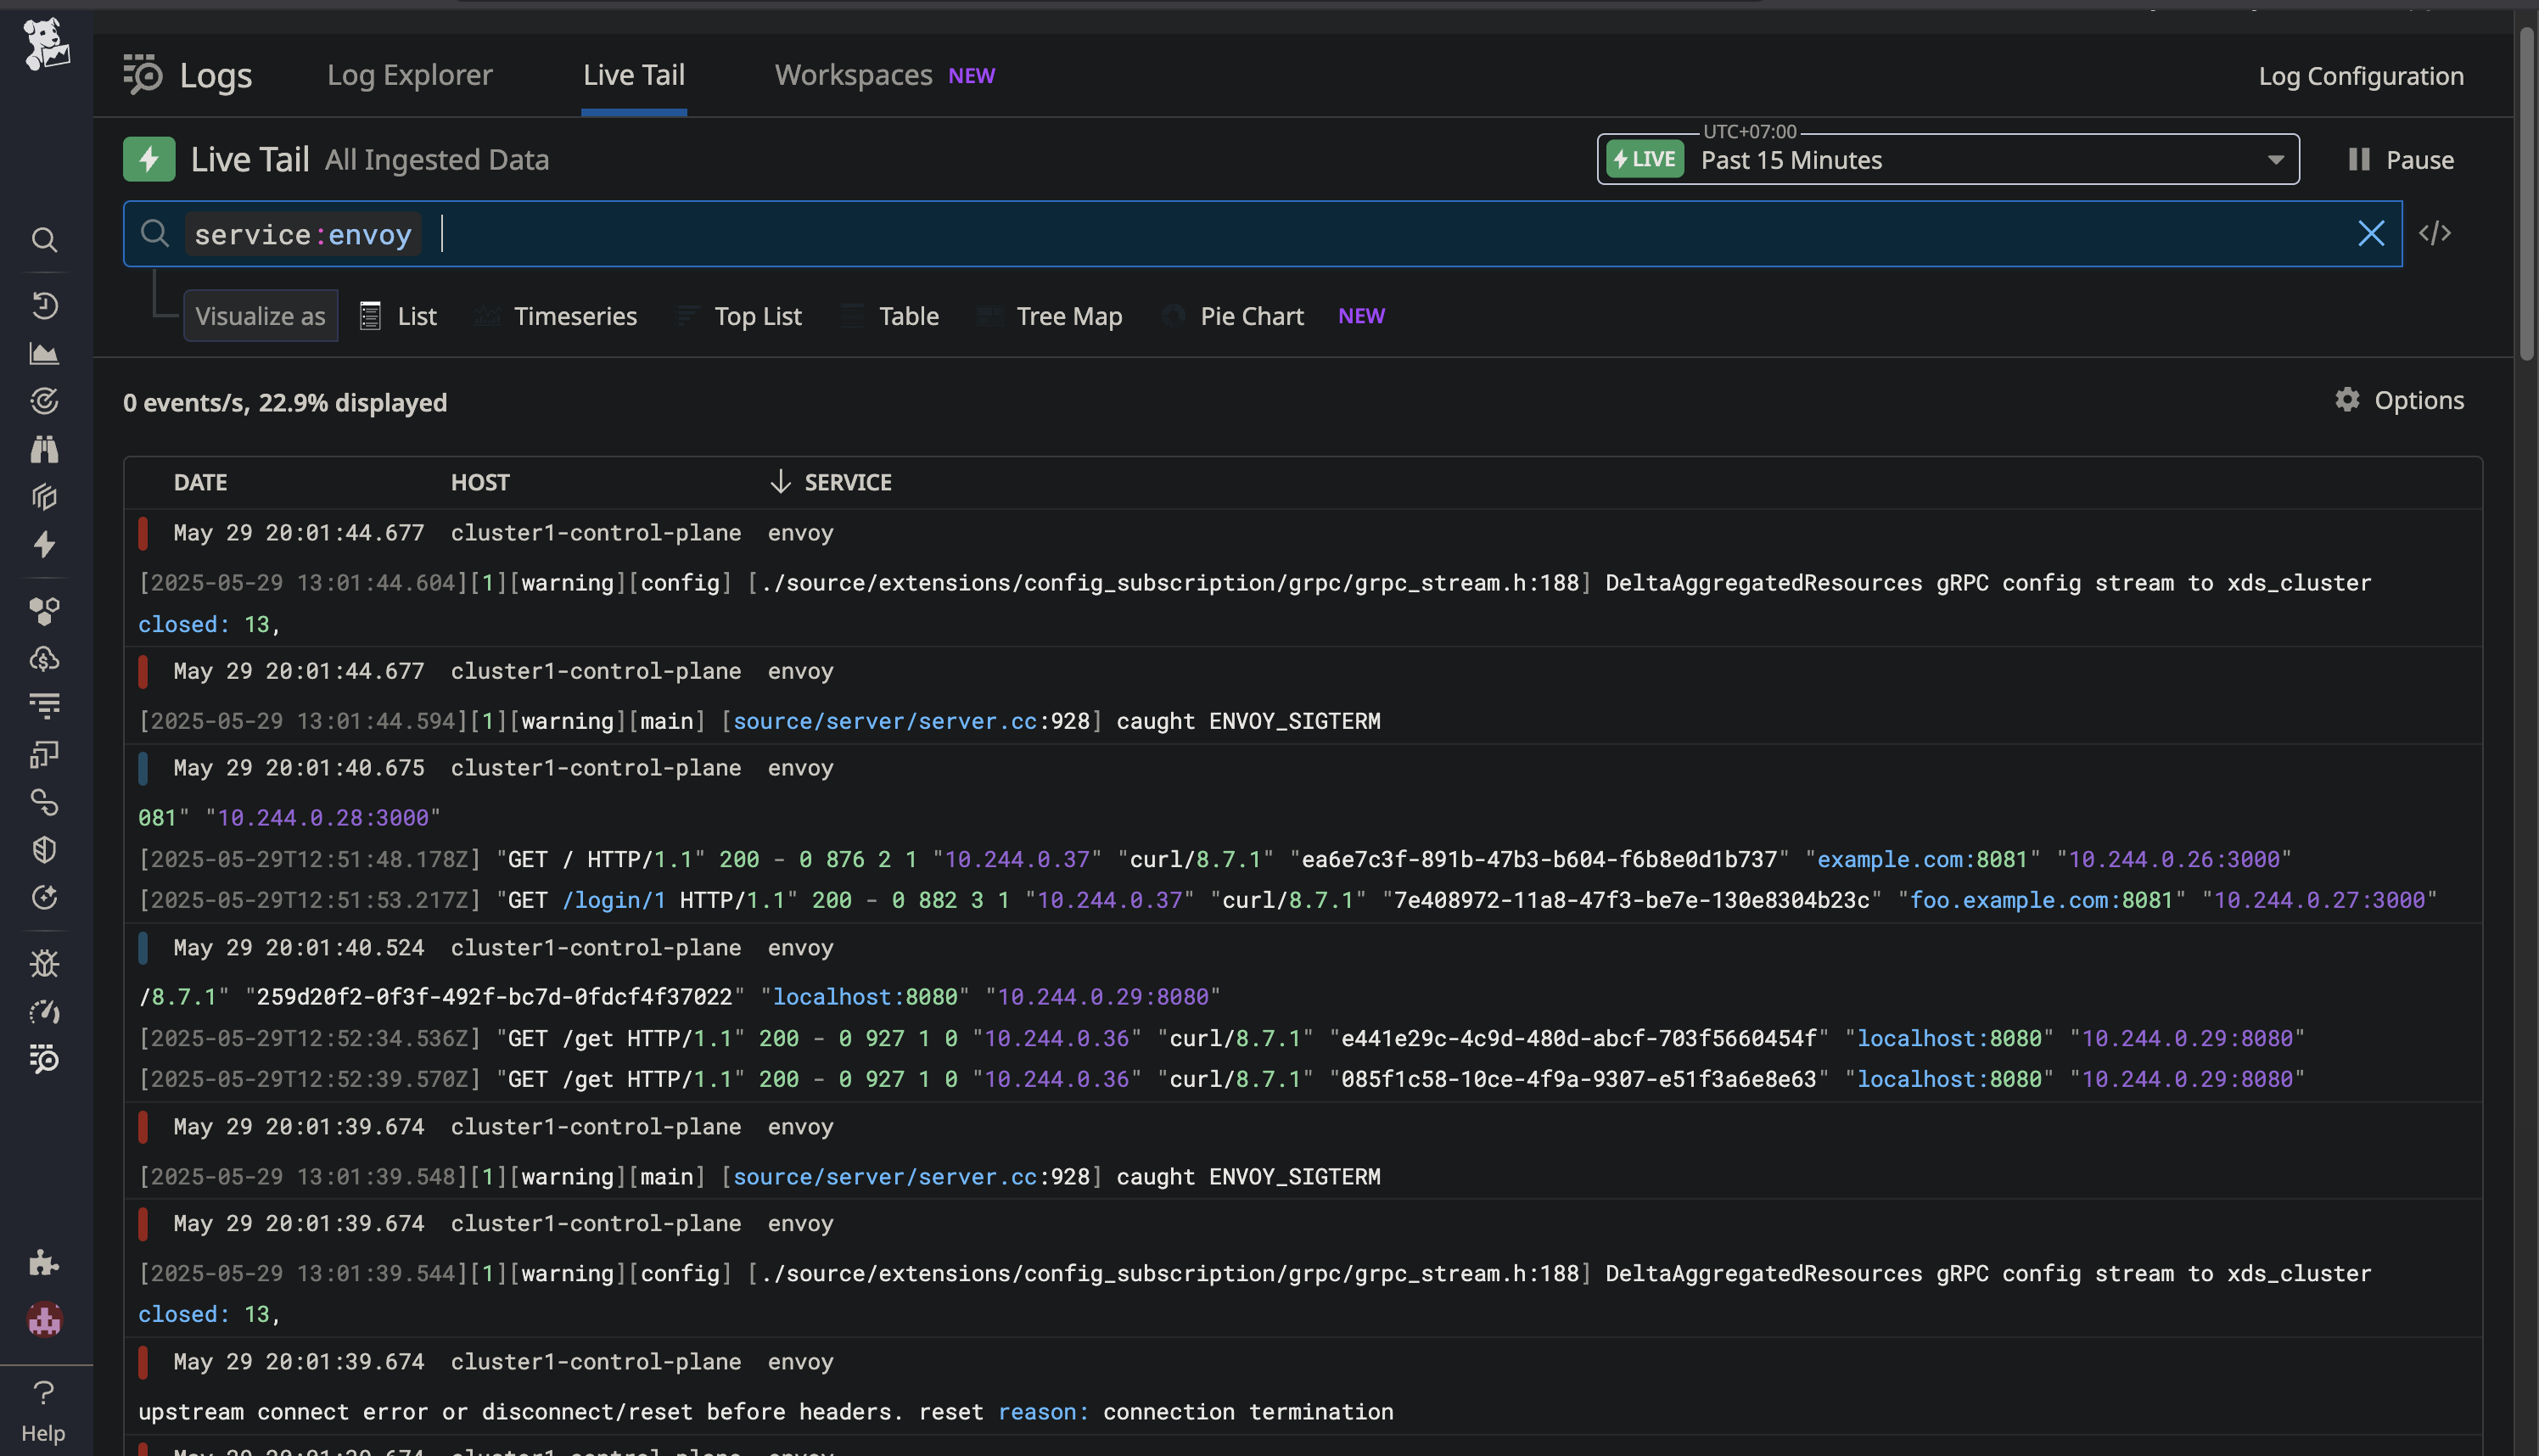
As you can tell, we already have some error logs we can work on. Now, it's your turn to get TEG and Datadog working together.