Tetrate Enterprise Gateway for EnvoyVersion: v1.0.x
Review Monthly Performance of Envoy Gateways
This document aims to guide you through the process of reviewing the monthly performance of your Envoy Gateways. By following this guide, you will be able to set up the necessary metrics collection, generate monthly traffic reports, and identify the top 10 slowest APIs. The ultimate goal is to provide you with actionable insights to optimize the performance of your Envoy Gateways.
Prerequisites
Before you begin, ensure that you have the following:
- TEG demo installed
- Basic understanding of Kubernetes and observability tools.
Setting Up Metrics Collection
First, set up the necessary metrics collection stack. Follow these steps to install Prometheus and Grafana with add-ons Helm chart on your Kubernetes cluster:
helm install eg-addons oci://docker.io/envoyproxy/gateway-addons-helm --version v1.1.0 --set opentelemetry-collector.enabled=true -n monitoring --create-namespace
Get the Grafana endpoint:
- For LB with External IP
- For LB with Hostname
- For Local with no LB - Port forwarding
We will set the $GRAFANA_ADDRESS to the external IP.
export GRAFANA_ADDRESS=$(kubectl get svc grafana -n monitoring -o jsonpath='{.status.loadBalancer.ingress[0].ip}')
If your provider does not provide an ingress IP address, but rather a hostname (e.g., AWS) use the following to set the $GRAFANA_ADDRESS:
export GRAFANA_ADDRESS=$(kubectl get service -n envoy-gateway-system -l gateway.envoyproxy.io/owning-gateway-namespace=httpbin -o jsonpath='{.items[0].status.loadBalancer.ingress[0].hostname}')
Setup Port Forwarding on Local
Set $ENVOY_SERVICE variable
export ENVOY_SERVICE=$(kubectl get svc -n envoy-gateway-system --selector=gateway.envoyproxy.io/owning-gateway-namespace=httpbin,gateway.envoyproxy.io/owning-gateway-name=dedicated-gateway -o jsonpath='{.items[0].metadata.name}')
Verify
echo $ENVOY_SERVICE
Configure port forwarding
kubectl -n envoy-gateway-system port-forward service/${ENVOY_SERVICE} 8899:80 &
For port-forwarding on Local with no loadbalancer
Set the $GRAFANA_ADDRESS
Assuming you set the port to 8899 from the instructions above, copy and paste the following.
export GRAFANA_ADDRESS=localhost:8899
Navigate to http://${GRAFANA_ADDRESS} and sign in with the credentials admin/admin.
Envoy Gateway add-on Helm charts includes all the needing components for observability.
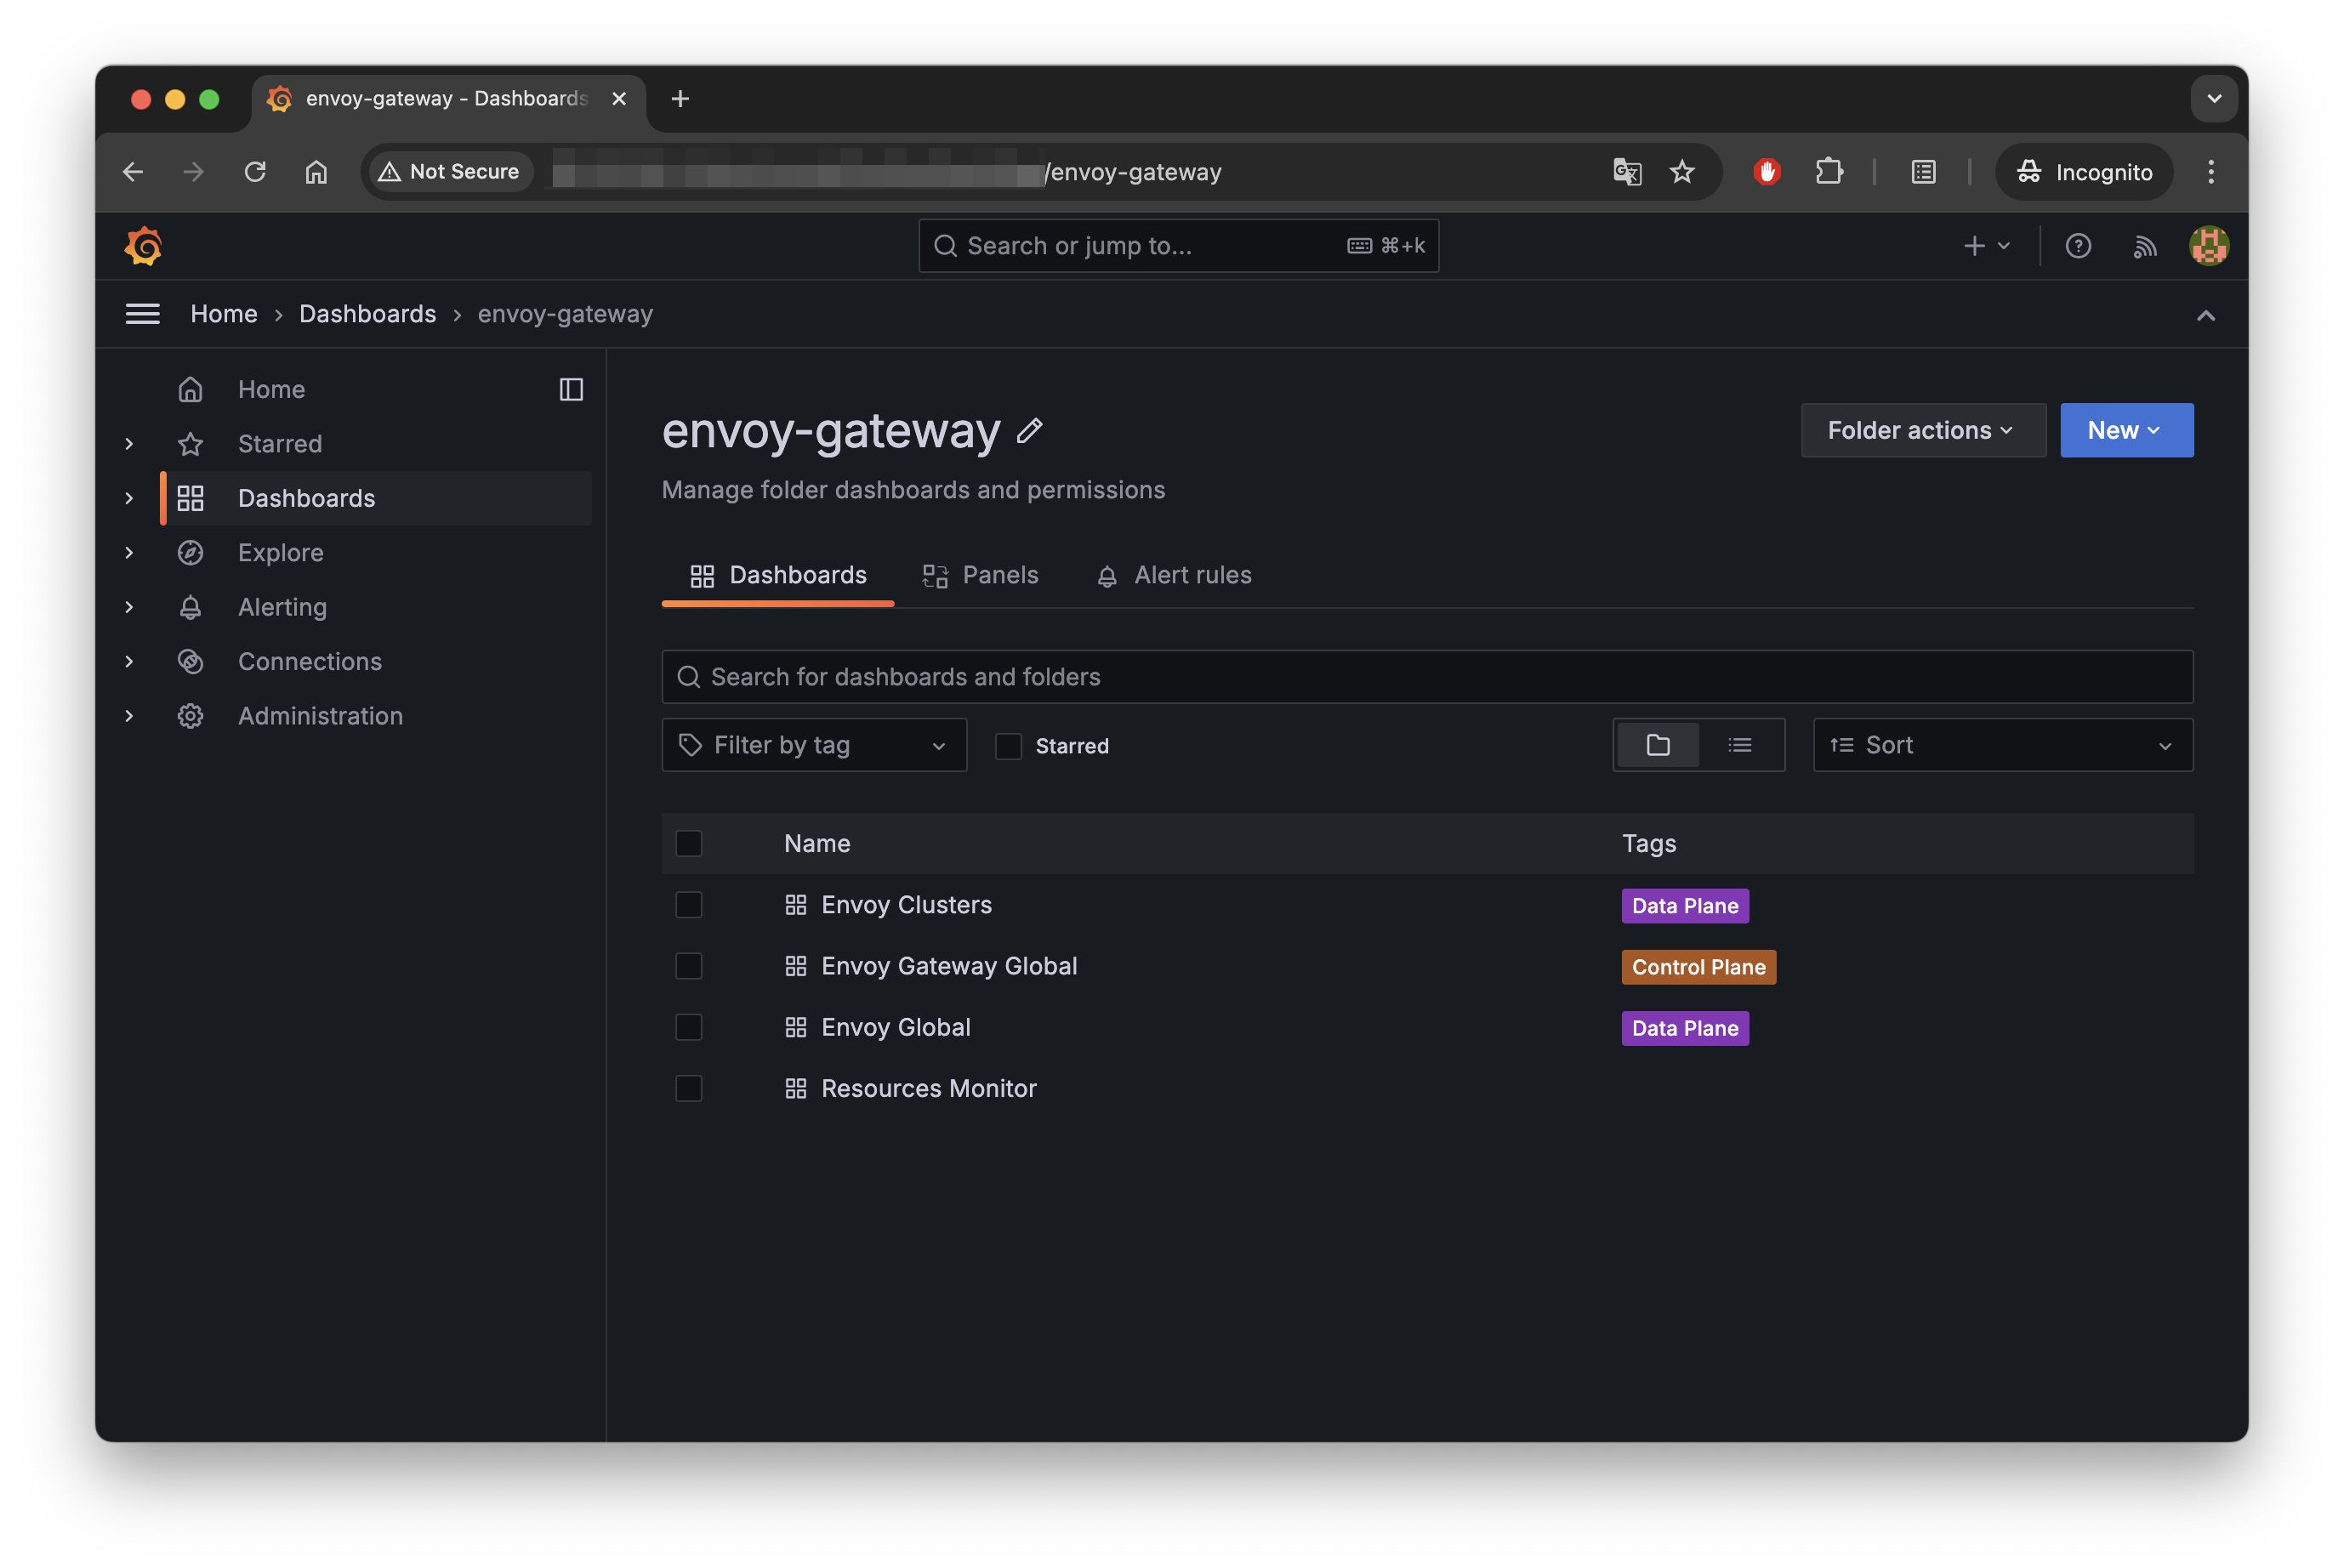
Generating Monthly Traffic Reports
-
Open Grafana and navigate to the Prometheus data source.
-
Use the following Prometheus query to get monthly traffic data:
sum(increase(envoy_http_downstream_rq_total[30d])) -
Save this query in a Grafana dashboard panel to generate a monthly traffic report.
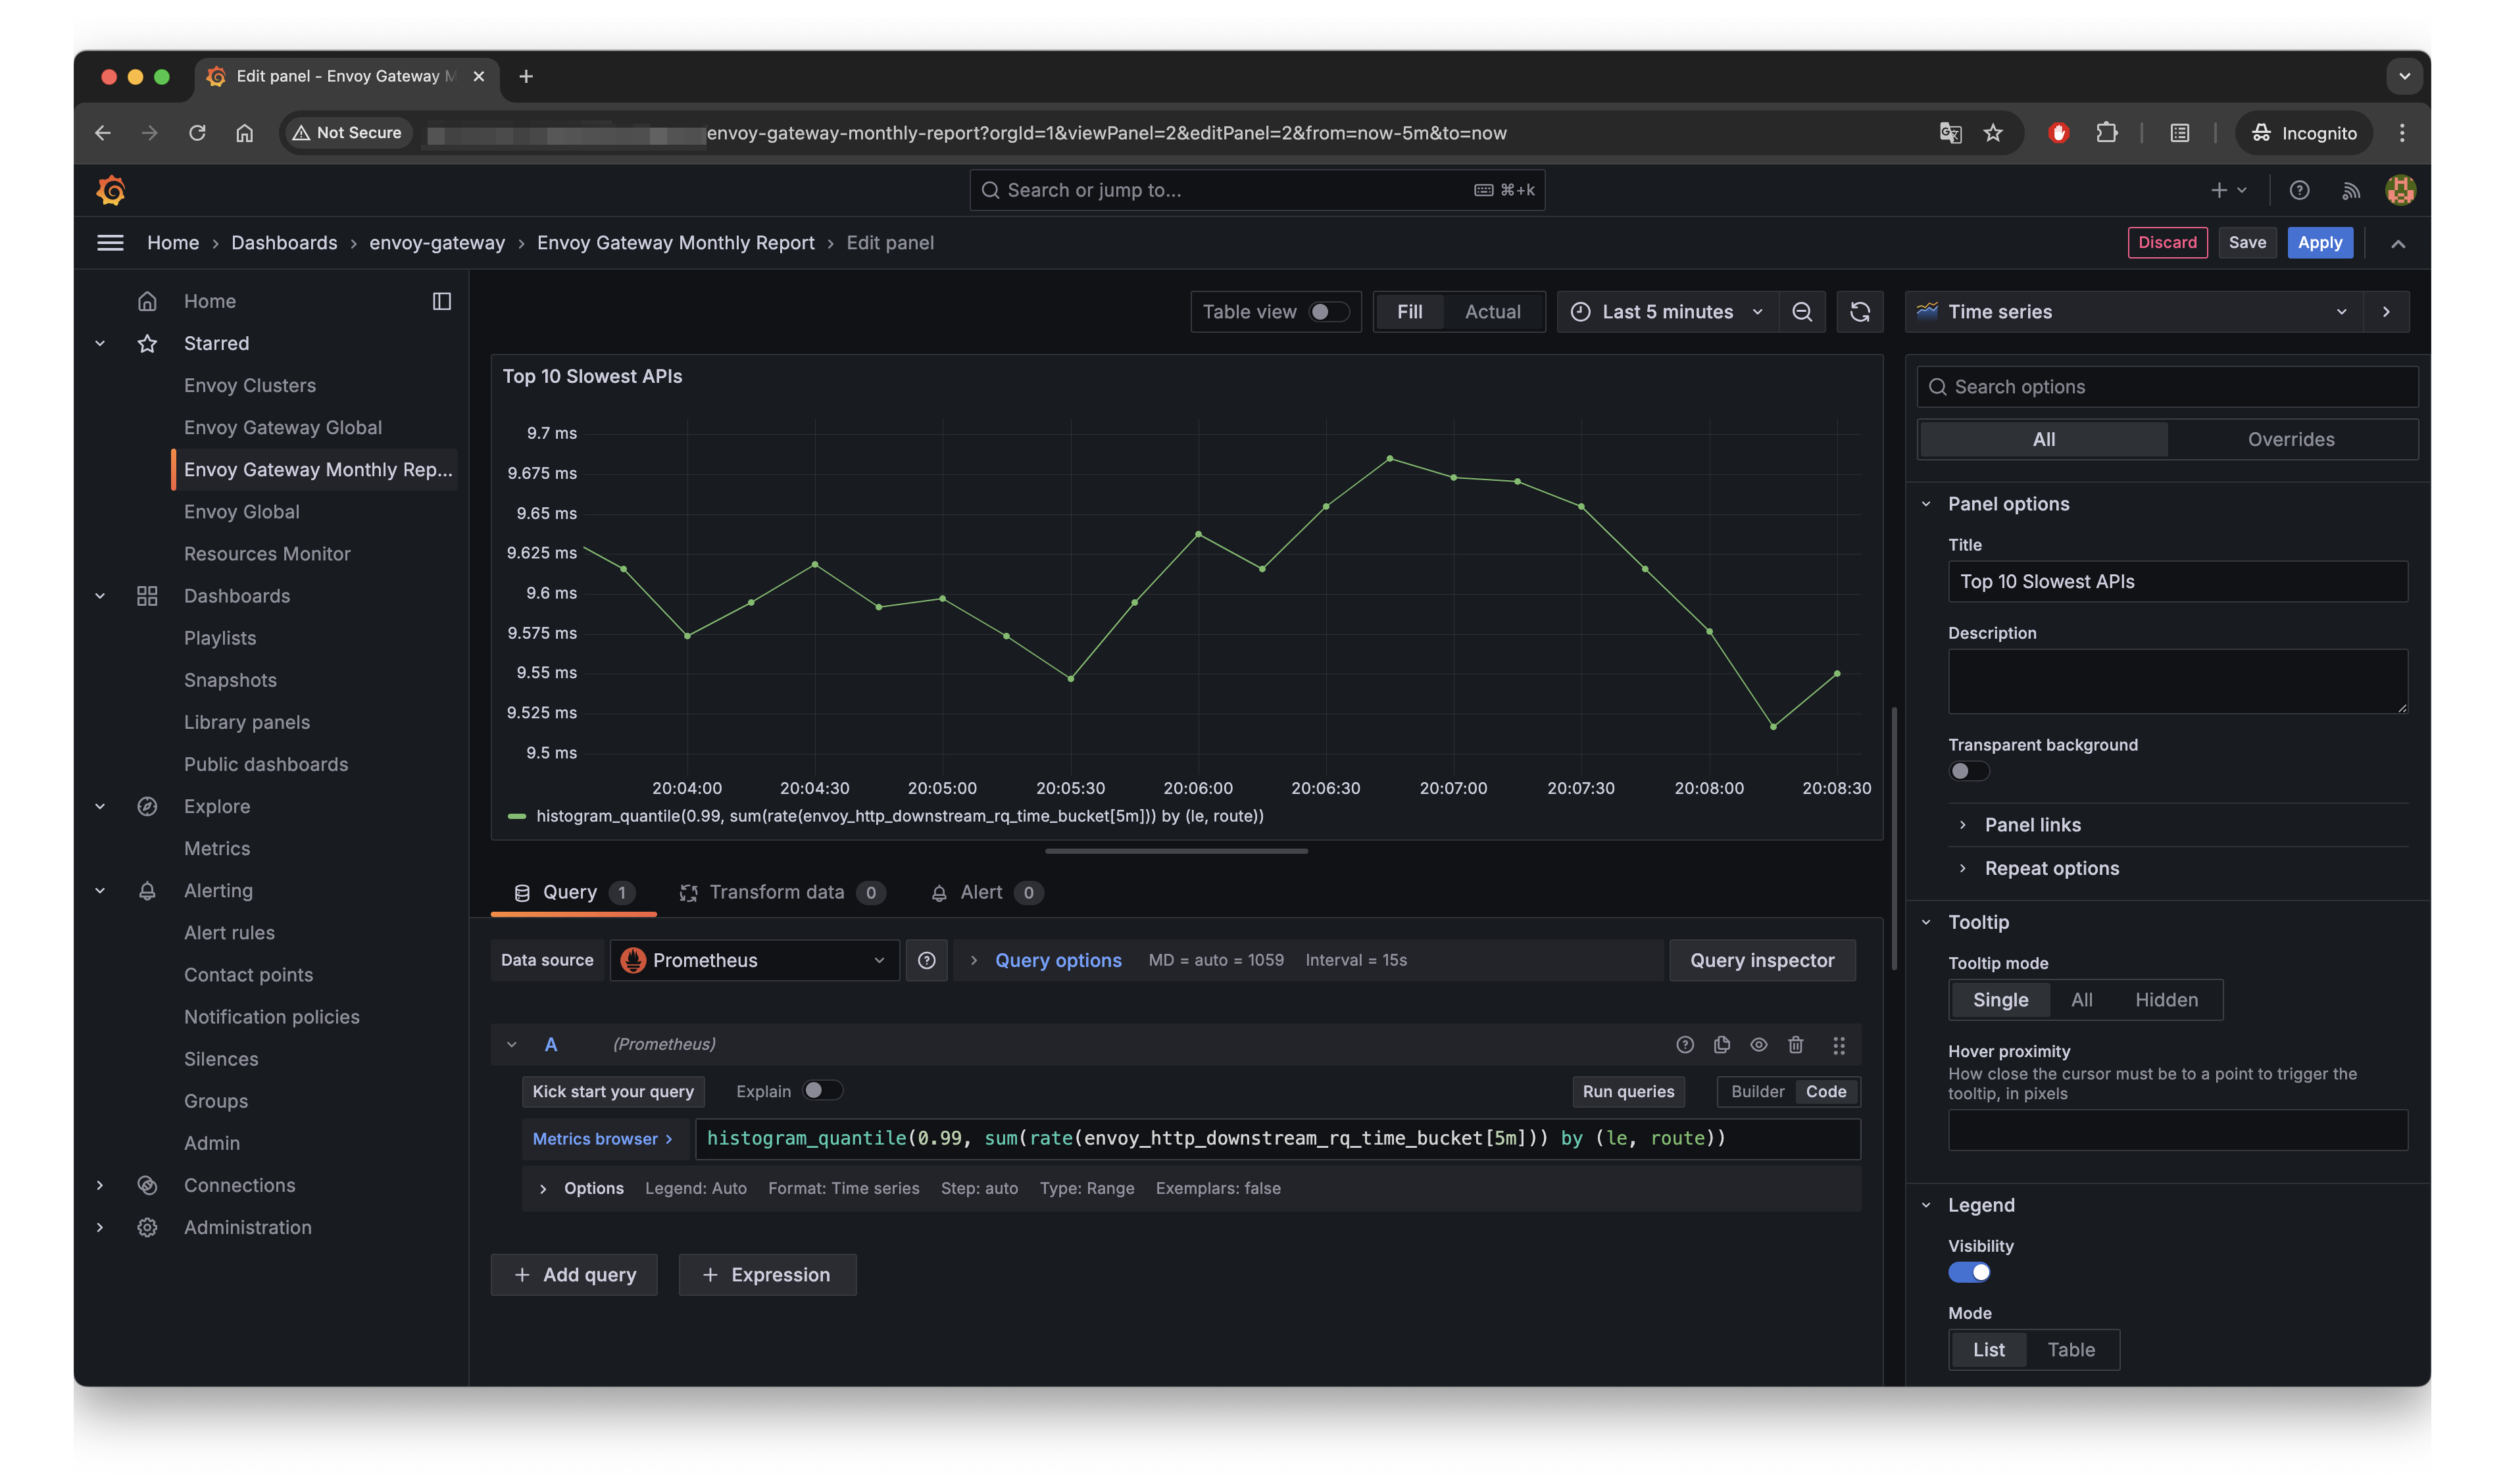
Identifying the Top 10 Slowest APIs
-
In Prometheus, use the following query to get the response time of APIs:
topk(10, histogram_quantile(0.99, sum(rate(envoy_cluster_upstream_rq_time_bucket{envoy_cluster_name=~"$cluster"}[5m])) by (le, envoy_cluster_name, envoy_route_name))) -
This query gives you the 99th percentile response time for each route.
-
In Grafana, create a new panel with this query and sort the results to identify the top 10 slowest APIs.
-
Save this panel to your dashboard for continuous monitoring.
Example: Detailed Grafana Dashboard Setup
- Create a new dashboard in Grafana.
- Add a new panel with the title "Monthly Traffic Report".
- Use the Prometheus query provided above to display monthly traffic.
- Add another panel titled "Top 10 Slowest APIs".
- Use the response time query and configure the panel to display the top 10 results.