Troubleshooting Applications
Application Troubleshooting can be done using the TIS+ User Interface using the various graphical views available to indicate the service health, inter-service communication within a cluster or across clusters, and proxy-service communication. The TIS+ UI shows a real time view of this information, as well as gives, by default, a historical view for the previous 7 days of activity.
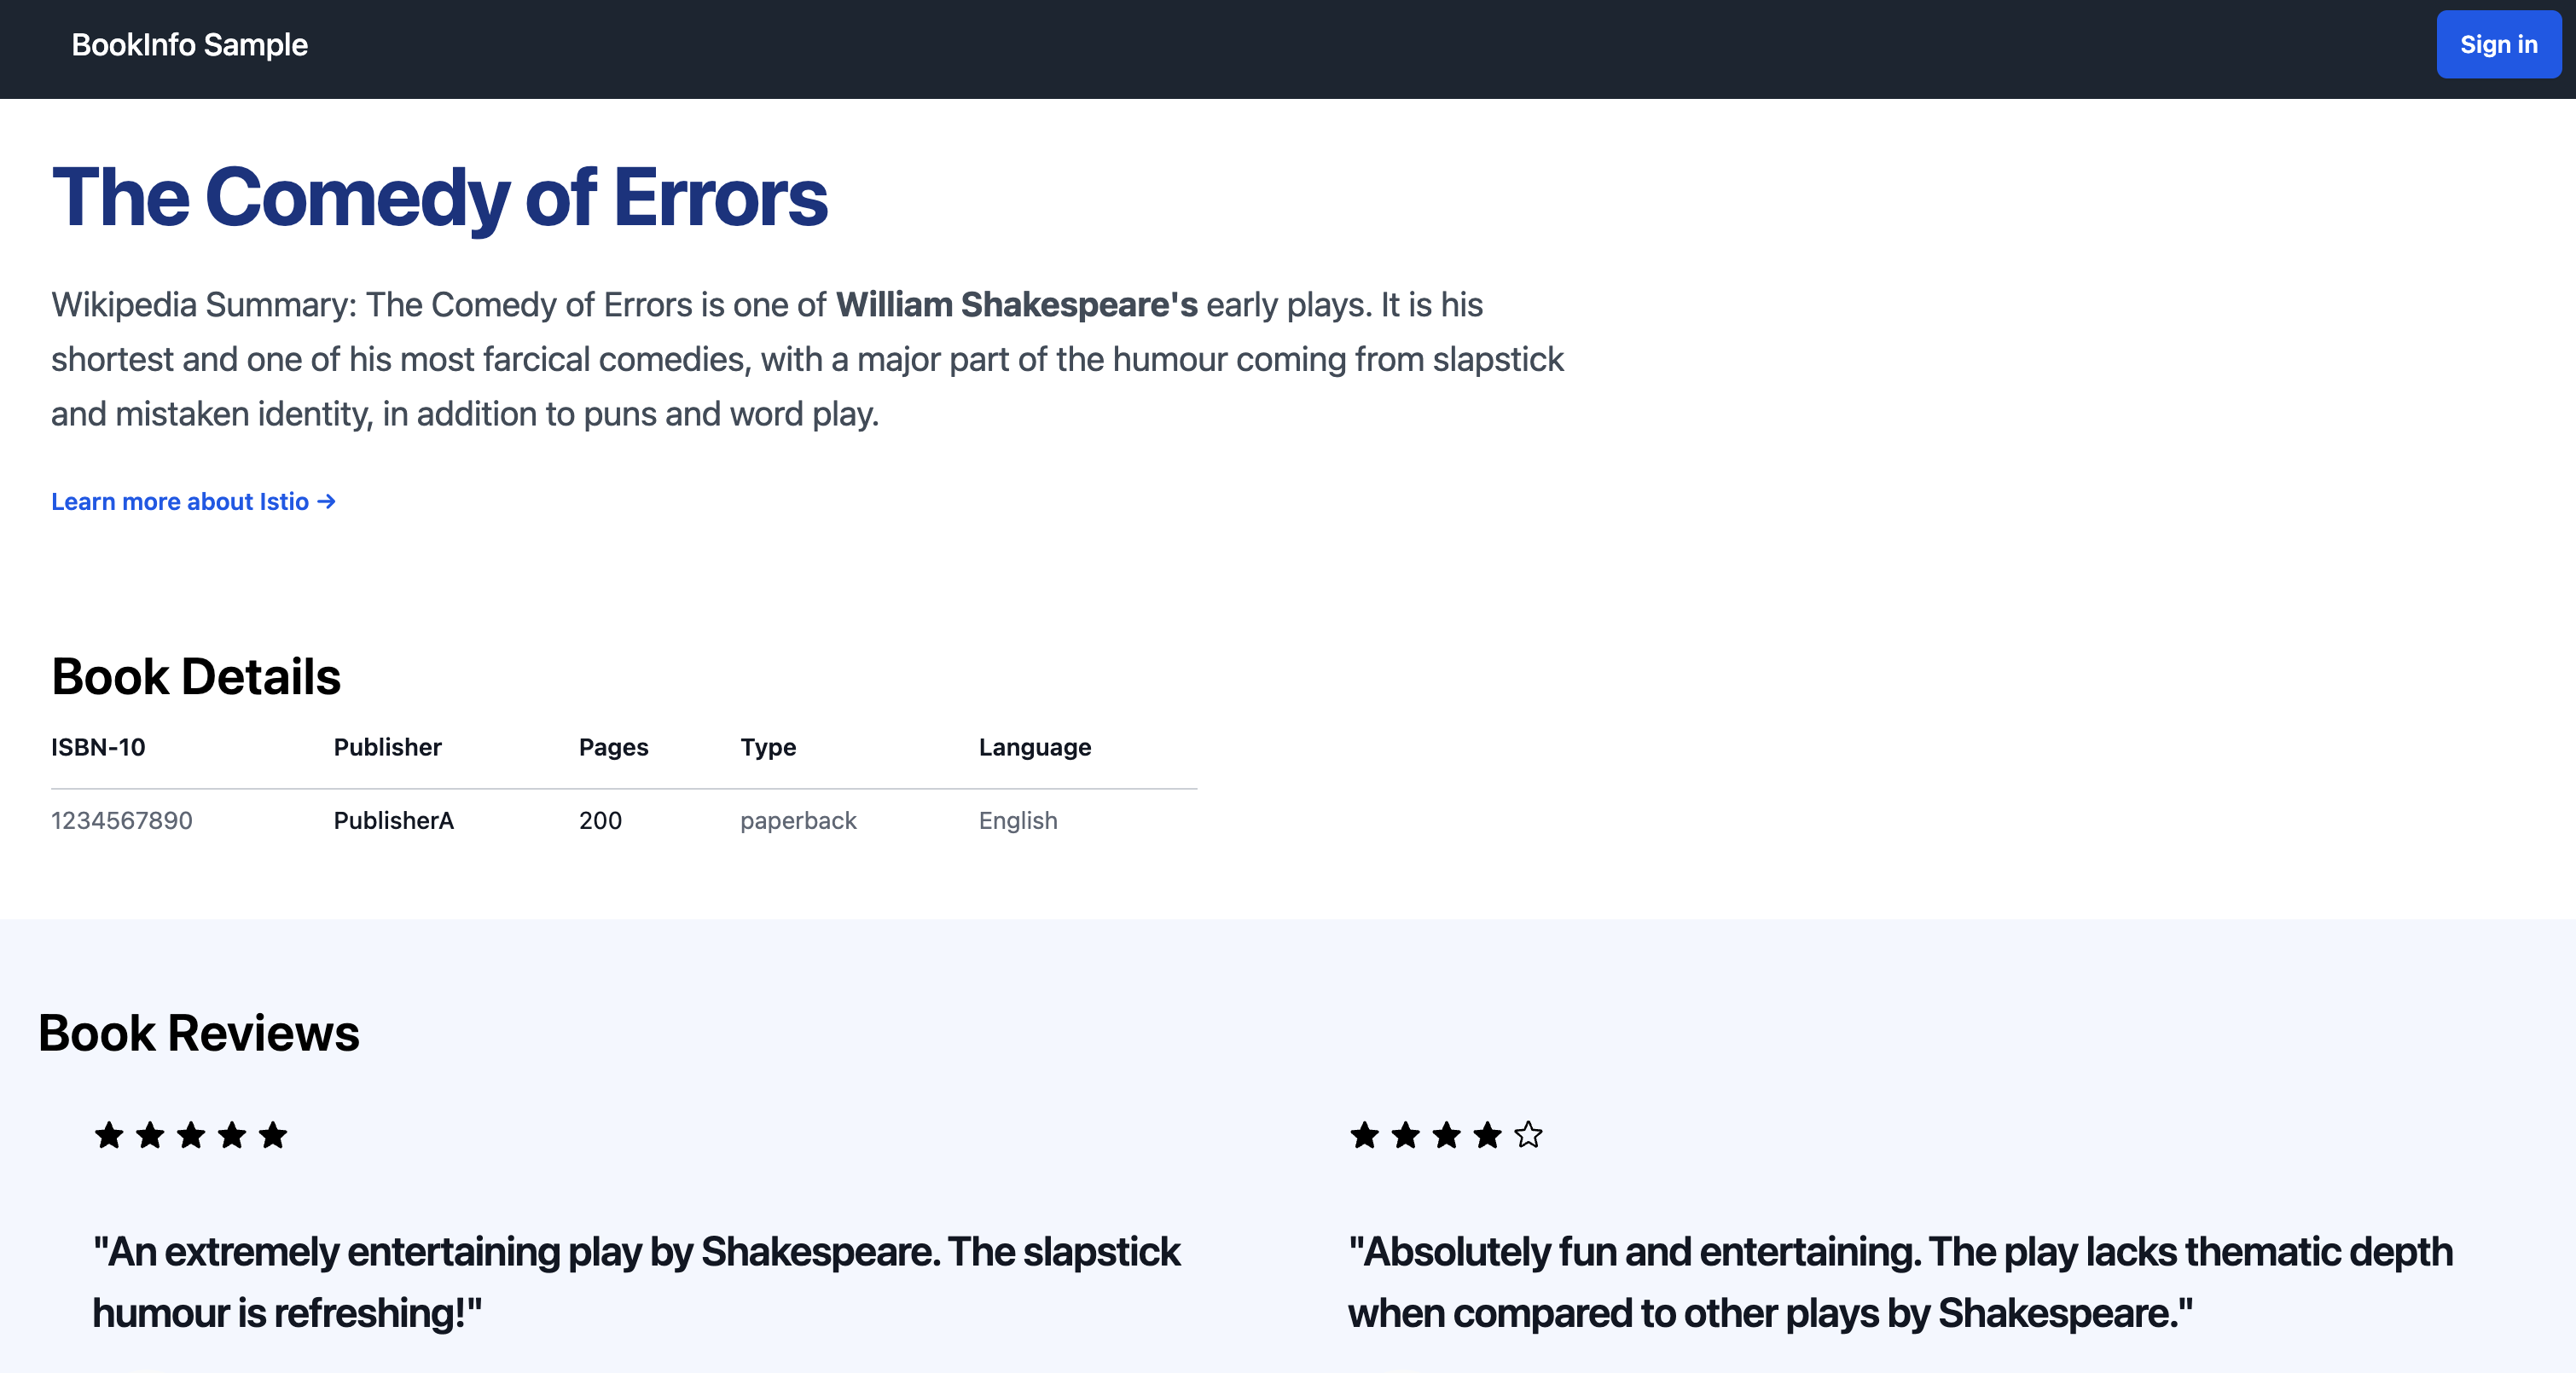
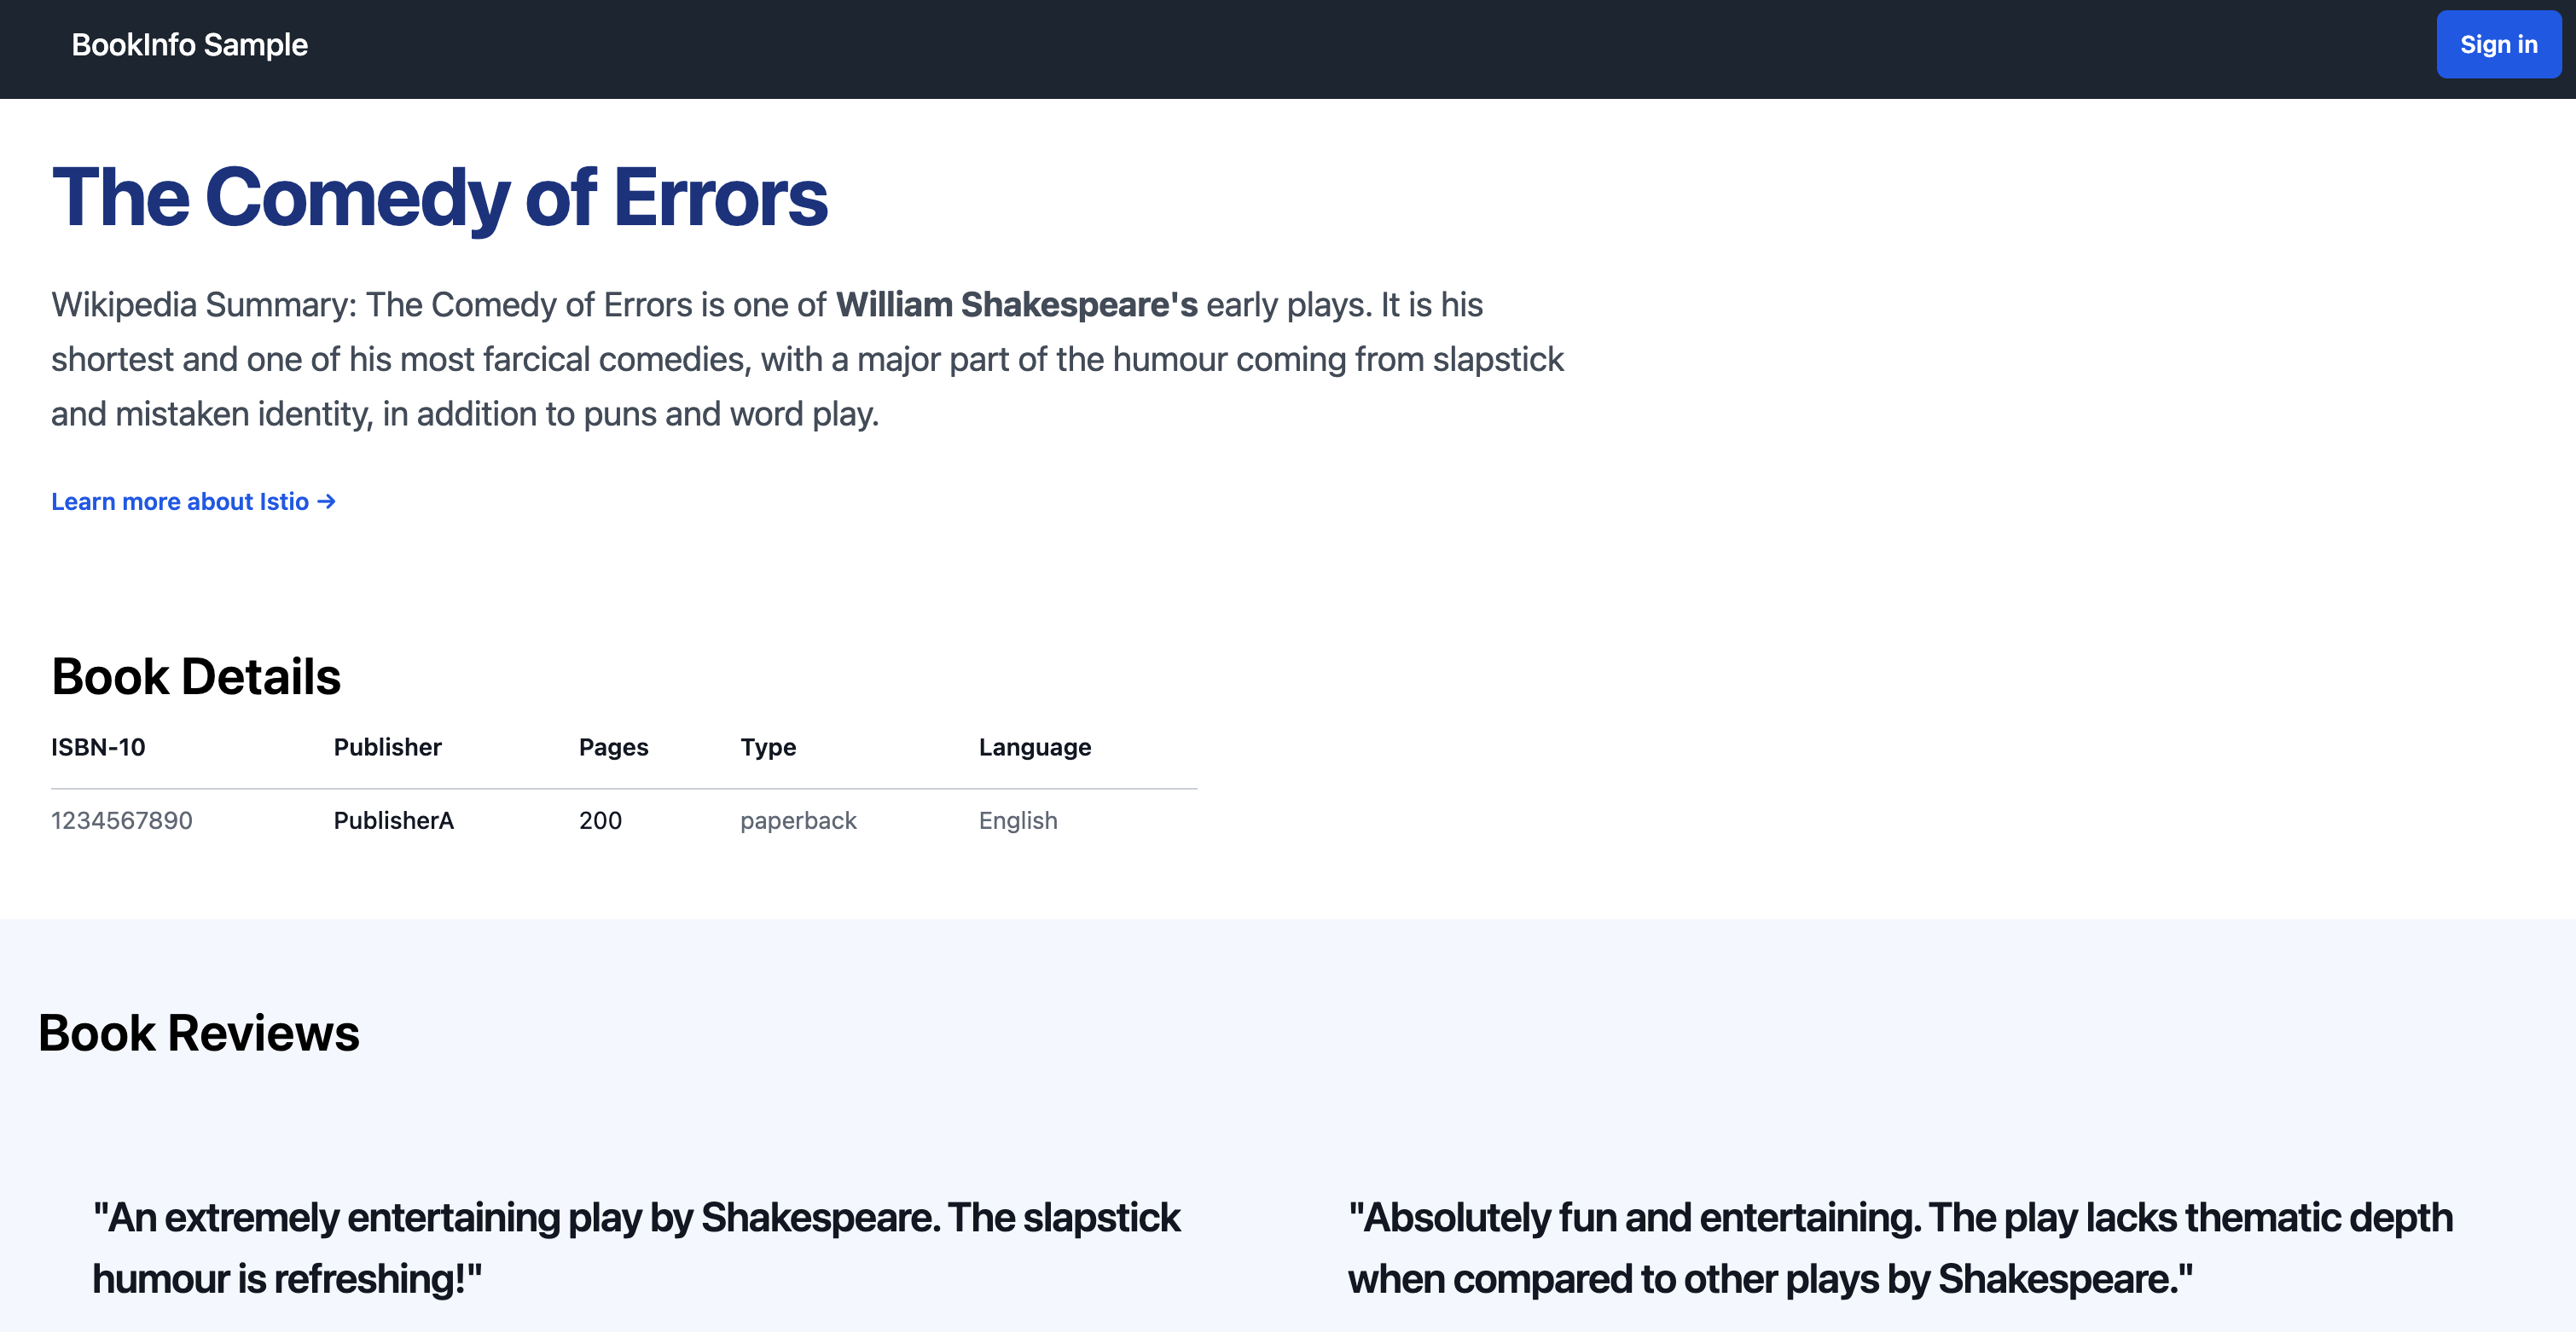
As an example, let us look at a situation that Application Teams encounter on a regular basis. The Application Team has a problem where users have reported that every once in a while, parts of the web page that is backed by the application are missing or take a long time to load. How can the team quickly identify the issue, and its cause?
 |  |
|---|---|
| Webpage with Ratings(*) | Webpage without Ratings(*) |
Service Dashboard
When logging in for the first time, please select the Clusters and Namespaces that you want to monitor with the use of the button on the top left of the UI.
- On the left panel, select Dashboard
- Click Select Clusters-Namespaces
- Select the cluster and namespace containing the application you are testing
When you log into the TIS+ UI, you will see the Service Dashboard that lists all the Services that are monitored along with location, health, metrics, and shortcut options to run operations on each service. For a small deployment, you can drill down into a service that is showing an unhealthy state (in the current case, the ratings service, or the details service).
For a large deployment, this list could be fairly big, therefore a map view like the Service Topology is a better option to start your troubleshooting session.
In the current example, we will follow the Service Topology view.
 TIS Plus Dashboard UI: Service Dashboard TIS Plus Dashboard UI: Service Dashboard |
|---|
Service Topology
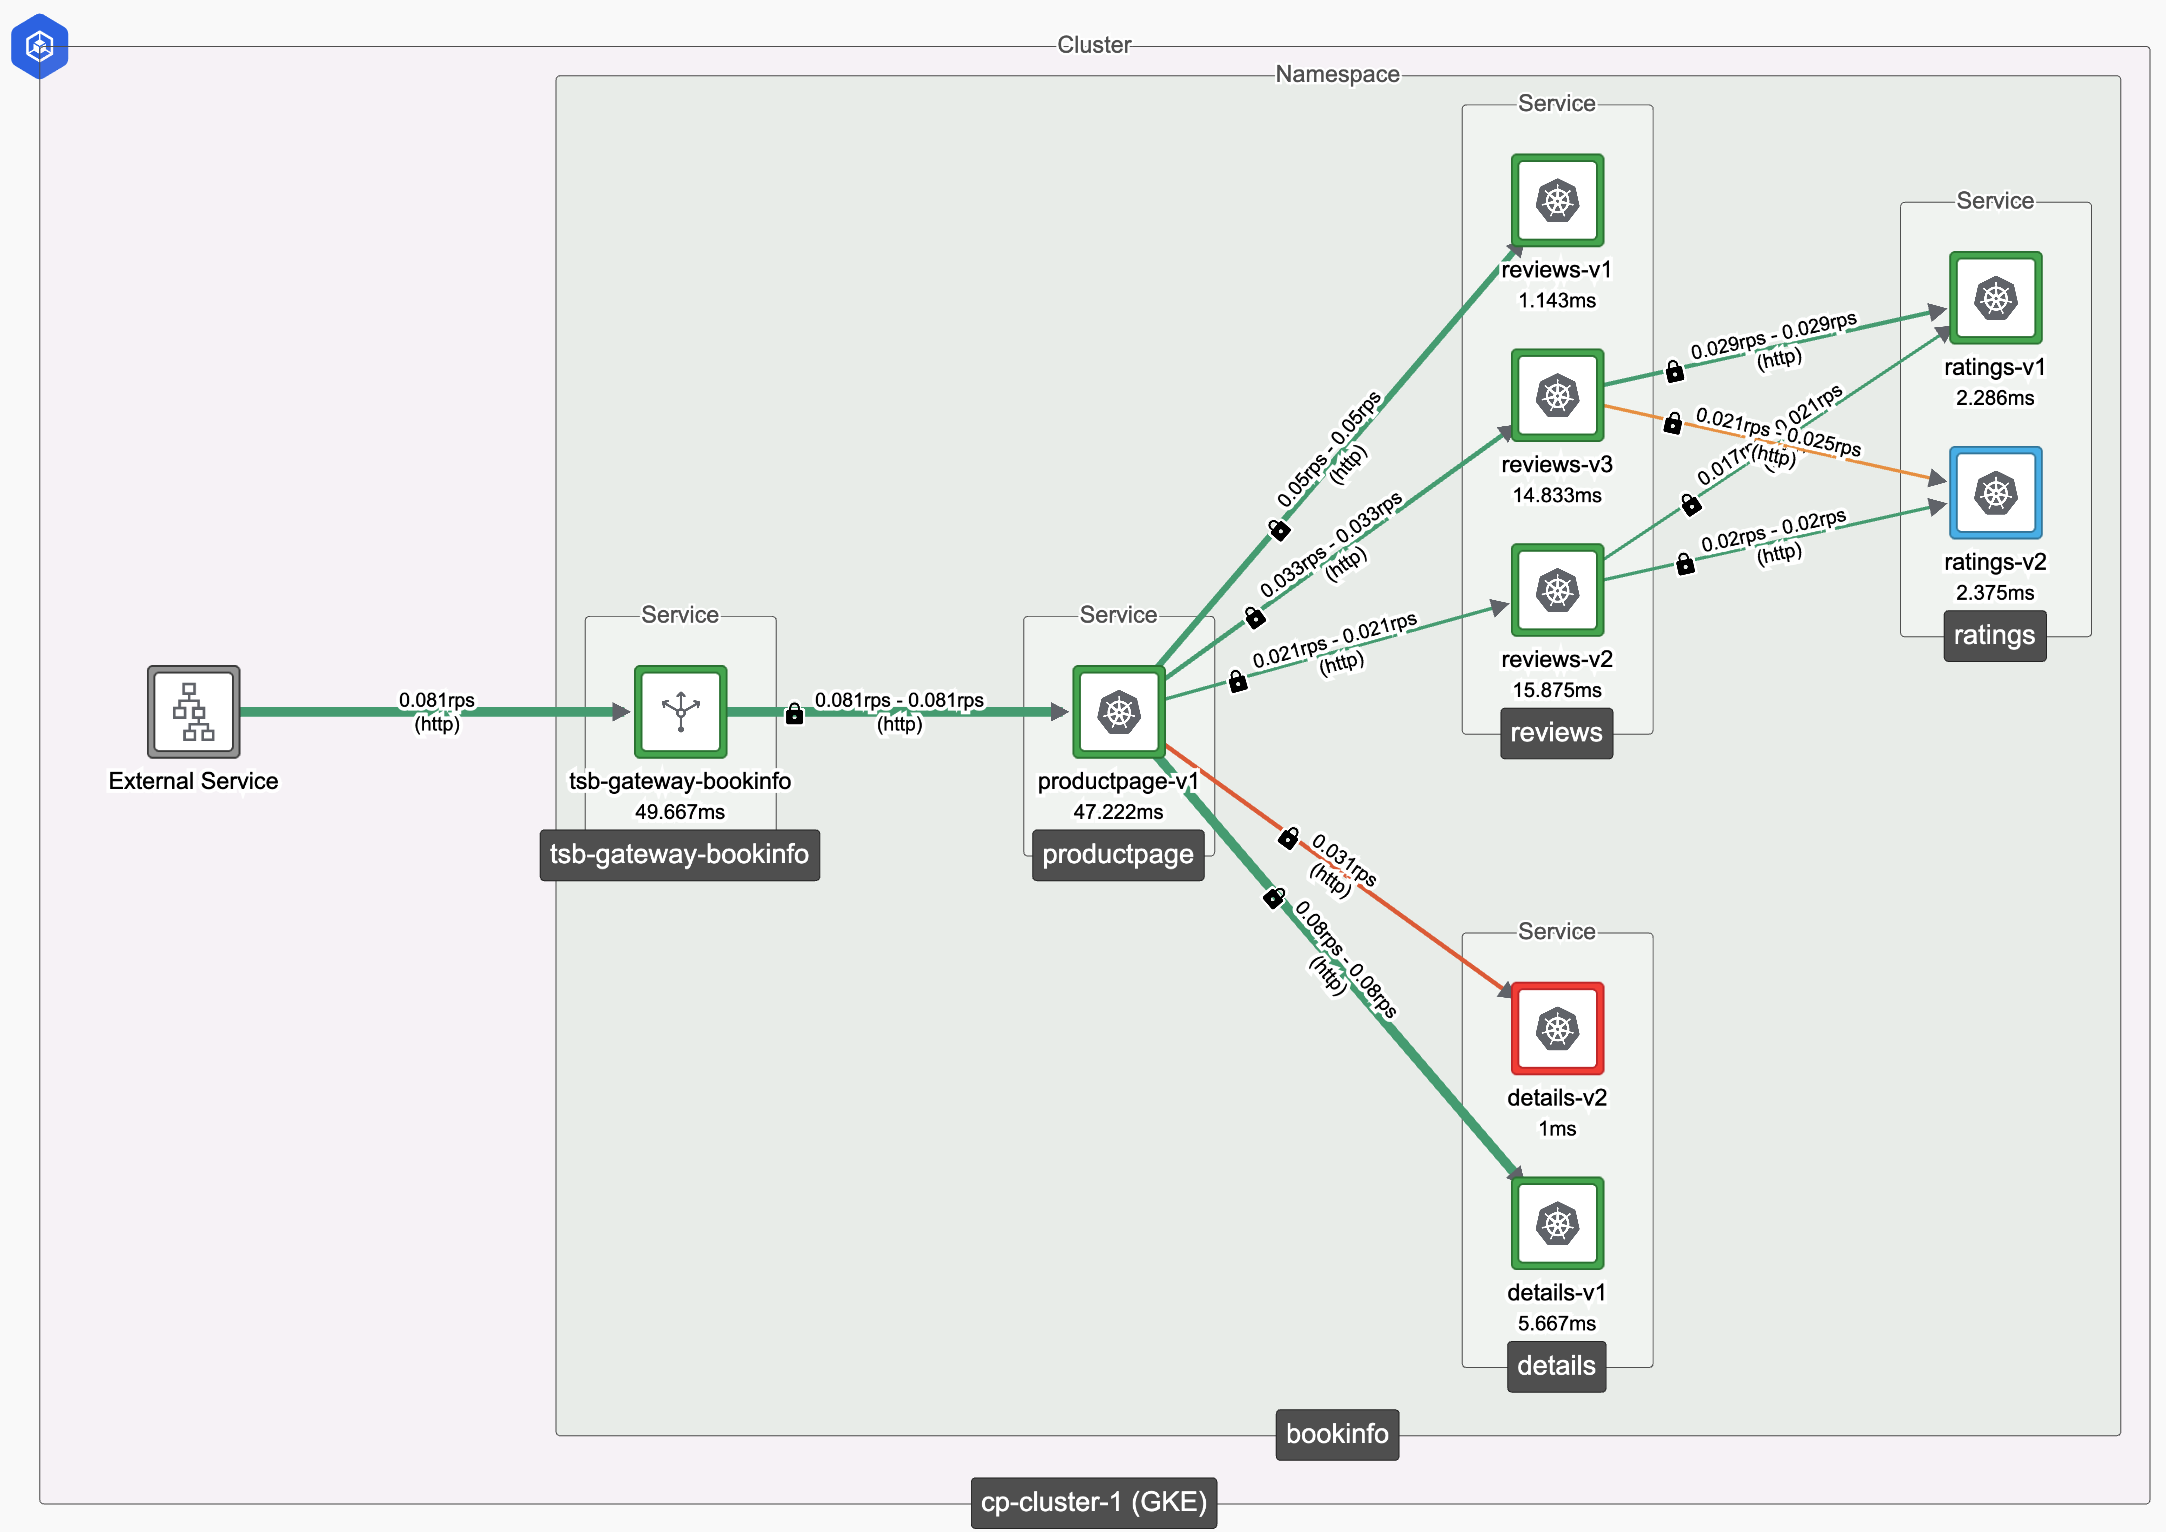
The Topology gives you a top level of your entire deployment with a color-coded view of individual Services' health status in terms of Tetrate's abstraction of Istio's Golden Signals.
 TIS Plus Dashboard UI: Service Topology TIS Plus Dashboard UI: Service Topology |
|---|
From the Service Topology, you can right away see that one of the ratings microservice (ratings-v2) instances is in an unhealthy state. The user can also see that one of the details services (details-v2) is also in an unhealthy state. In order to investigate the ratings-v2 service, click on the service for a more detailed view.
Aggregated and Detailed Metrics
 |  |
|---|---|
| ratings-v1 with no 5xx errors | ratings-v2 with 5xx errors |
You can see that the ratings-v2 service is throwing 5xx errors regularly and is therefore in an “Unacceptable” health state.
As the web page’s ratings are served by both instances of the ratings service, whenever ratings-v2 is being invoked, the resulting 5xx error may be causing the ratings to be not displayed on the web page.
The user can run a trace to see the end to end call flow. This trace will indicate the point of failure, and will work seamlessly even if the services along the call path fall in different clusters.
Call Tracing
If you are running non-sidecar clusters, then the level of tracing will depend on the type of cluster. If you are running Ambient mode clusters, then you will see traces for only those services that have a Waypoint (Layer 7 Envoy Proxy) configured for them.
For eBPF Clusters, individual services will need to have tracing instrumentation in place.
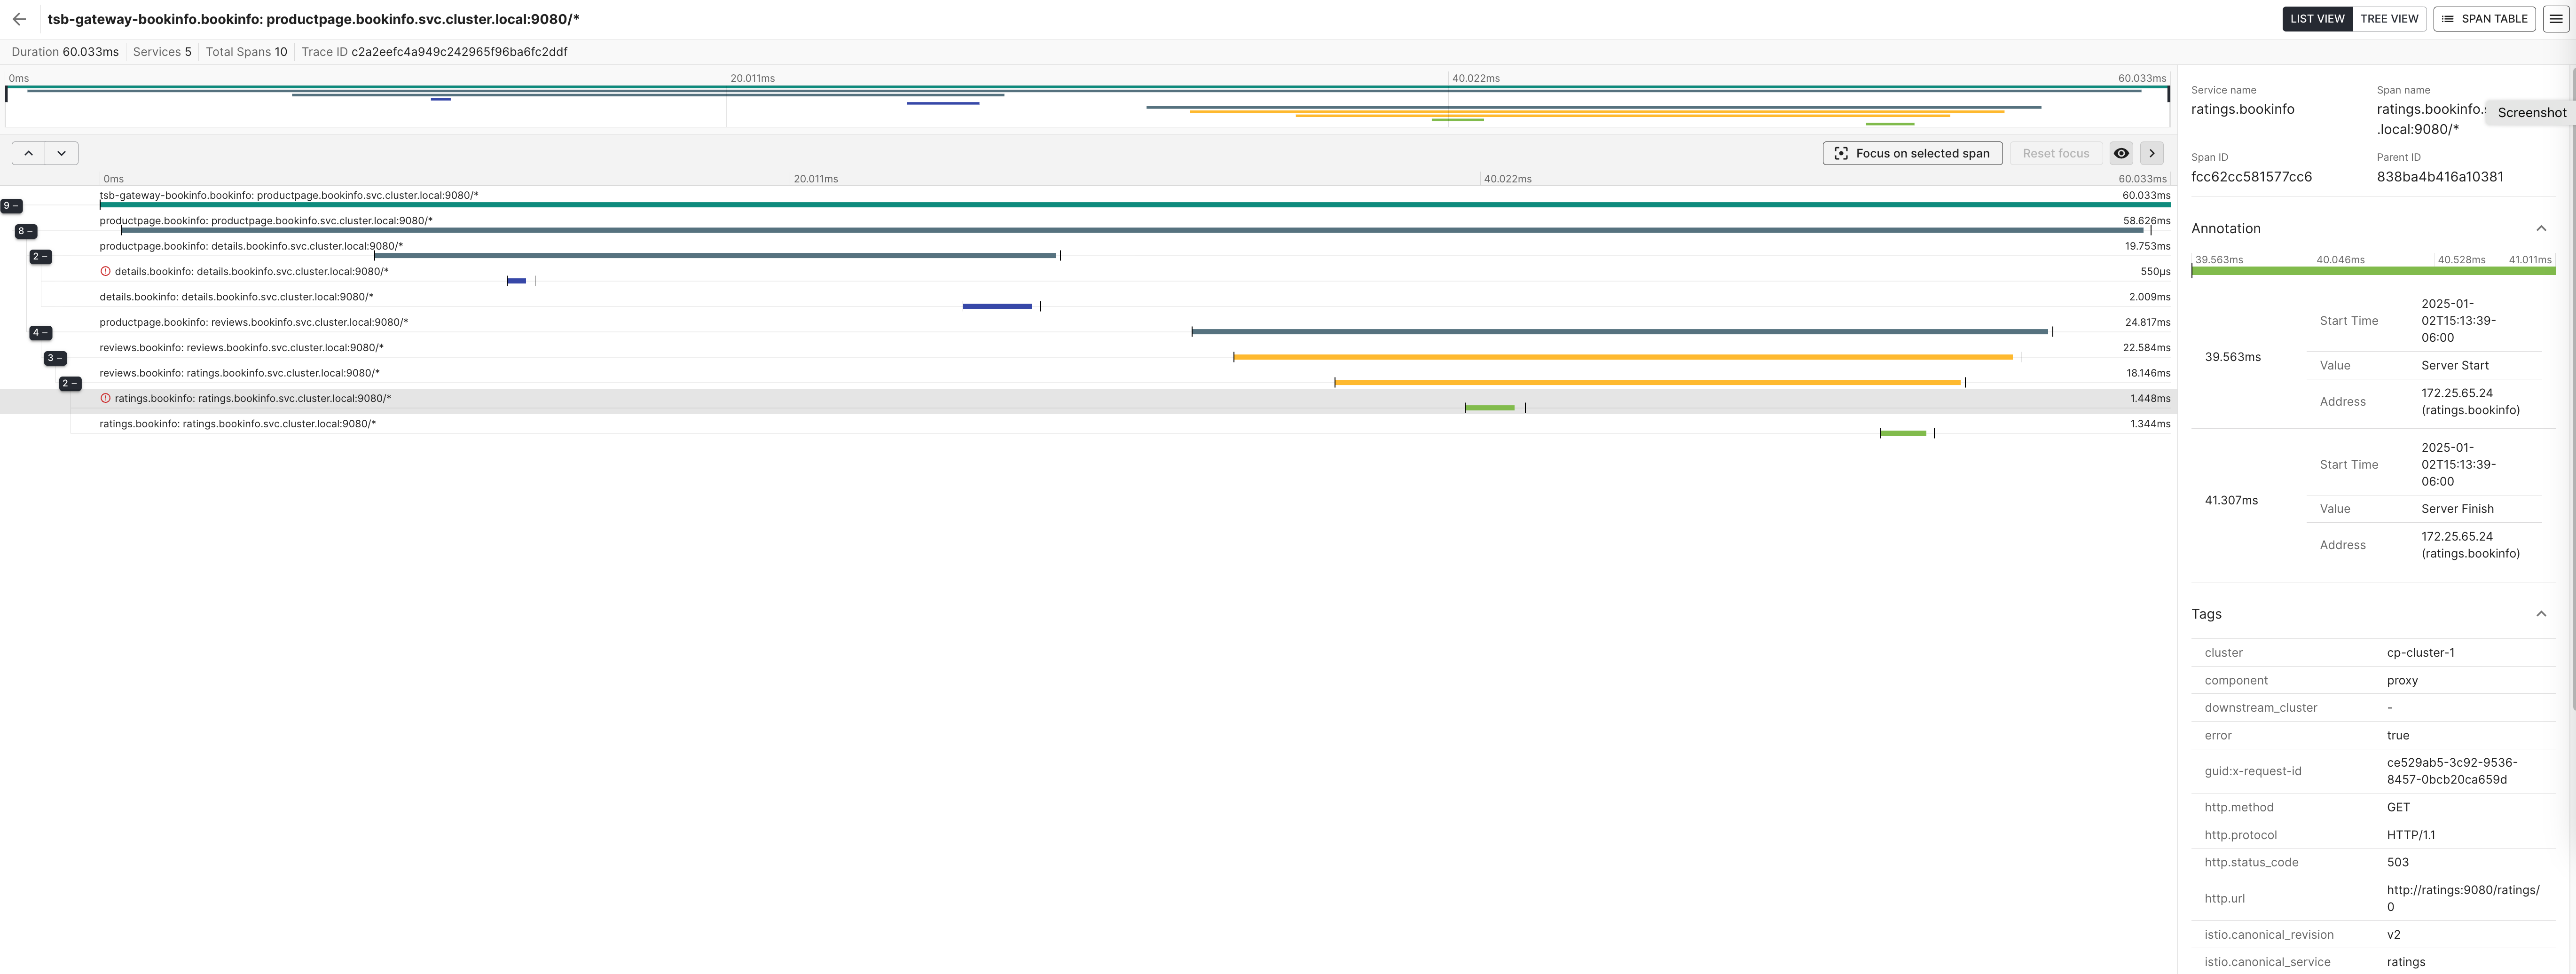
 TIS Plus UI: Call Trace and failure point TIS Plus UI: Call Trace and failure point |
|---|
When you run a trace, the point of failure is clearly shown as highlighted and is the cause of the 503 error.
We can interpret this trace, understanding that:
- tsb-gateway-bookinfo.bookinfo calls productpage.bookinfo.svc.cluster.local:9080, invoking service productpage in namespace bookinfo
- productpage.bookinfo first calls details.bookinfo.svc.cluster.local:9080, invoking details in namespace bookinfo
- productpage.bookinfo later calls reviews.bookinfo.svc.cluster.local:9080, invoking reviews in namespace bookinfo
- reviews.bookinfo calls ratings.bookinfo.svc.cluster.local:9080, invoking ratings in namespace bookinfo
We can see the deltas in time between the caller making the calls, and the callee reading and responding. The deltas correspond to the (typically small) latency of the network call and the mesh sidecar proxies.
We can also see that the ratings call as a red exclamation point which indicates failure. By clicking on that call, you can see the details of the failure in the right panel indicating a 503 error.
Logging
Logs are not available for clusters in Ambient mode and eBPF mode
Next, you can look at the logs that are coming from the ratings-v2 service along with its proxy.
 TIS Plus UI: Logs from ratings-v2 along with its proxy showing 503 errors TIS Plus UI: Logs from ratings-v2 along with its proxy showing 503 errors |
|---|
The logs show that ratings-v2 service is returning 503 error, and is the cause of the ratings on the web page not showing up whenever it is invoked. You can also check that ratings-v1 returns 200 return codes (or is in healthy state).
Proxy Tools
The user can also take a deeper look into the Envoy Proxy using the detailed analysis available through the Proxy Tools which show the metrics, configuration, and endpoint health amongst other things.
What did we learn?
The user, through the easily navigable graphical views, was able to identify and isolate the issue to a faulty service (ratings-v2). Being a new service operating in tandem to the healthy ratings-v1 service, the error could possibly have been introduced when ratings-v2 was brought in. Once ratings-v2 is fixed, the error will be eliminated. Similarly, the details-v2 service can be troubleshot which causes that section of the webpage to load very slowly.