 Tetrate Istio SubscriptionVersion: Next
Demo Installation
This section provides a step-by-step guide for setting up the demo Istio monitoring dashboard, utilizing Prometheus and Grafana.
Prerequisites
Before proceeding, ensure the following prerequisites are met:
- TID is successfully installed and operational.
- Helm is installed.
Installation
Execute the command below to install the istio-monitoring-demo Helm chart. This will set up Prometheus and Grafana within the tis namespace, and configure Istio dashboards and alerting rules.
helm repo add tis-addons https://tis.tetrate.io/charts
helm repo update
helm install istio-monitoring-demo tis-addons/istio-monitoring-demo --namespace tis --create-namespace
If you wish to skip the installation of either Prometheus or Grafana, you can do so by setting the respective values to false in the command:
helm install istio-monitoring-demo tis-addons/istio-monitoring-demo --namespace tis --create-namespace --set prometheus.enabled=false
helm install istio-monitoring-demo tis-addons/istio-monitoring-demo --namespace tis --create-namespace --set grafana.enabled=false
By default, kube-state-metrics chart will be installed. This is required to get proxy CPU and memory utilization.
You can disable it by setting the respective values to false in the command:
helm install istio-monitoring-demo tis-addons/istio-monitoring-demo --namespace tis --create-namespace --set kube-state-metrics.enabled=false
Accessing Grafana
To access Grafana, run the following command to port-forward the Grafana pod to your local machine.
kubectl port-forward --namespace tis svc/grafana 3000:3000
Importing Dashboard and Alerting Rules
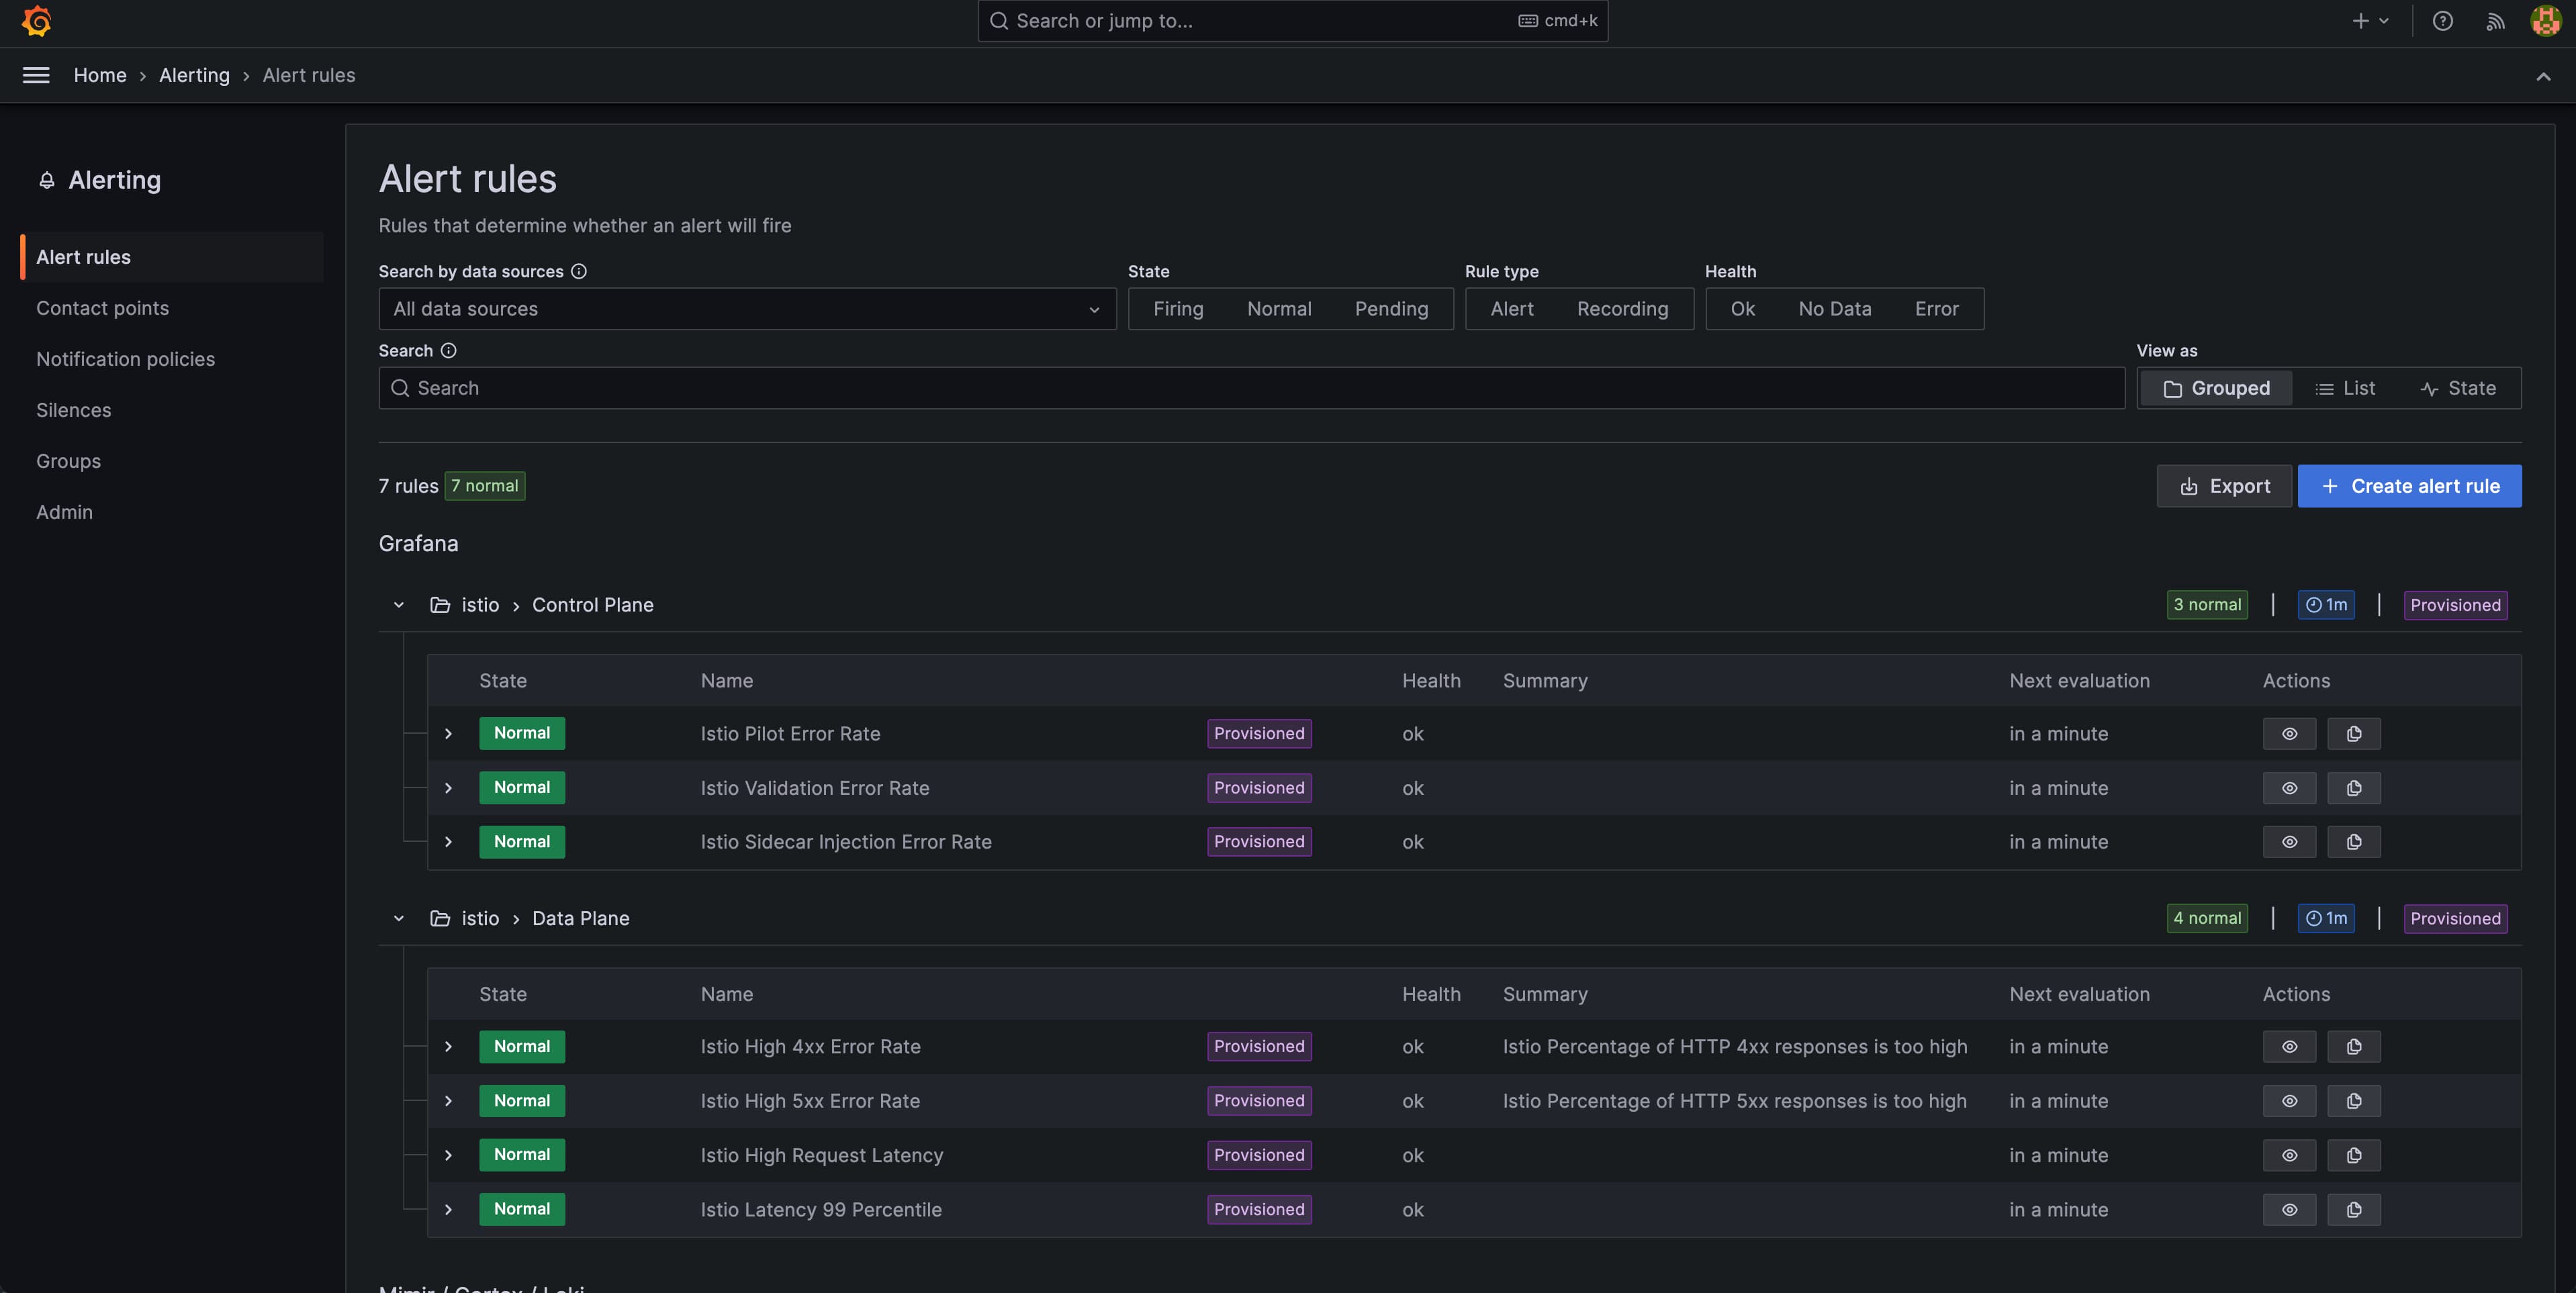
You can import the TIS Grafana dashboard and monitoring rules using the methods described in Configuring Istio Monitoring.
When the configuration is complete, you should see the following imported dashboard and altering rules in Grafana:

Advanced Customization
The istio-monitoring-demo comes with pre-built dashboards and alert rules designed to cover most common Istio monitoring use cases. However, there may be situations where you need to extend or customize these capabilities to meet specific requirements.
Consider creating custom dashboards when:
- You need to monitor specific services or workloads with metrics not covered in the pre-built dashboards
- Your organization requires specialized visualizations for particular Istio components
- You want to combine Istio metrics with other application or infrastructure metrics
- You need to create executive or team-specific views of service mesh performance
Consider creating custom alert rules when:
- You need to monitor thresholds specific to your environment or SLAs
- You want to create tiered alerting for different severity levels
- You need to alert on metrics not covered by the default rules
- Your organization has specific notification requirements
Creating a Grafana Dashboard
To create a Grafana dashboard for Istio monitoring, follow these steps:
-
Creating a Dashboard:
- Click on the menu icon on the left sidebar and select "Dashboard".
- Click on the "New" button and select "New Dashboard" to add a visualization to your dashboard.
- In the panel settings, select the desired data source (Prometheus).
- Define the query or metric you want to visualize. You can use PromQL to specify the metric.
-
Customizing the Panel:
- Adjust visualization settings, thresholds, and other options as needed.
- You can choose different chart types, configure axes, and add additional metrics or series.
-
Saving the Dashboard:
- Click the "Save" button in the top-right corner of the panel to save it.
- Provide a name and choose the folder where you want to save the dashboard.
- Optionally, you can set a time range for the dashboard.
-
Viewing and Editing Dashboards:
- To view your dashboard, click on the menu icon on the left sidebar and select "Dashboards". Choose the dashboard you created.
-
Further Customizations:
- You can continue to add panels, customize visualizations, and refine your dashboard to meet your specific monitoring needs.
Remember to regularly review and refine your dashboards based on your evolving monitoring requirements and the insights you gain from them. Learn more about creating a Grafana dashboard on the Grafana documentation.
Setting Up an Alert Rule
To establish an alert rule for Istio monitoring in Grafana, follow these steps:
-
Navigate to the Dashboard:
- Click on the menu on the left sidebar and select "Dashboards". Choose the dashboard where you want to set up the alert rule.
-
Edit Dashboard:
- Click on the menu icon in the top-right corner of the panel and select "Edit".
-
Define Alert Condition:
- In the panel settings, switch to the "Alert" tab.
- Click on "Create alert rule from this panel".
- Define the condition for your alert. This includes the metric, evaluation interval, and thresholds.
-
Set up Notification Channels:
- Scroll down to the "Notifications" section.
- Click on "Add Channel" to set up a notification channel for the alert. This can be Slack, Email, or other supported channels.
-
Configure Alert Rules:
- Define the conditions for when the alert should trigger. This includes the evaluation interval, thresholds, and other parameters.
-
Add a Contact Point:
- Use contact points to define how your contacts are notified when an alert rule fires. You can create, edit, delete, and test a contact point. Learn how to add a contact point from Grafana documentation.
-
Save the Panel:
- Click the save button in the top-right corner of the panel to save it.
Remember to regularly review and fine-tune your alert rules based on your monitoring needs and the insights gained from them. Additionally, ensure that your notification channels are correctly configured to receive alerts when triggered. Learn more about the alert rules on the Grafana documentation.