Tetrate Istio SubscriptionVersion: Next
Istio Monitoring
Overview
Tetrate Istio Subscription offers an enhanced Grafana dashboard for Istio, building upon the foundation of the Istio Grafana dashboard. These enhancements are crafted based on Tetrate's extensive experience and industry best practices. This now includes a dedicated control plane health dashboard, leveraging golden metrics to provide deeper insights into istiod's health and performance. Tetrate is committed to supporting and maintaining this dashboard, ensuring it remains compatible with the supported TID release.
In addition to the dashboard, TIS Istio monitoring provides a set of recommended alerting rules for Istio, empowering you to configure alerts tailored to your Istio deployment.
Utilizing the Grafana Dashboard
You have two options to make use of the dashboard:
-
Using demo setup: This option facilitates a straightforward installation of Prometheus and Grafana. After installation, you can seamlessly import the TIS Grafana dashboard and alert rules using the methods described in Configuring Istio Monitoring. This is the quickest way to kickstart your monitoring.
-
Your own Grafana setup: If you already have a Grafana setup, this option allows you to integrate the Istio dashboard and alerting rules effortlessly using the methods described in Configuring Istio Monitoring. It's ideal for those who wish to augment their existing Grafana environment with Istio monitoring capabilities.
For production deployments, it's advisable to use your own Grafana setup. The demo setup is primarily intended for demonstration and testing purposes.
To support the latest version which includes multi-mesh/cluster capabilities, you must update you Prometheus global configuration or scrape config to add cluster_id and mesh_id, regardless of whether you use multi-cluster or not:
    global:
      external_labels:
        cluster_id: Kubernetes # Change this to your cluster name
        mesh_id: cluster.local # Change this to your mesh name
If you're using the demo installation from demo Helm charts, you will need to upgrade to the latest version.
See demo Helm charts values for example of how to configure cluster_id and mesh_id in scrape config.
Available Istio Dashboards
The TIS Grafana Dashboard includes preconfigured dashboards for monitoring the service mesh and istiod control plane. Additionally, a customized dashboard specifically uses golden metrics to assess istiod's health and performance.
- TIS Control Plane Health Dashboard
- TIS Control Plane Dashboard
- TIS Service Dashboard
- TIS Workload Dashboard
- TIS Wasm Extension Dashboard
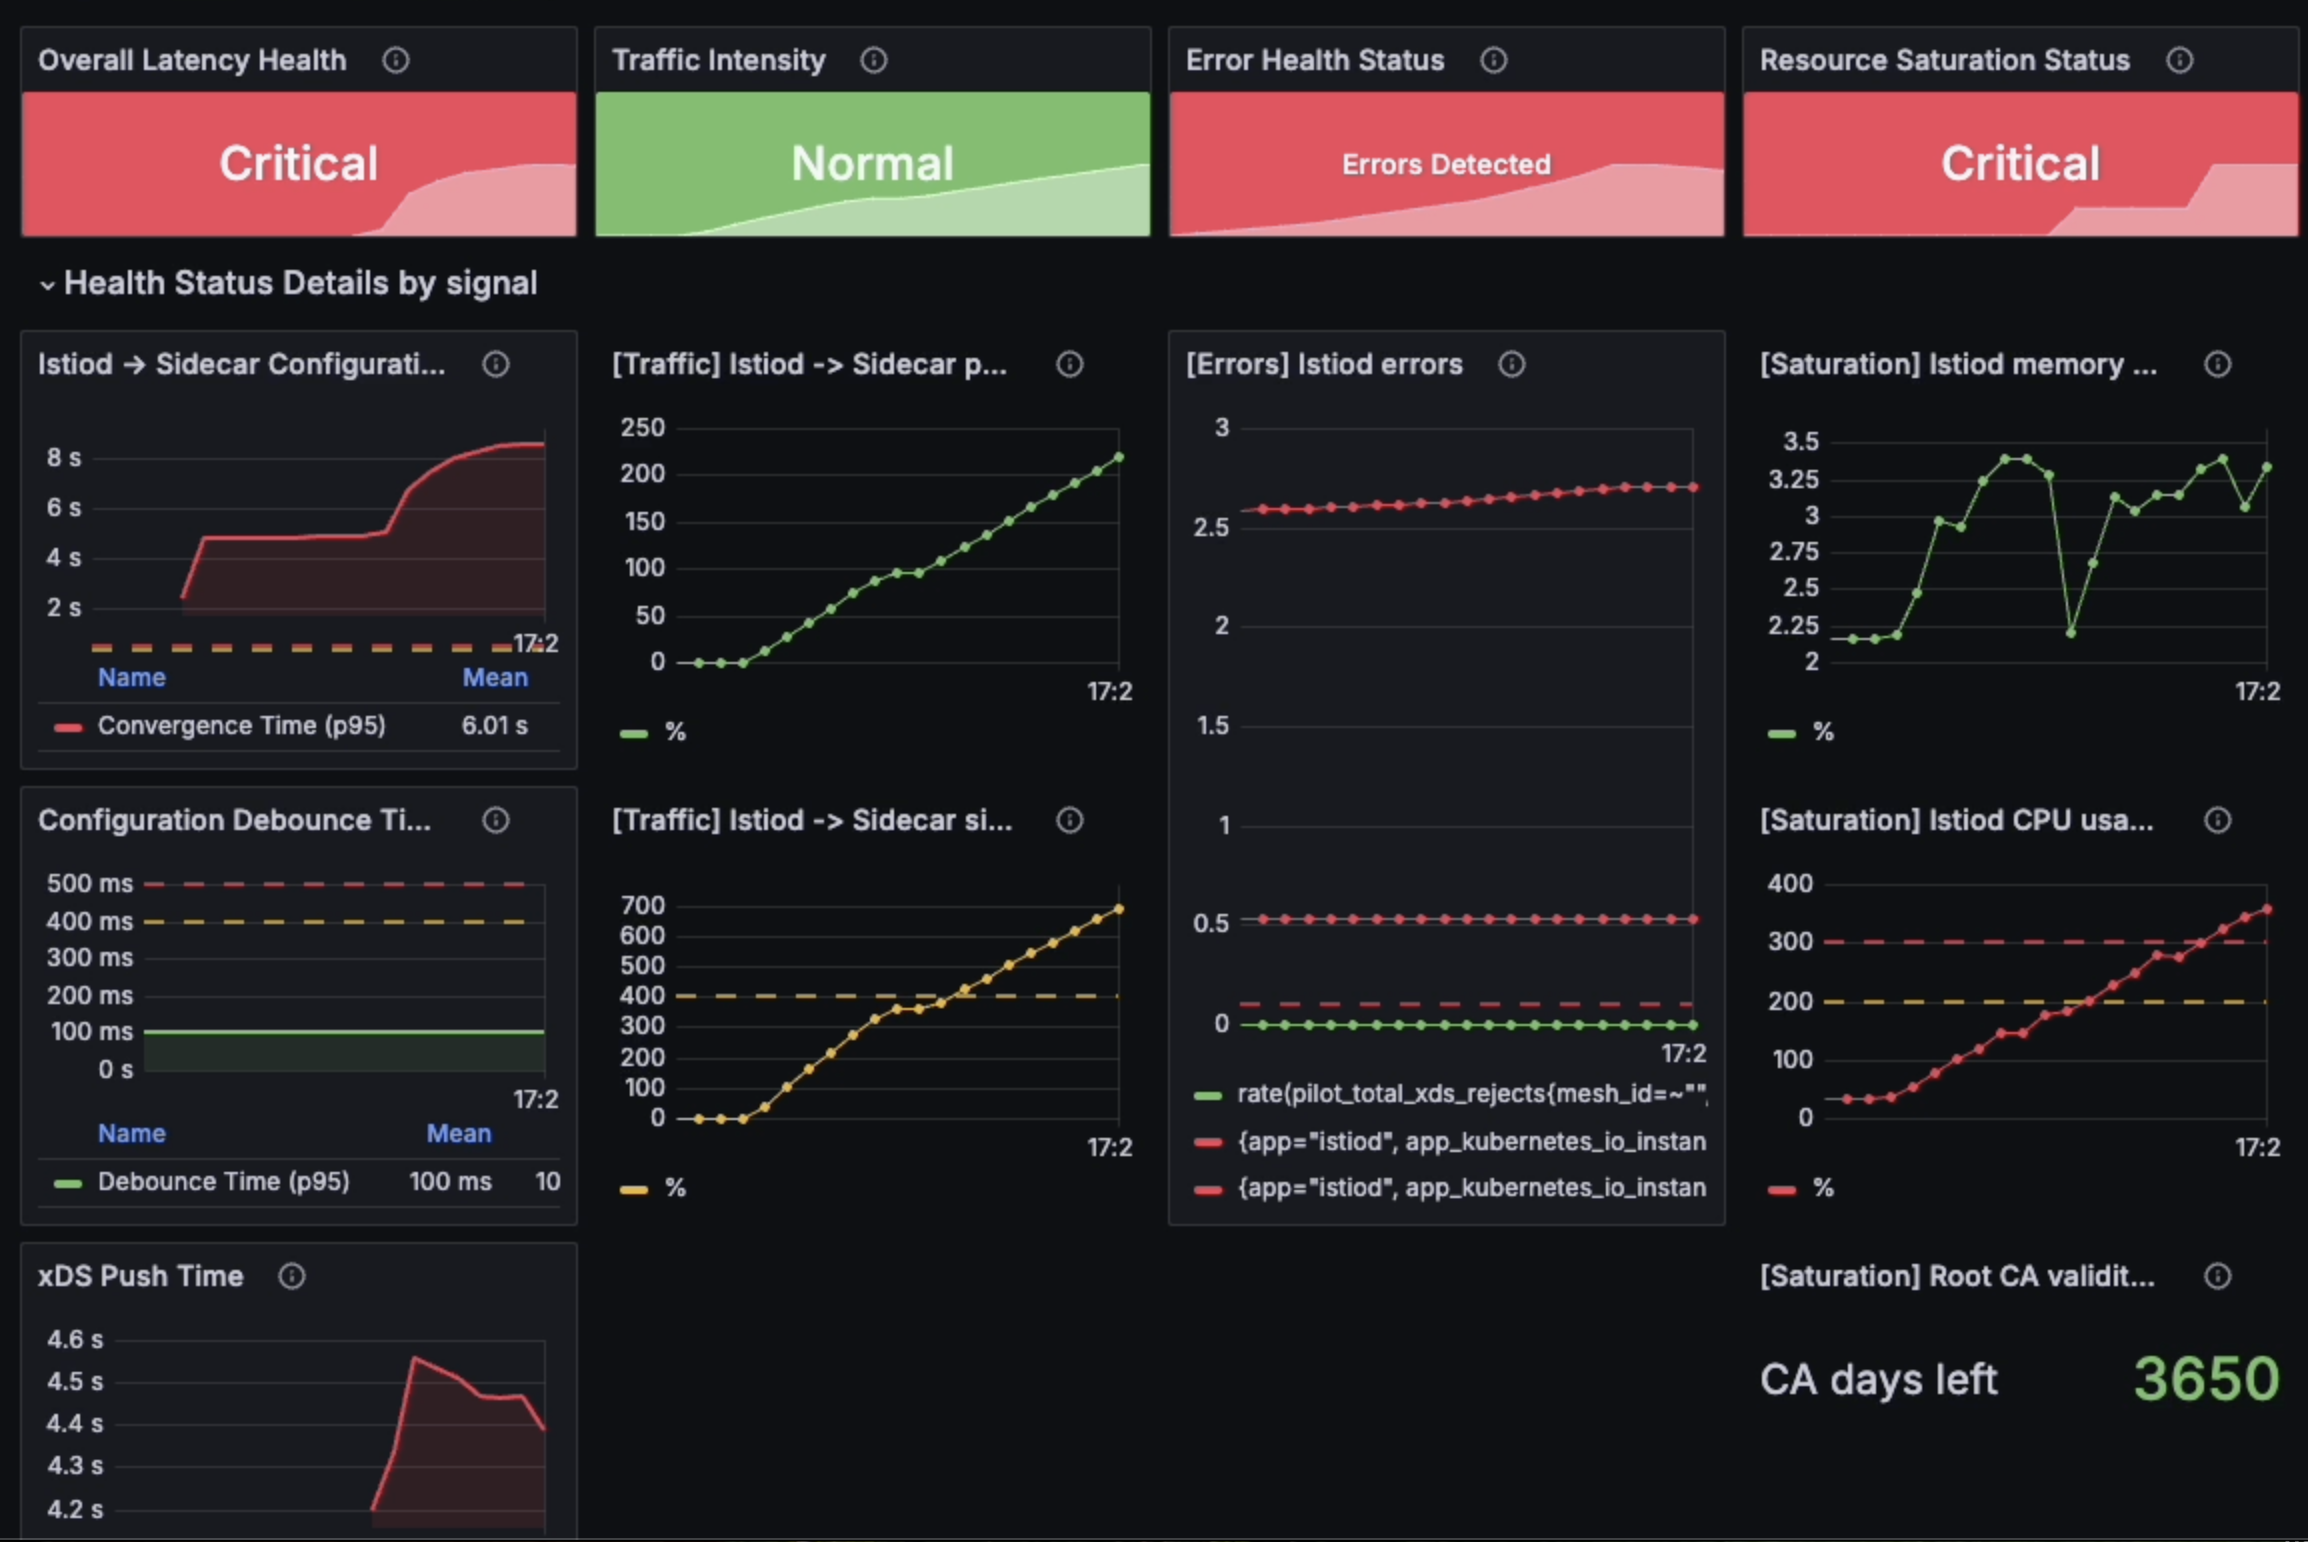
Istio Control Plane Health Dashboard
The Istio Control Plane Health Dashboard provides at-a-glance health status of the Istio control plane, with color-coded indicators for critical health signals.
Key Metrics:
- Latency: Tracks configuration convergence and distribution times
- Traffic: Monitors Sidecar configuration pushes and size
- Errors: Displays error rates for various control plane operations
- Saturation: Shows resource utilization and remaining capacity, including Root CA expiration
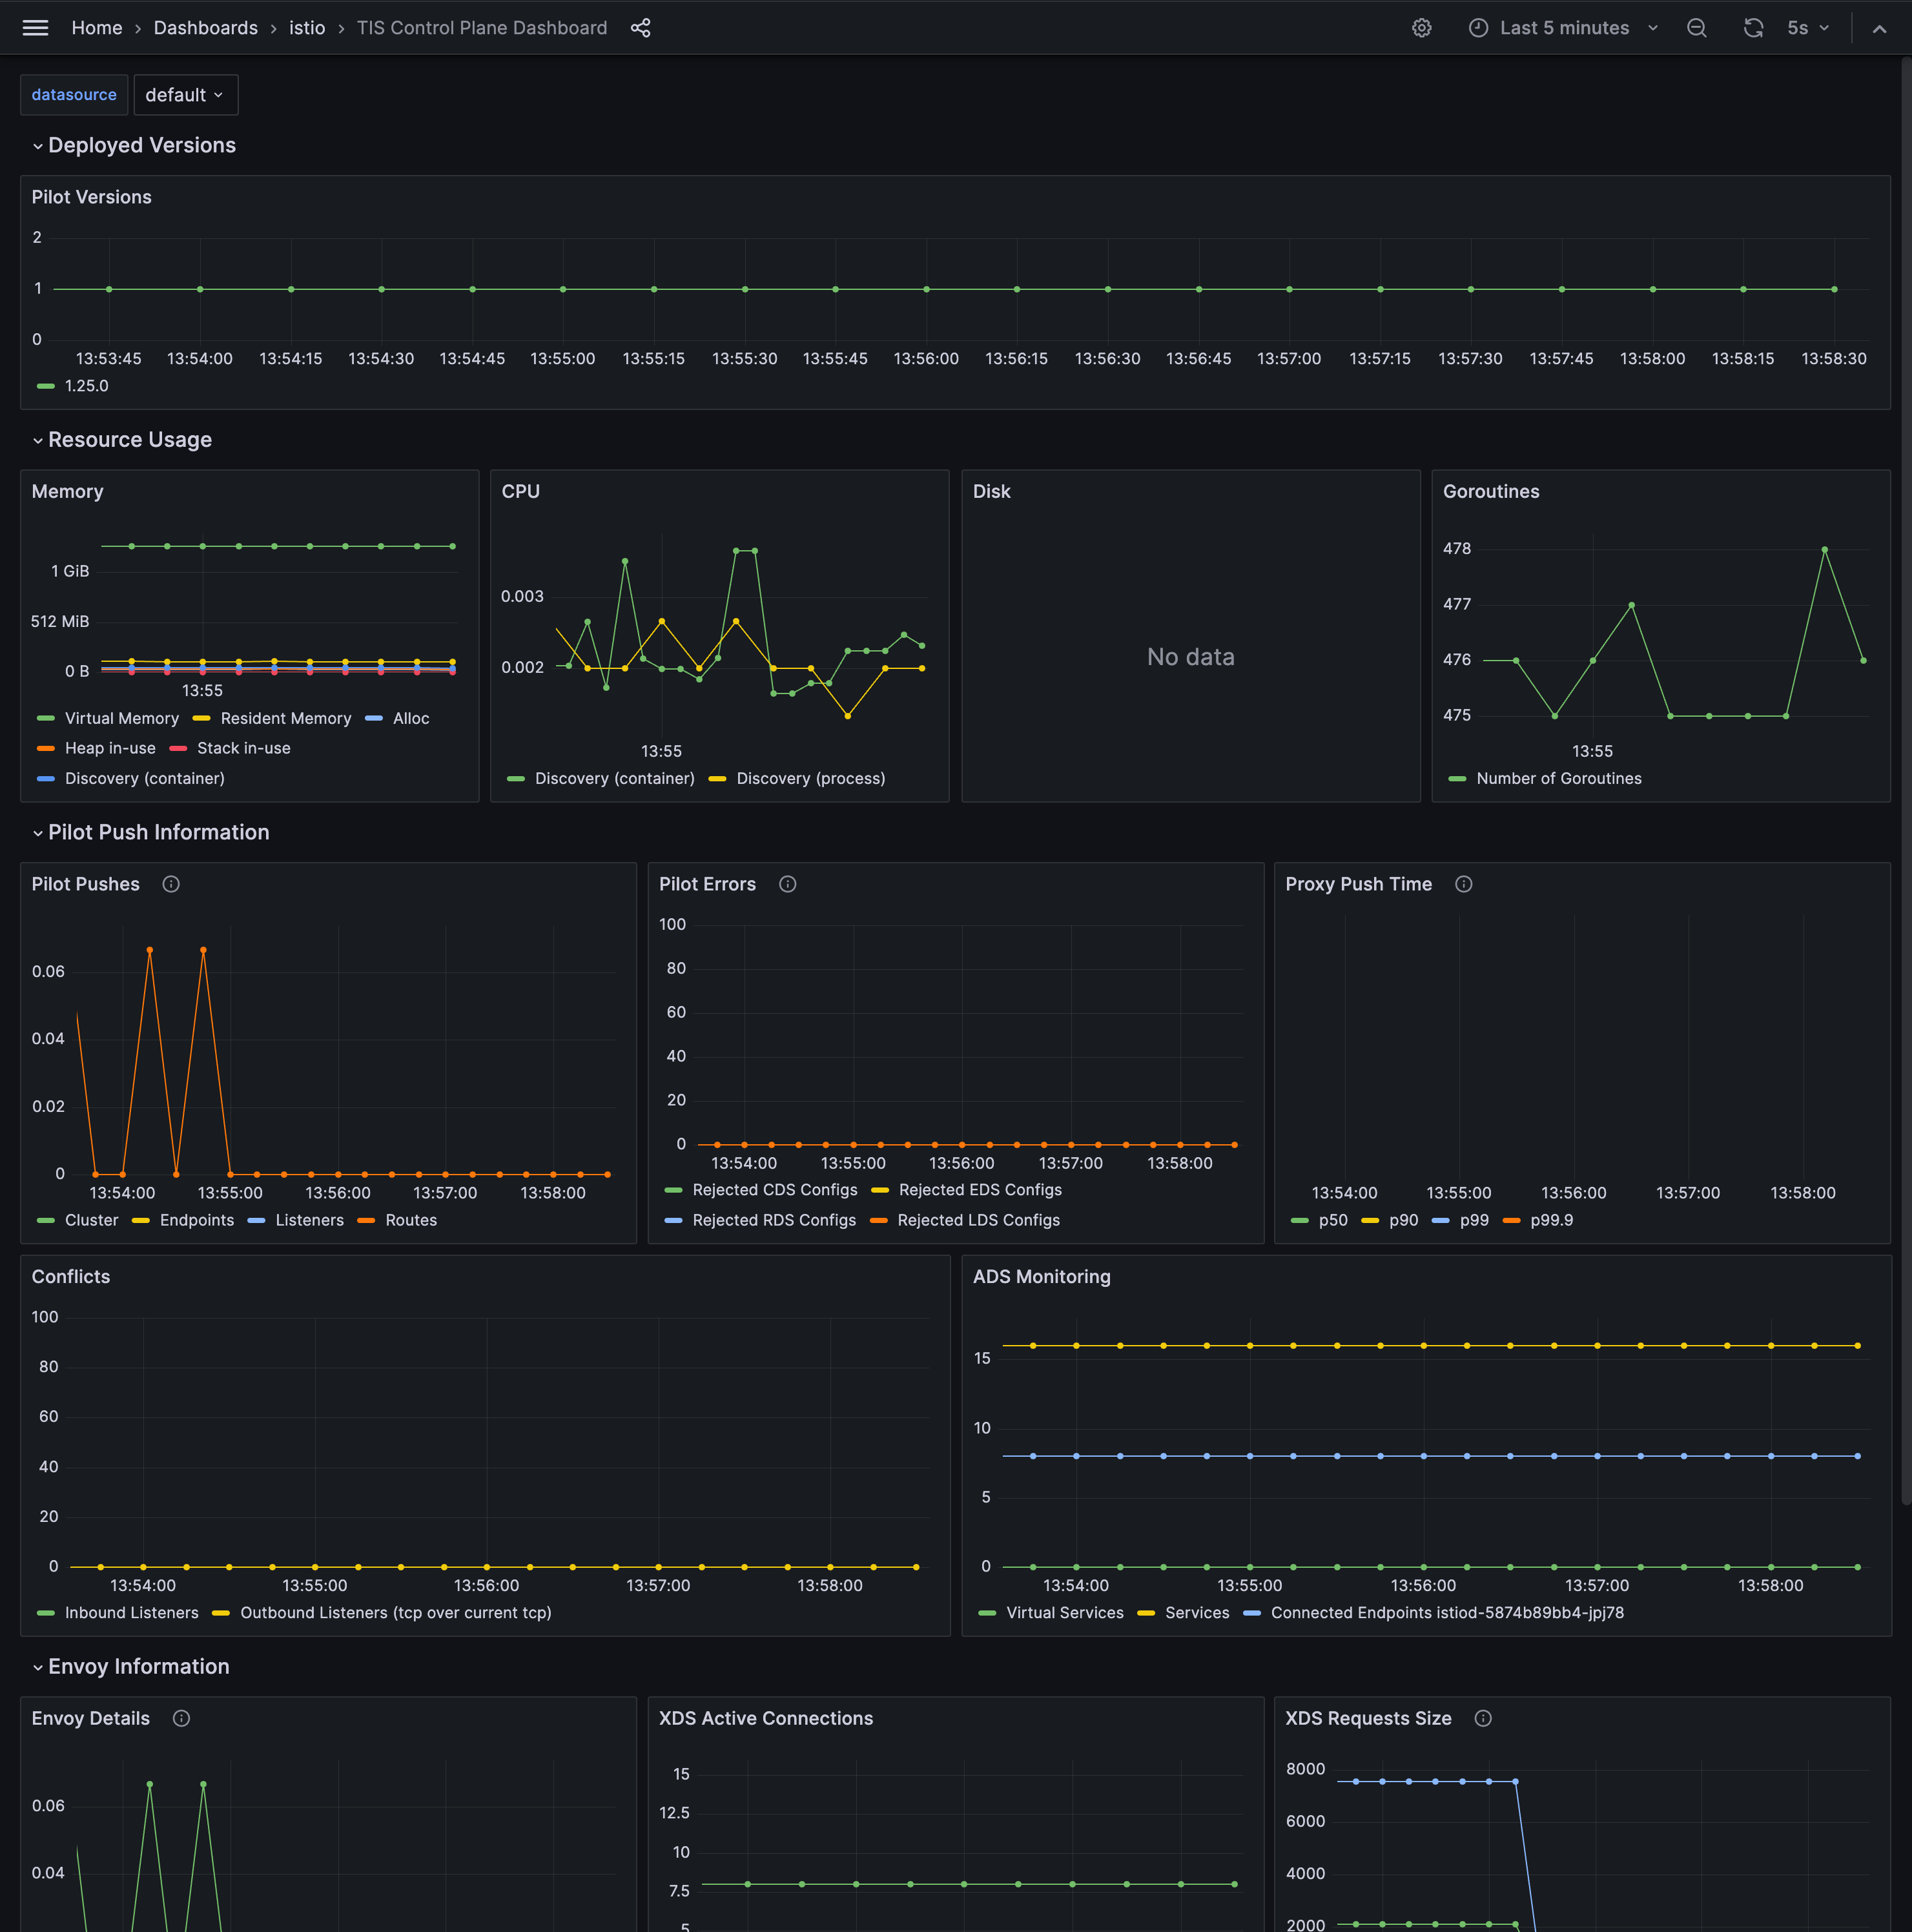
TIS Control Plane Dashboard
The TIS Control Plane Dashboard provides deep visibility into the Istio control plane (istiod) performance, resource usage, and configuration distribution.
Key Metrics:
- Deployed Versions: Tracks pilot versions deployed in the cluster
- Resource Usage: Monitors memory, CPU, disk, and goroutines consumption
- Pilot Push Information: Displays metrics on configuration pushes, errors, and push time
- Envoy Information: Provides details on XDS connections and request sizes
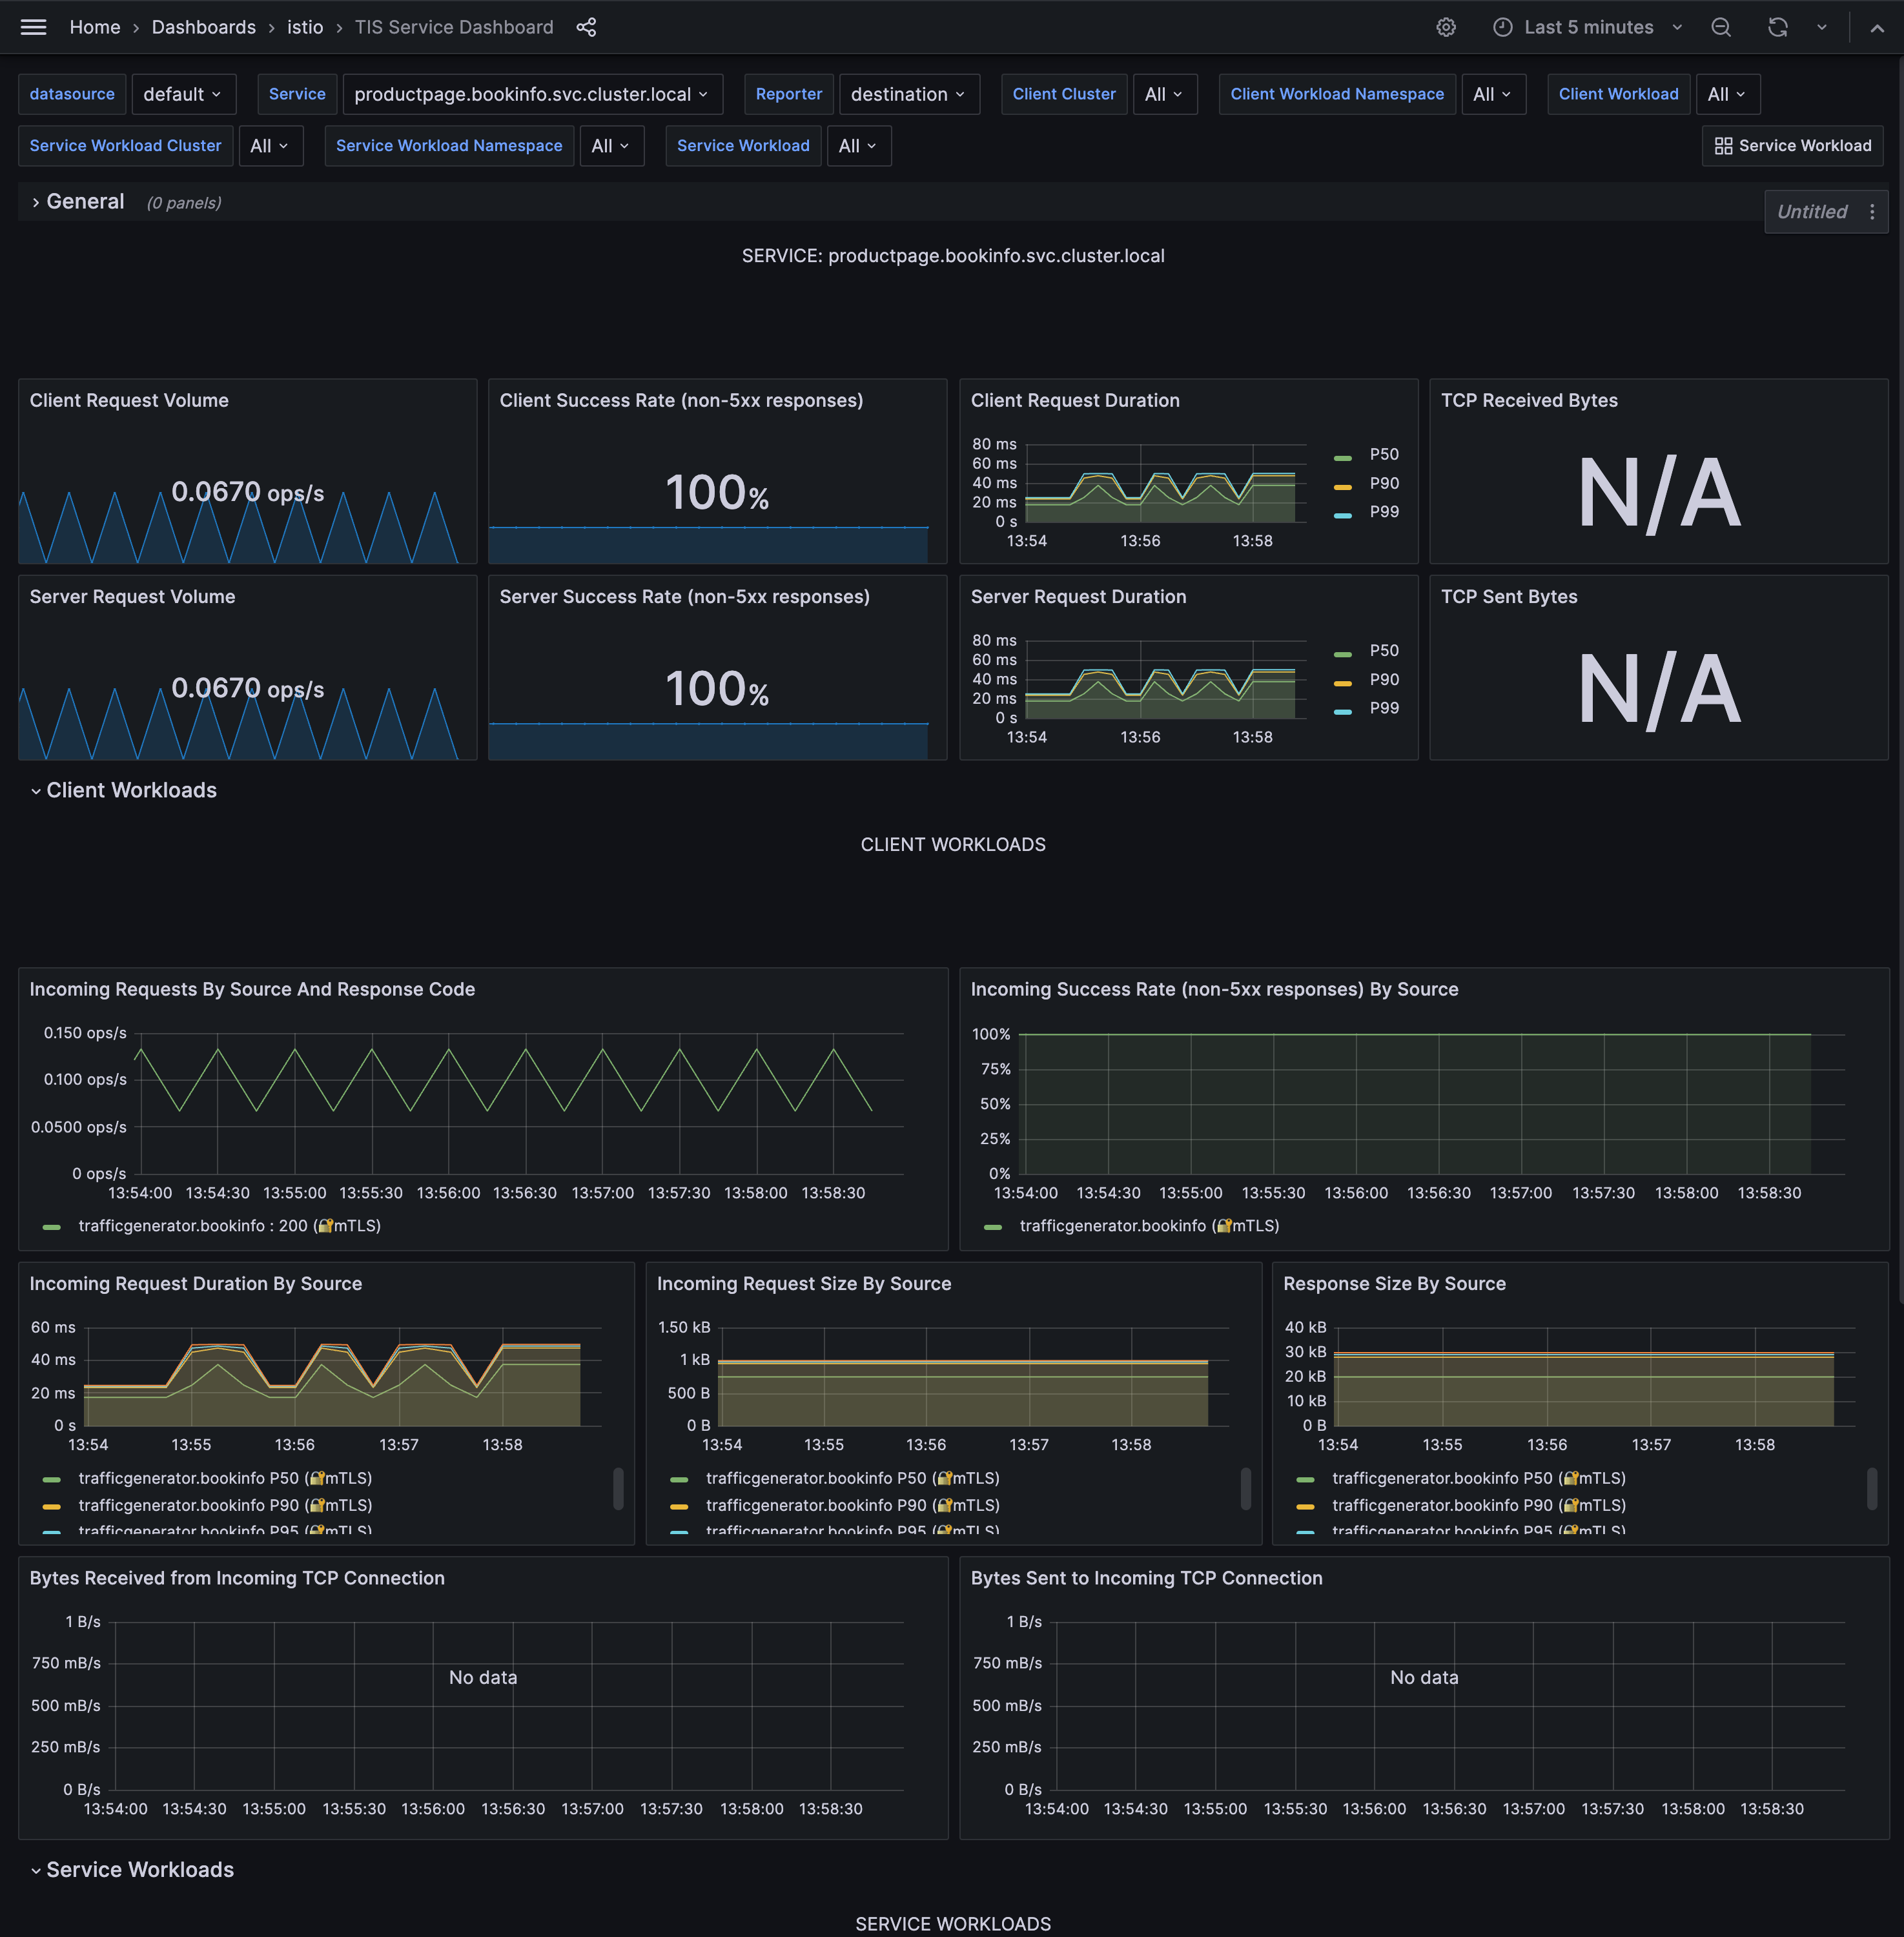
TIS Service Dashboard
The TIS Service Dashboard focuses on service-level metrics, providing insights into how services are performing within the mesh from a client and server perspective.
Key Metrics:
- Request Volume: Tracks operations per second
- Success Rate: Monitors non-5xx response success rates
- Request Duration: Shows P50, P90, and P99 latency percentiles
- Request and Response Size: Displays request and response sizes
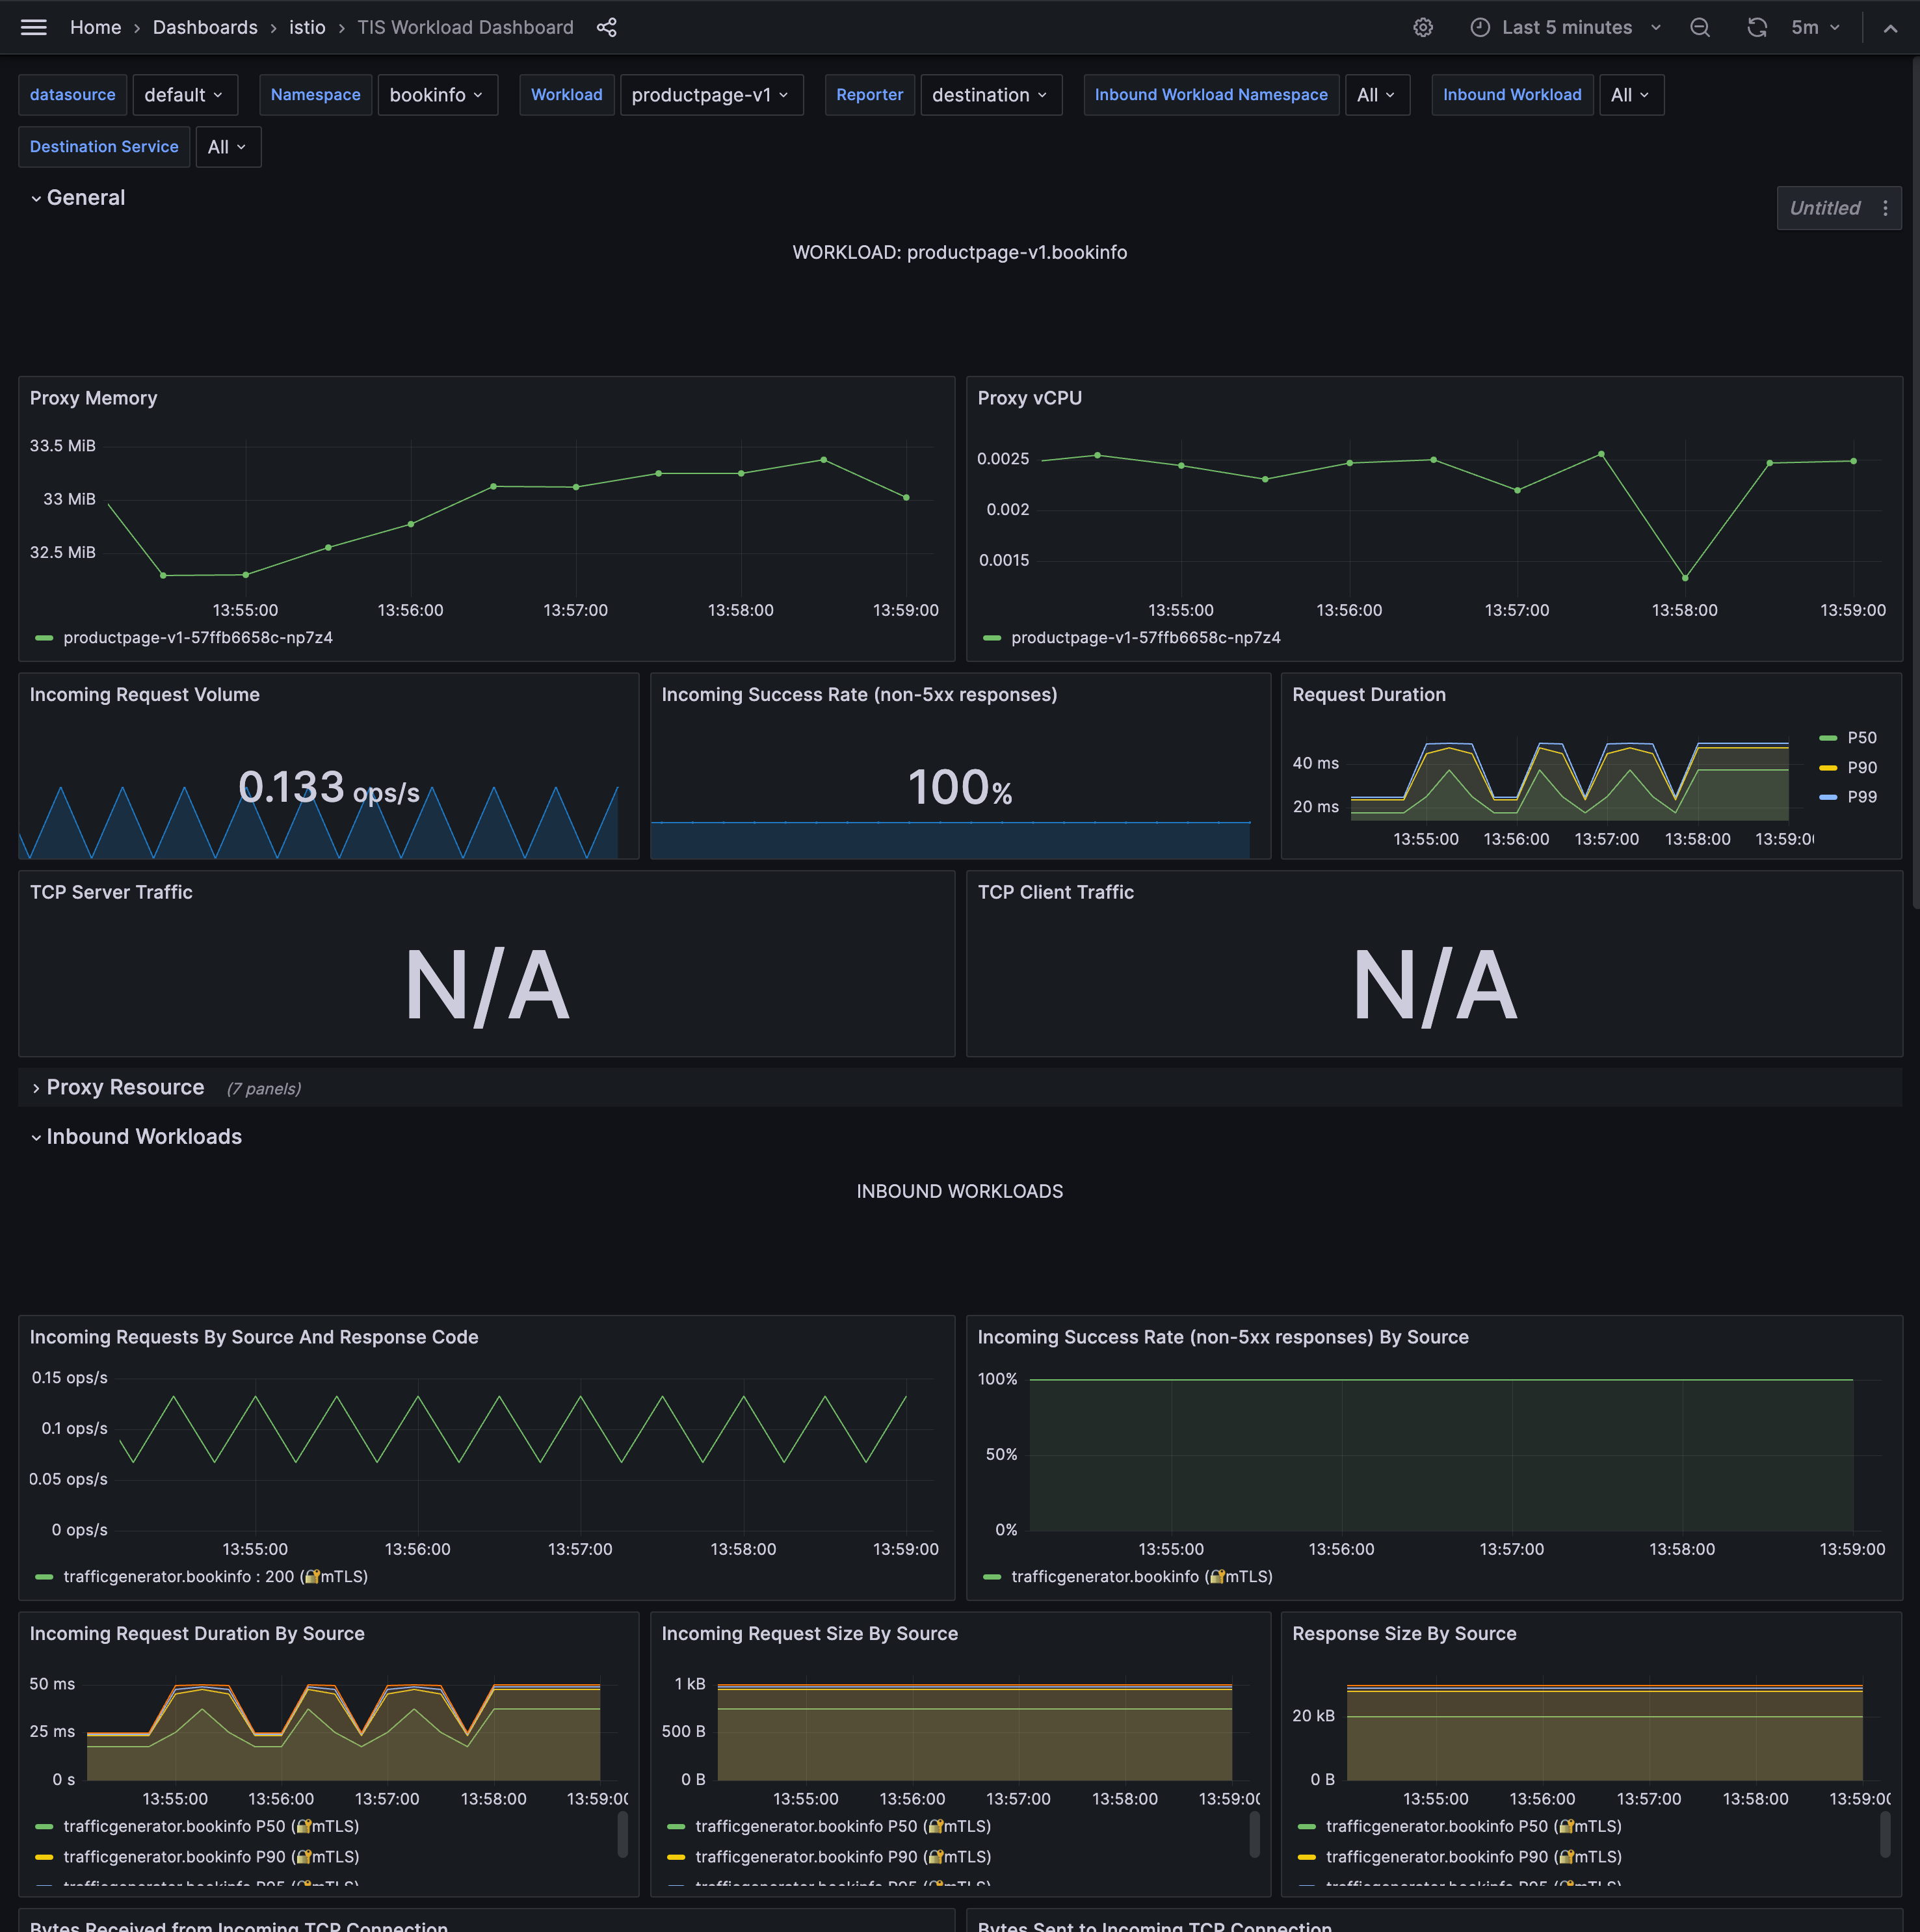
TIS Workload Dashboard
The TIS Workload Dashboard provides workload-specific metrics, focusing on the performance and behavior of individual deployments within the mesh including proxy resource and both inbound and outbound traffic.
Key Metrics:
- Proxy Resource Usage: Monitors memory and CPU consumption of proxies
- Proxy Resource Saturation: Monitors memory and CPU saturation
- Inbound and Outbound Traffic: Tracks request volume, success rate, and request size
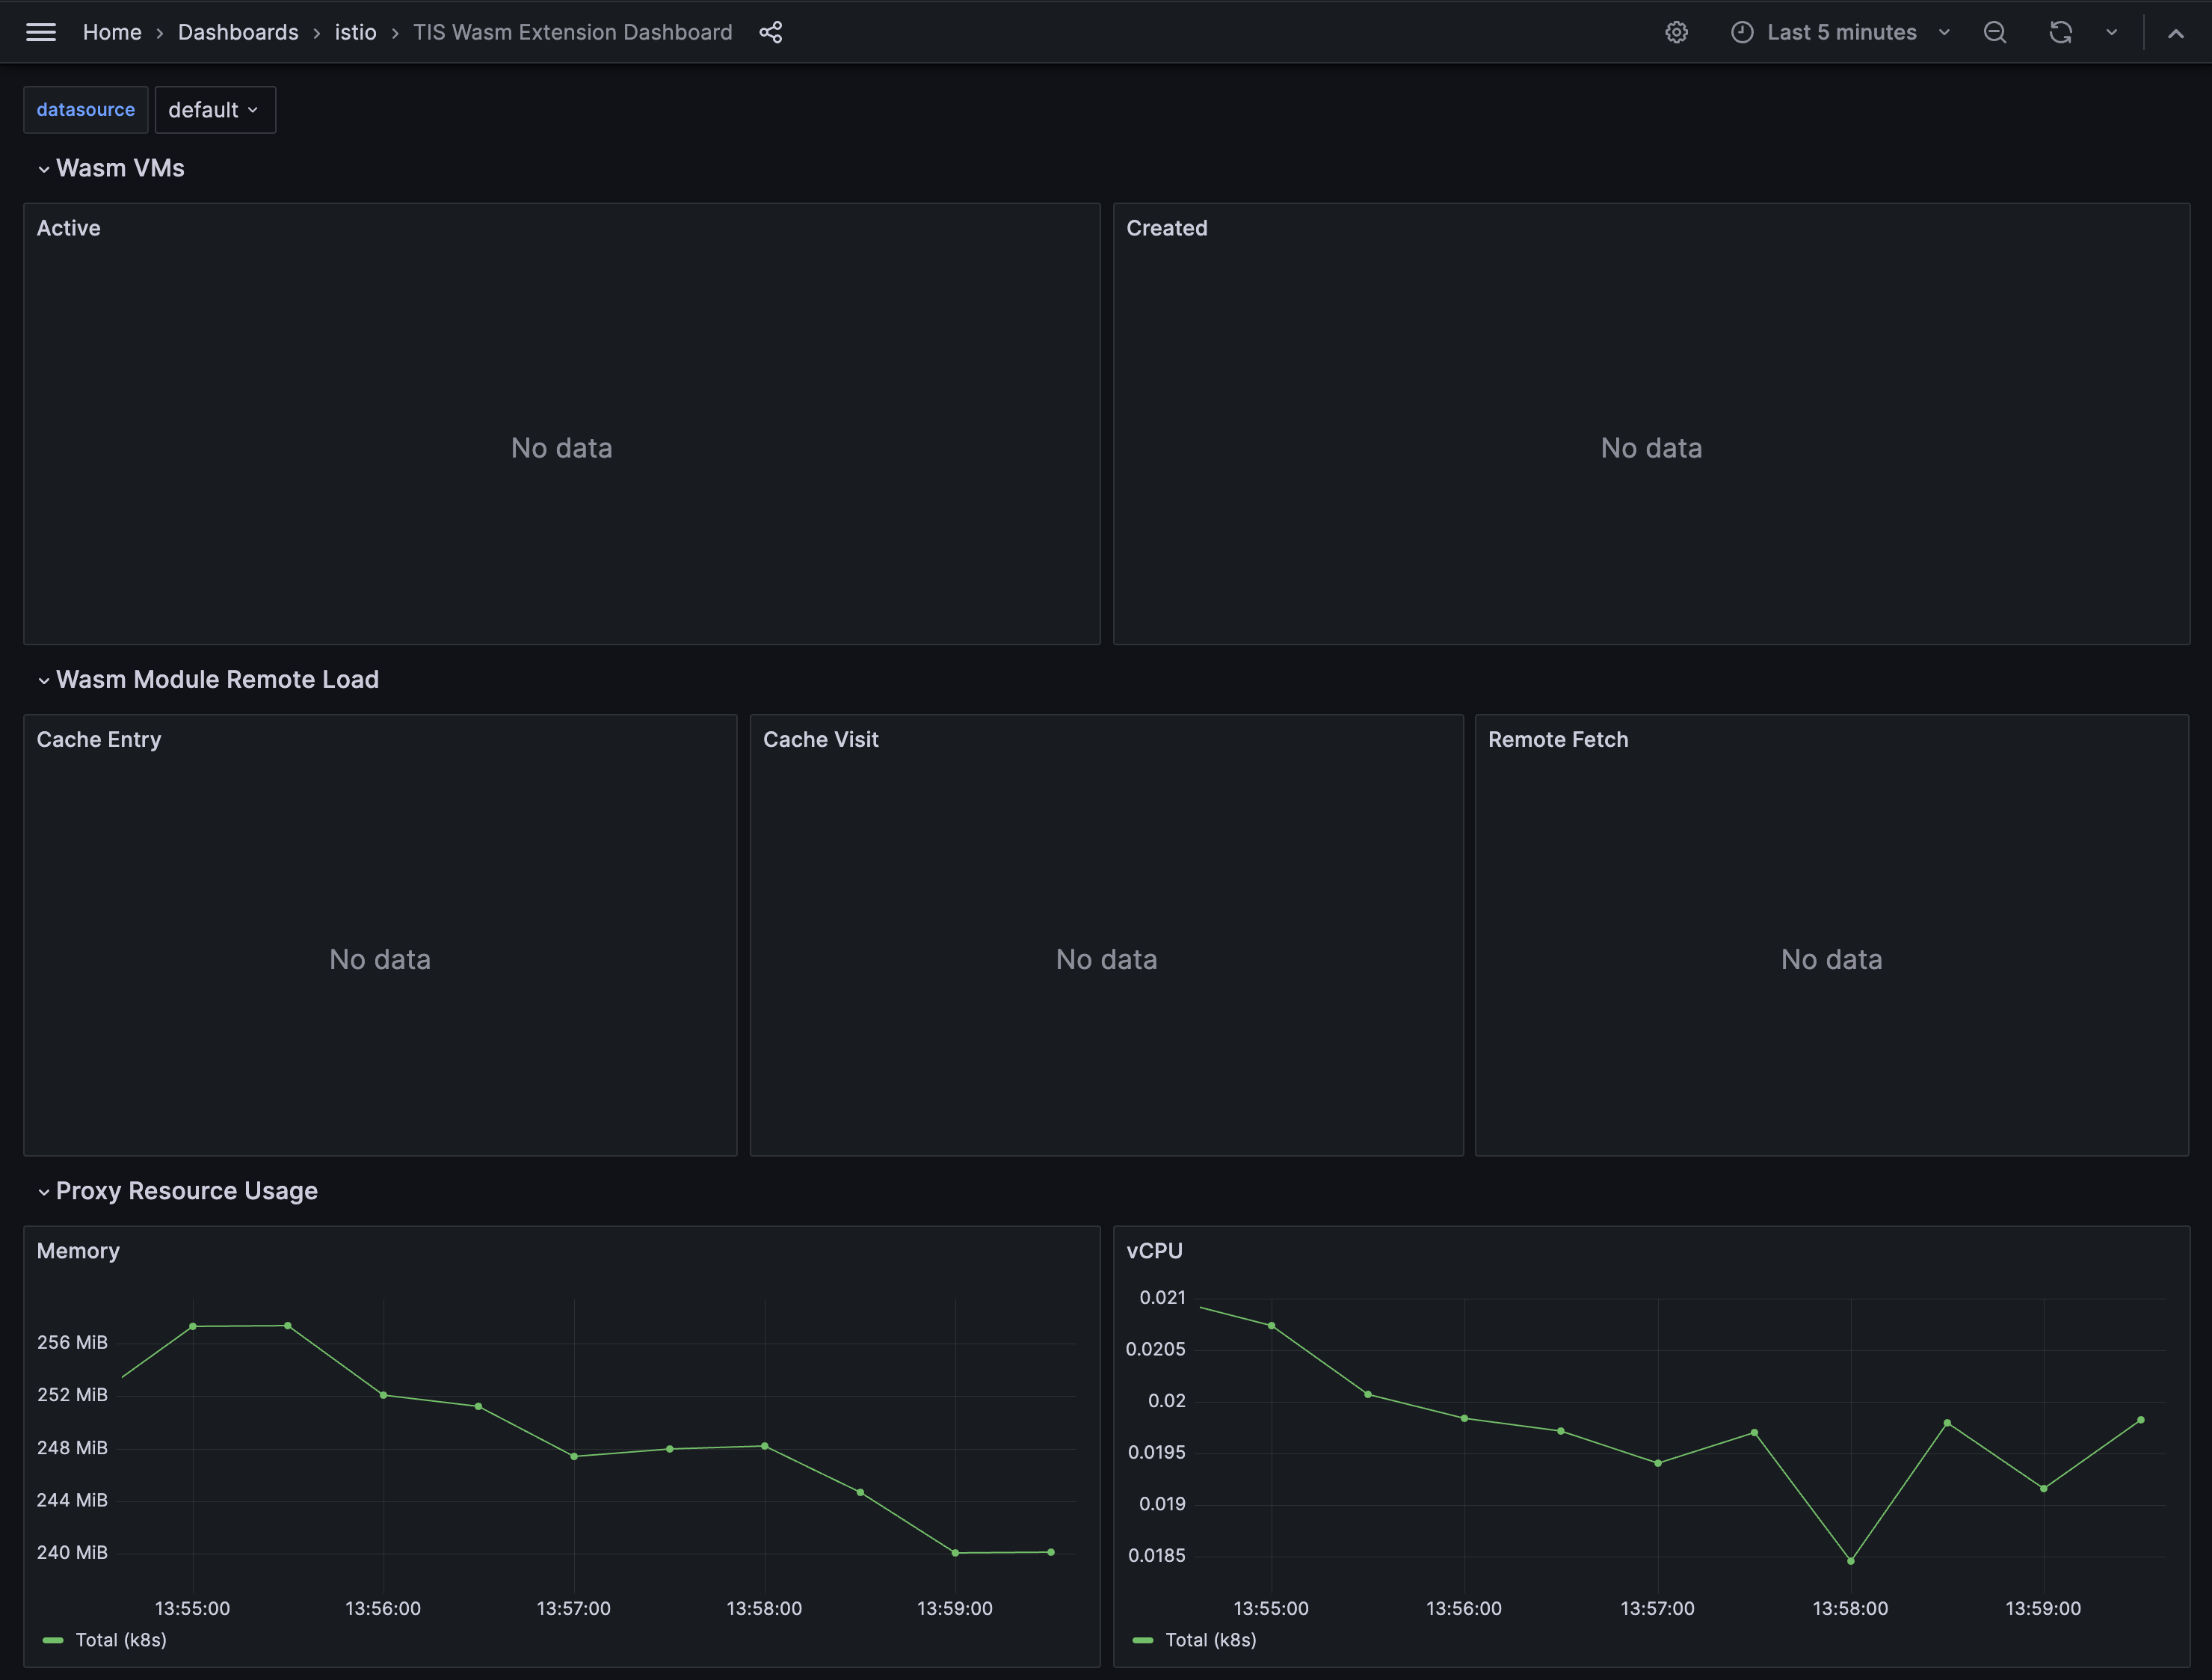
TIS WASM Extension Dashboard
The TIS Wasm Extension Dashboard provides visibility into WebAssembly (Wasm) modules running within your Istio service mesh. This dashboard helps you monitor Wasm performance metrics and resource usage.
Key Metrics
- Wasm VMs: Monitors active Wasm virtual machines and their creation
- Wasm Module Remote Load: Tracks cache entry, cache visit, and remote fetch operations for Wasm modules
- Proxy Resource Usage: Displays memory and vCPU consumption of proxies running Wasm modules
Available Istio Observability Playbook
The Istio Observability Playbook by Tetrate is a distilled of our collective knowledge on what and how to observe in an Istio Service Mesh beyond the business logic workloads. The careful selection of metrics and observability guidelines will streamline your knowledge of the fundamental signals of a mesh to unlock an operations scenario where agility, predictability, resiliency, and scalability are its core characteristics.
- Istio Observability Playbook by Tetrate
Available Istio Troubleshooting Runbooks
The following runbooks provide targeted guidance for diagnosing and resolving issues related to the health of your Istio control plane, directly referencing metrics within the Istio Control Plane Health dashboard.
- Convergence Time Runbook
- Root CA Validity Runbook
- Istiod CPU Saturation Runbook
- Istiod RAM Saturation Runbook
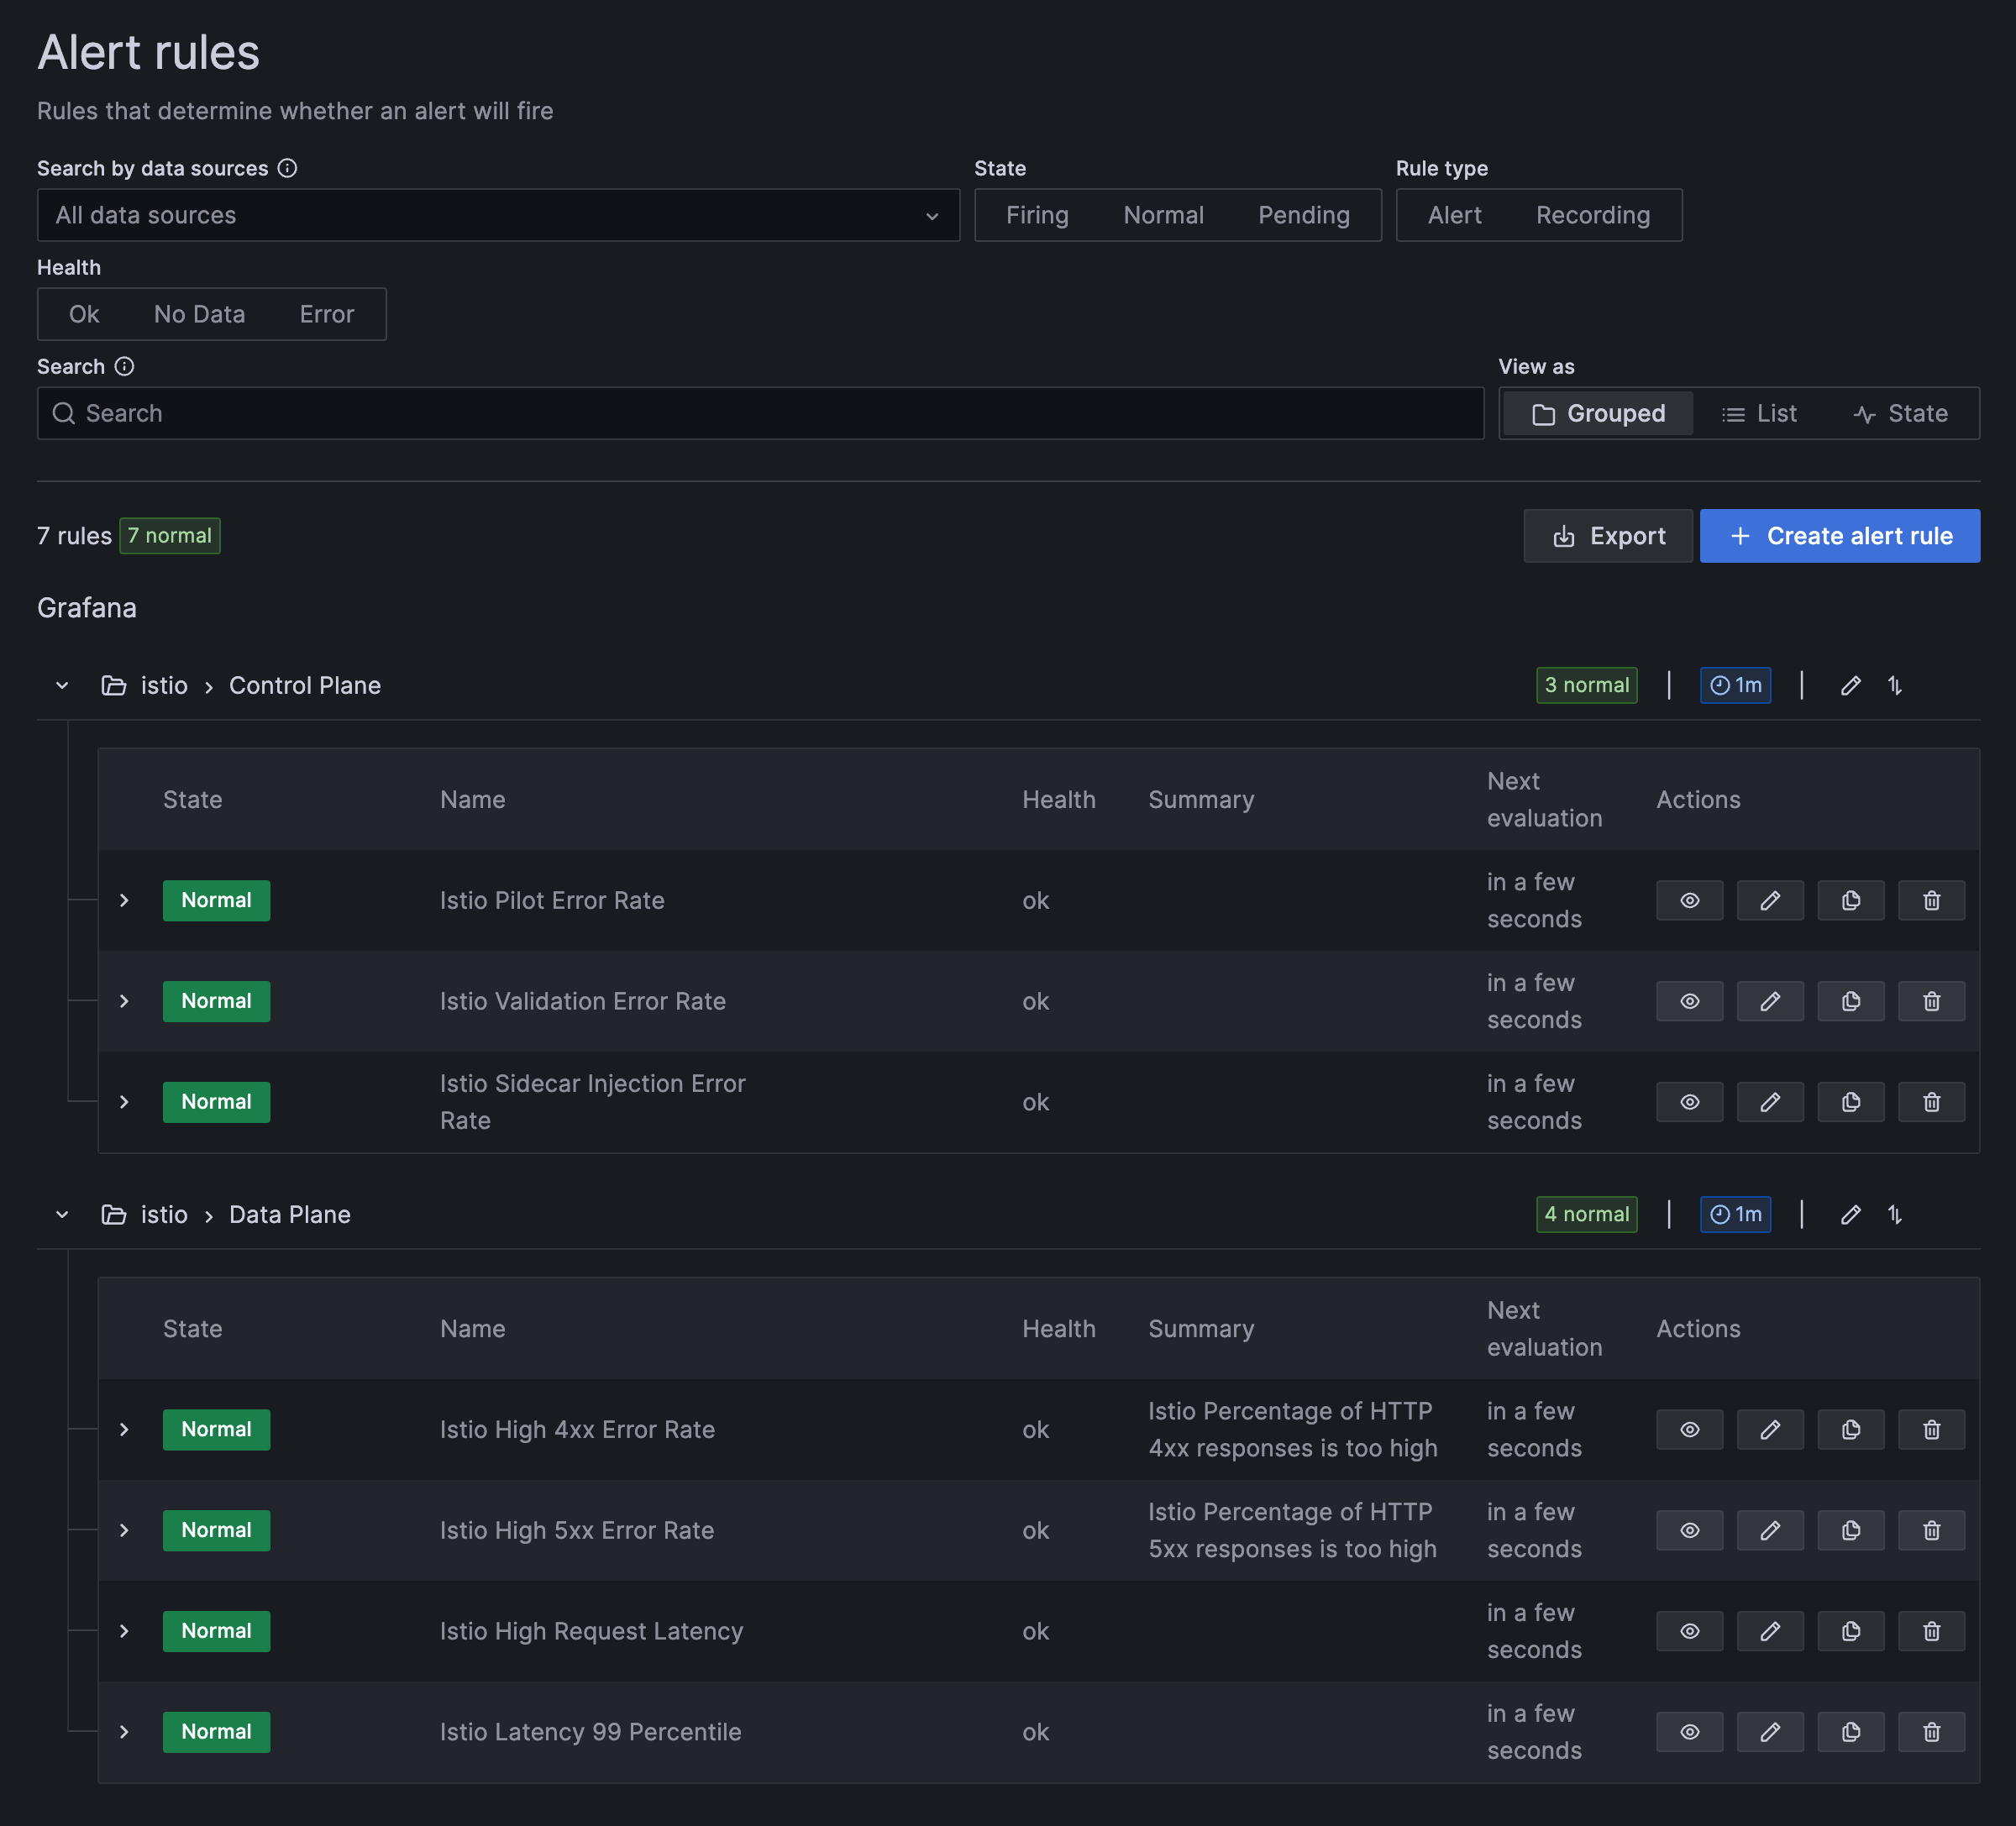
Available Istio Alerting Rules
The TIS Grafana Dashboard includes the following alerting rules:
- Istio Pilot Error Rate
- Istio Validation Error Rate
- Istio Sidecar Injection Error Rate
- Istio High 4xx Error Rate
- Istio High 5xx Error Rate
- Istio High Request Latency
- Istio Latency 99 Percentile