 Tetrate Patch ServiceVersion: alpha
Viewing Your Clusters
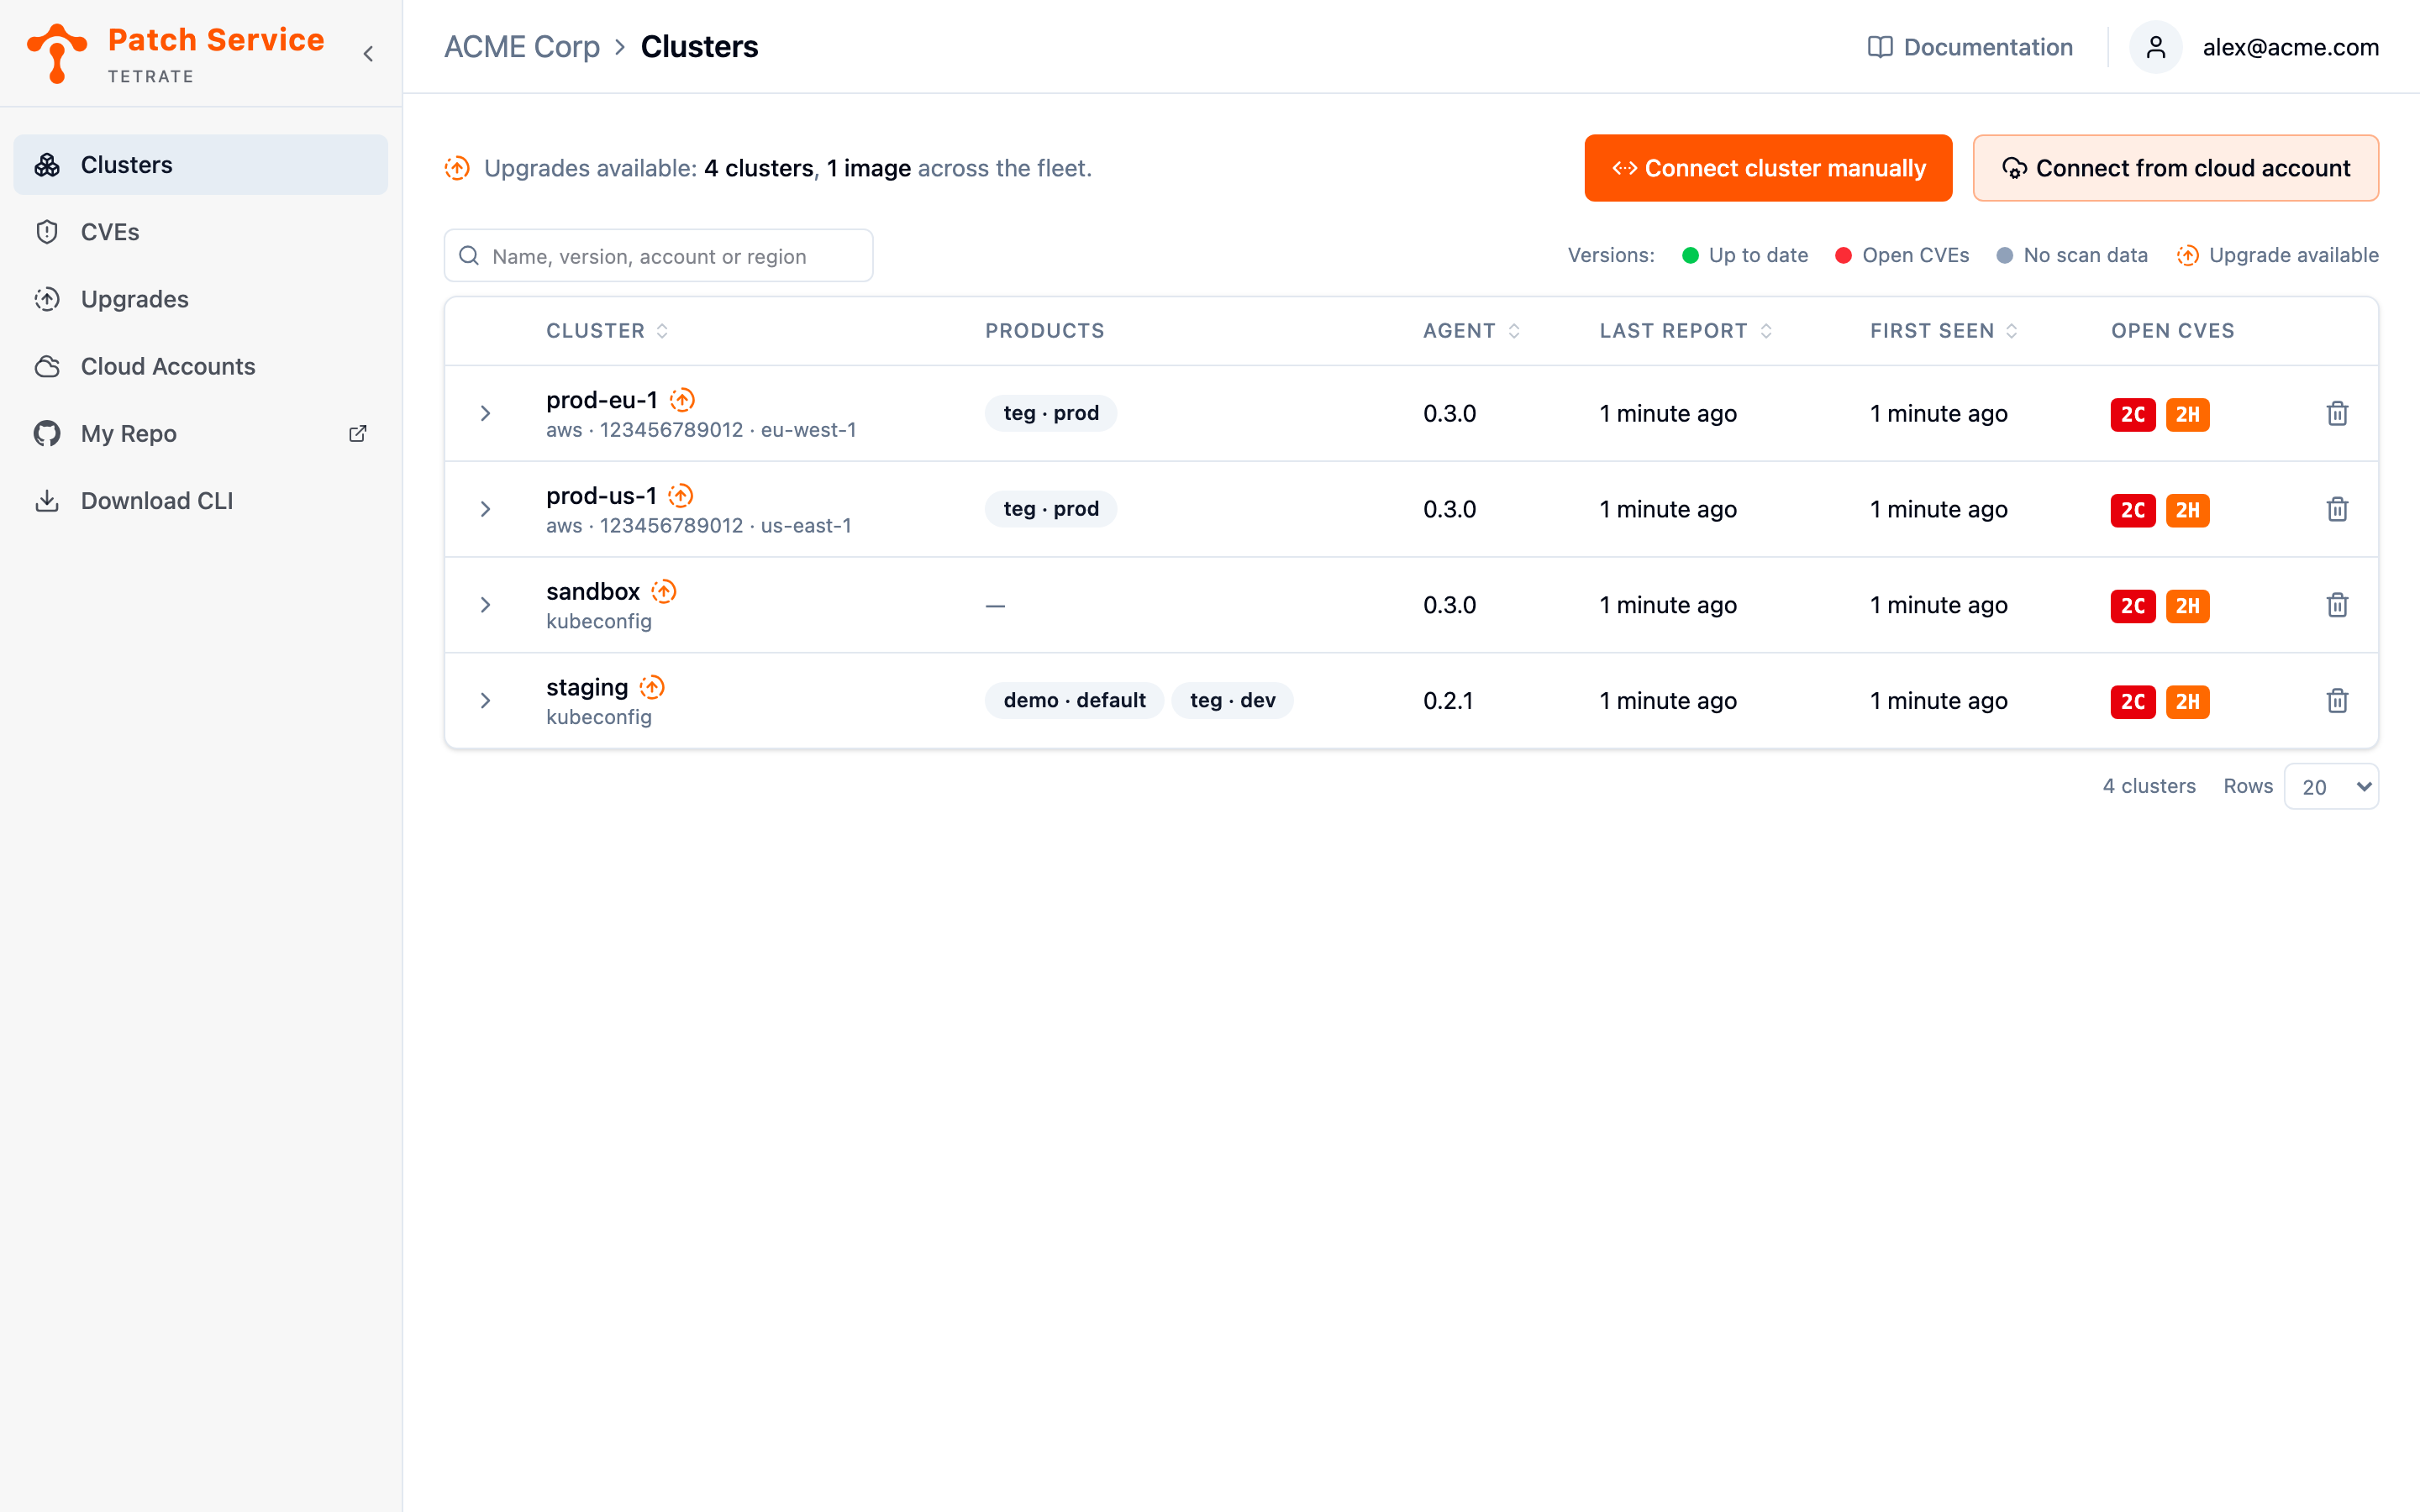
The Clusters view is the home page of Tetrate Patch Service: one row per cluster, with the evidence one click down. Each row rolls up what the agent in that cluster reports, including which managed products it found installed; expand it to see every observed container, its version, and what to do about it.
Understanding the Clusters View
Every cluster registered with the Patch Service has a row, whether or not it has reported yet. A cluster counts as connected only once its agent reports, so a registered cluster whose install never finished stays in the list, visibly never reported, rather than hidden.
| Column | What it tells you |
|---|---|
| Cluster | The name the cluster registered under, with its source in small gray text beneath. An orange arrow beside the name means at least one image running in the cluster has an upgrade available in the release catalog. |
| Products | The managed products the agent found installed in the cluster, one chip per product and environment. A dash means the cluster runs the agent alone. |
| Agent | The version of the agent reporting from the cluster. |
| Last report | When the agent last sent a snapshot. |
| First seen | When the cluster was first registered. Registration happens at the start of onboarding, so a cluster appears here before its install finishes. |
| Open CVEs | Critical and High counts rolled up from every image the cluster runs, shown as chips: 2C 5H means 2 Critical and 5 High open findings. |
Above the list, Connect cluster manually opens the Connect Cluster page for one cluster at a time, and Connect from cloud account discovers and installs across the clusters of a cloud account you connect. Both paths are covered in Connecting Clusters.
Beside those buttons, one line reports how far behind the fleet is: Upgrades available: 4 clusters, 1 image across the fleet, or Every reported image is on its latest release when nothing has fallen behind. The count covers every cluster you have, which is why it is worth stating: a table you page through can never add up to it.
The search box above the table narrows the list to clusters whose name, agent version, cloud account, or region contains what you type. Searching for eu-west finds every cluster in that region, and 0.2 finds every cluster still on an older agent. Matching ignores case and applies to the whole fleet, not to the page on screen, so a match on the third page still surfaces. Clear the box to bring the full list back.
Telling Clusters Apart by Source
Under each cluster's name is a small gray line naming where the cluster was reached from:
| Source line | What it means |
|---|---|
kubeconfig | The cluster was connected with the tetrate CLI or by applying the manual steps, using your own credentials. |
aws · 123456789012 · eu-west-1 | The cluster was found in a connected cloud account, and the line names the provider, the account, and the region. |
The line earns its place because names are derived rather than chosen: two clusters can suggest the same name, and the second is registered under a name derived from it, so a fleet can hold a prod and a prod-a3f1c2 that are different clusters entirely. The source is what says which is which. See How Cluster Names Are Settled.
A source corrects itself: a cluster you connected from a laptop shows kubeconfig until its cloud account is connected, then reports where it actually lives.
Seeing Which Products a Cluster Runs
The Products column answers one question at a glance: is anything managed running here? Each chip names a product and the environment it was installed as, such as teg · prod, and a cluster running two of them carries two chips.
The chips come from the agent's own report, not from a record of what was installed. That distinction matters when the two disagree: a product whose install failed, or one that has since been removed, is simply not in the report and so not on the row. A dash is a complete answer too, and the ordinary one for a cluster running the agent alone.
Chips appear only for organizations on the managed data plane. If yours is not, every row shows a dash, and that is correct rather than missing data.
What is waiting on those products, the upgrade pull requests open against each one, lives in the Upgrades view instead, where each product is shown with the clusters it reaches.
Inspecting a Cluster's Containers
The counts in a row are claims; the containers table behind it is the evidence.
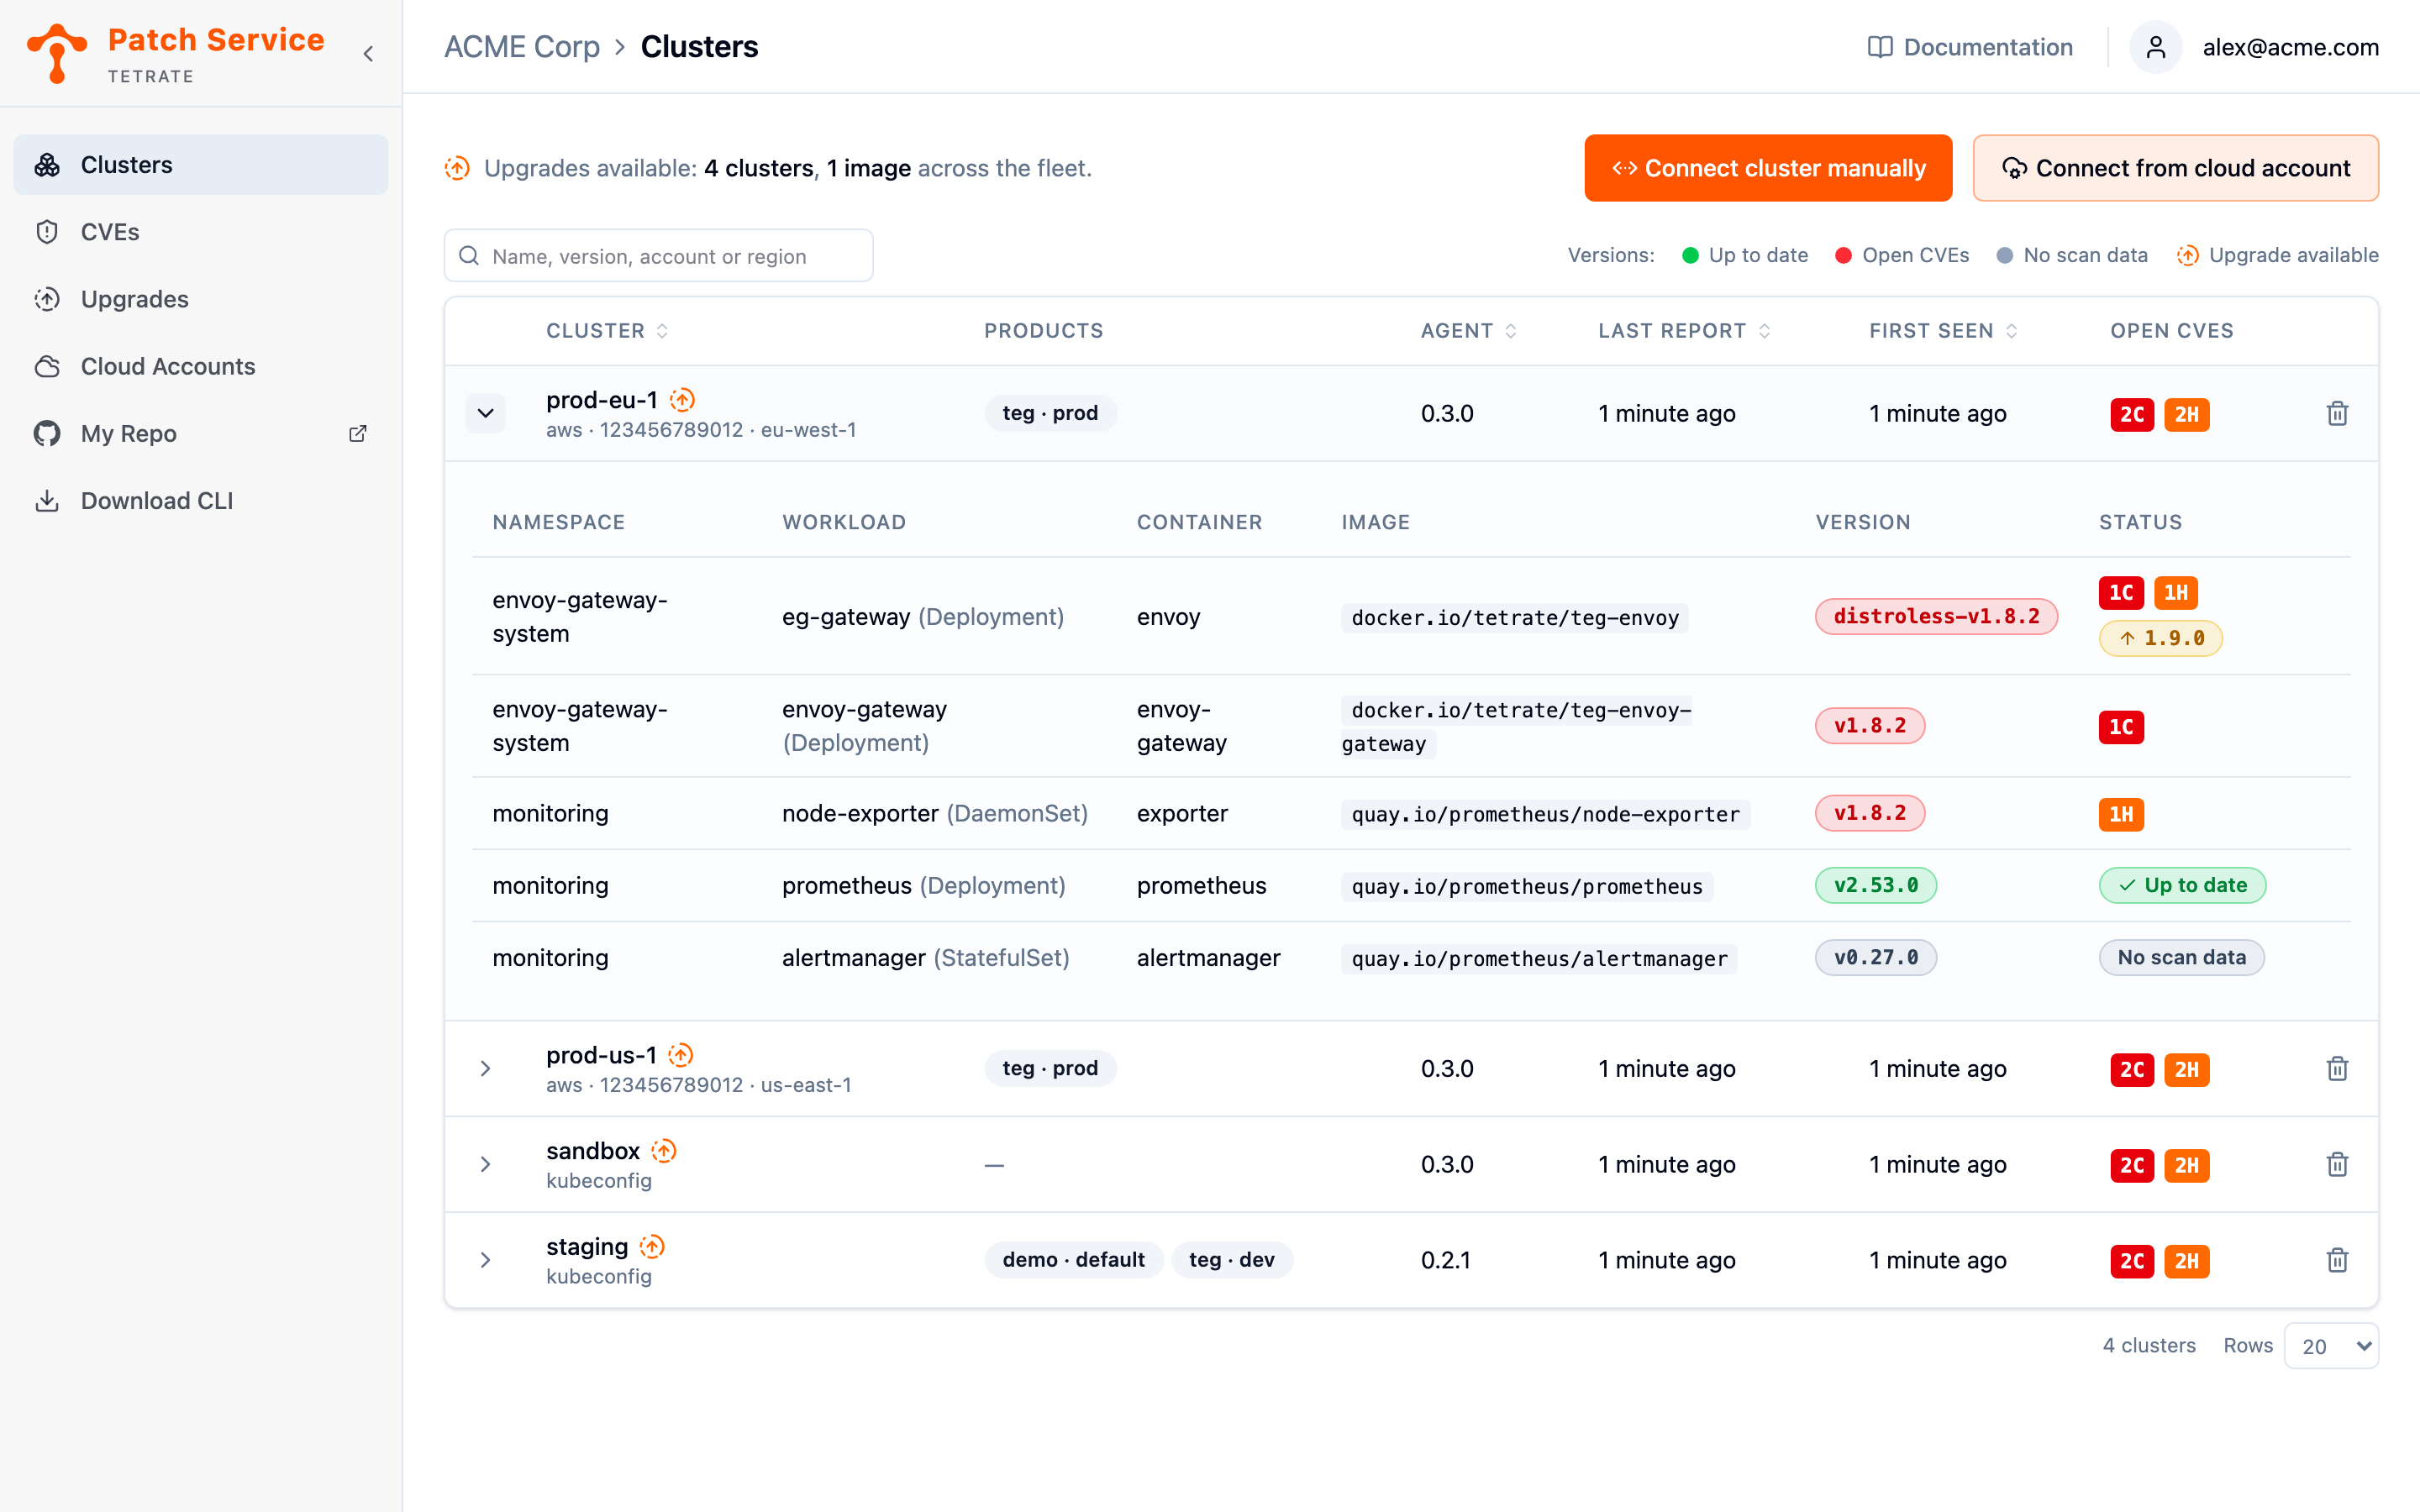
- Click the expander at the start of a cluster's row. The containers table opens beneath it, one row per container the agent observed; a cluster that has never reported shows a note instead.
- Locate the container by Namespace, Workload (the Deployment or DaemonSet that runs it, with its kind), and Container name. Image shows the repository, Version shows the image tag colored by its scan status, and Status shows what to do about it.
A snapshot replaces the previous one, so the table shows what runs in the cluster now, not a history: a container removed from the cluster disappears from the table at the next report.
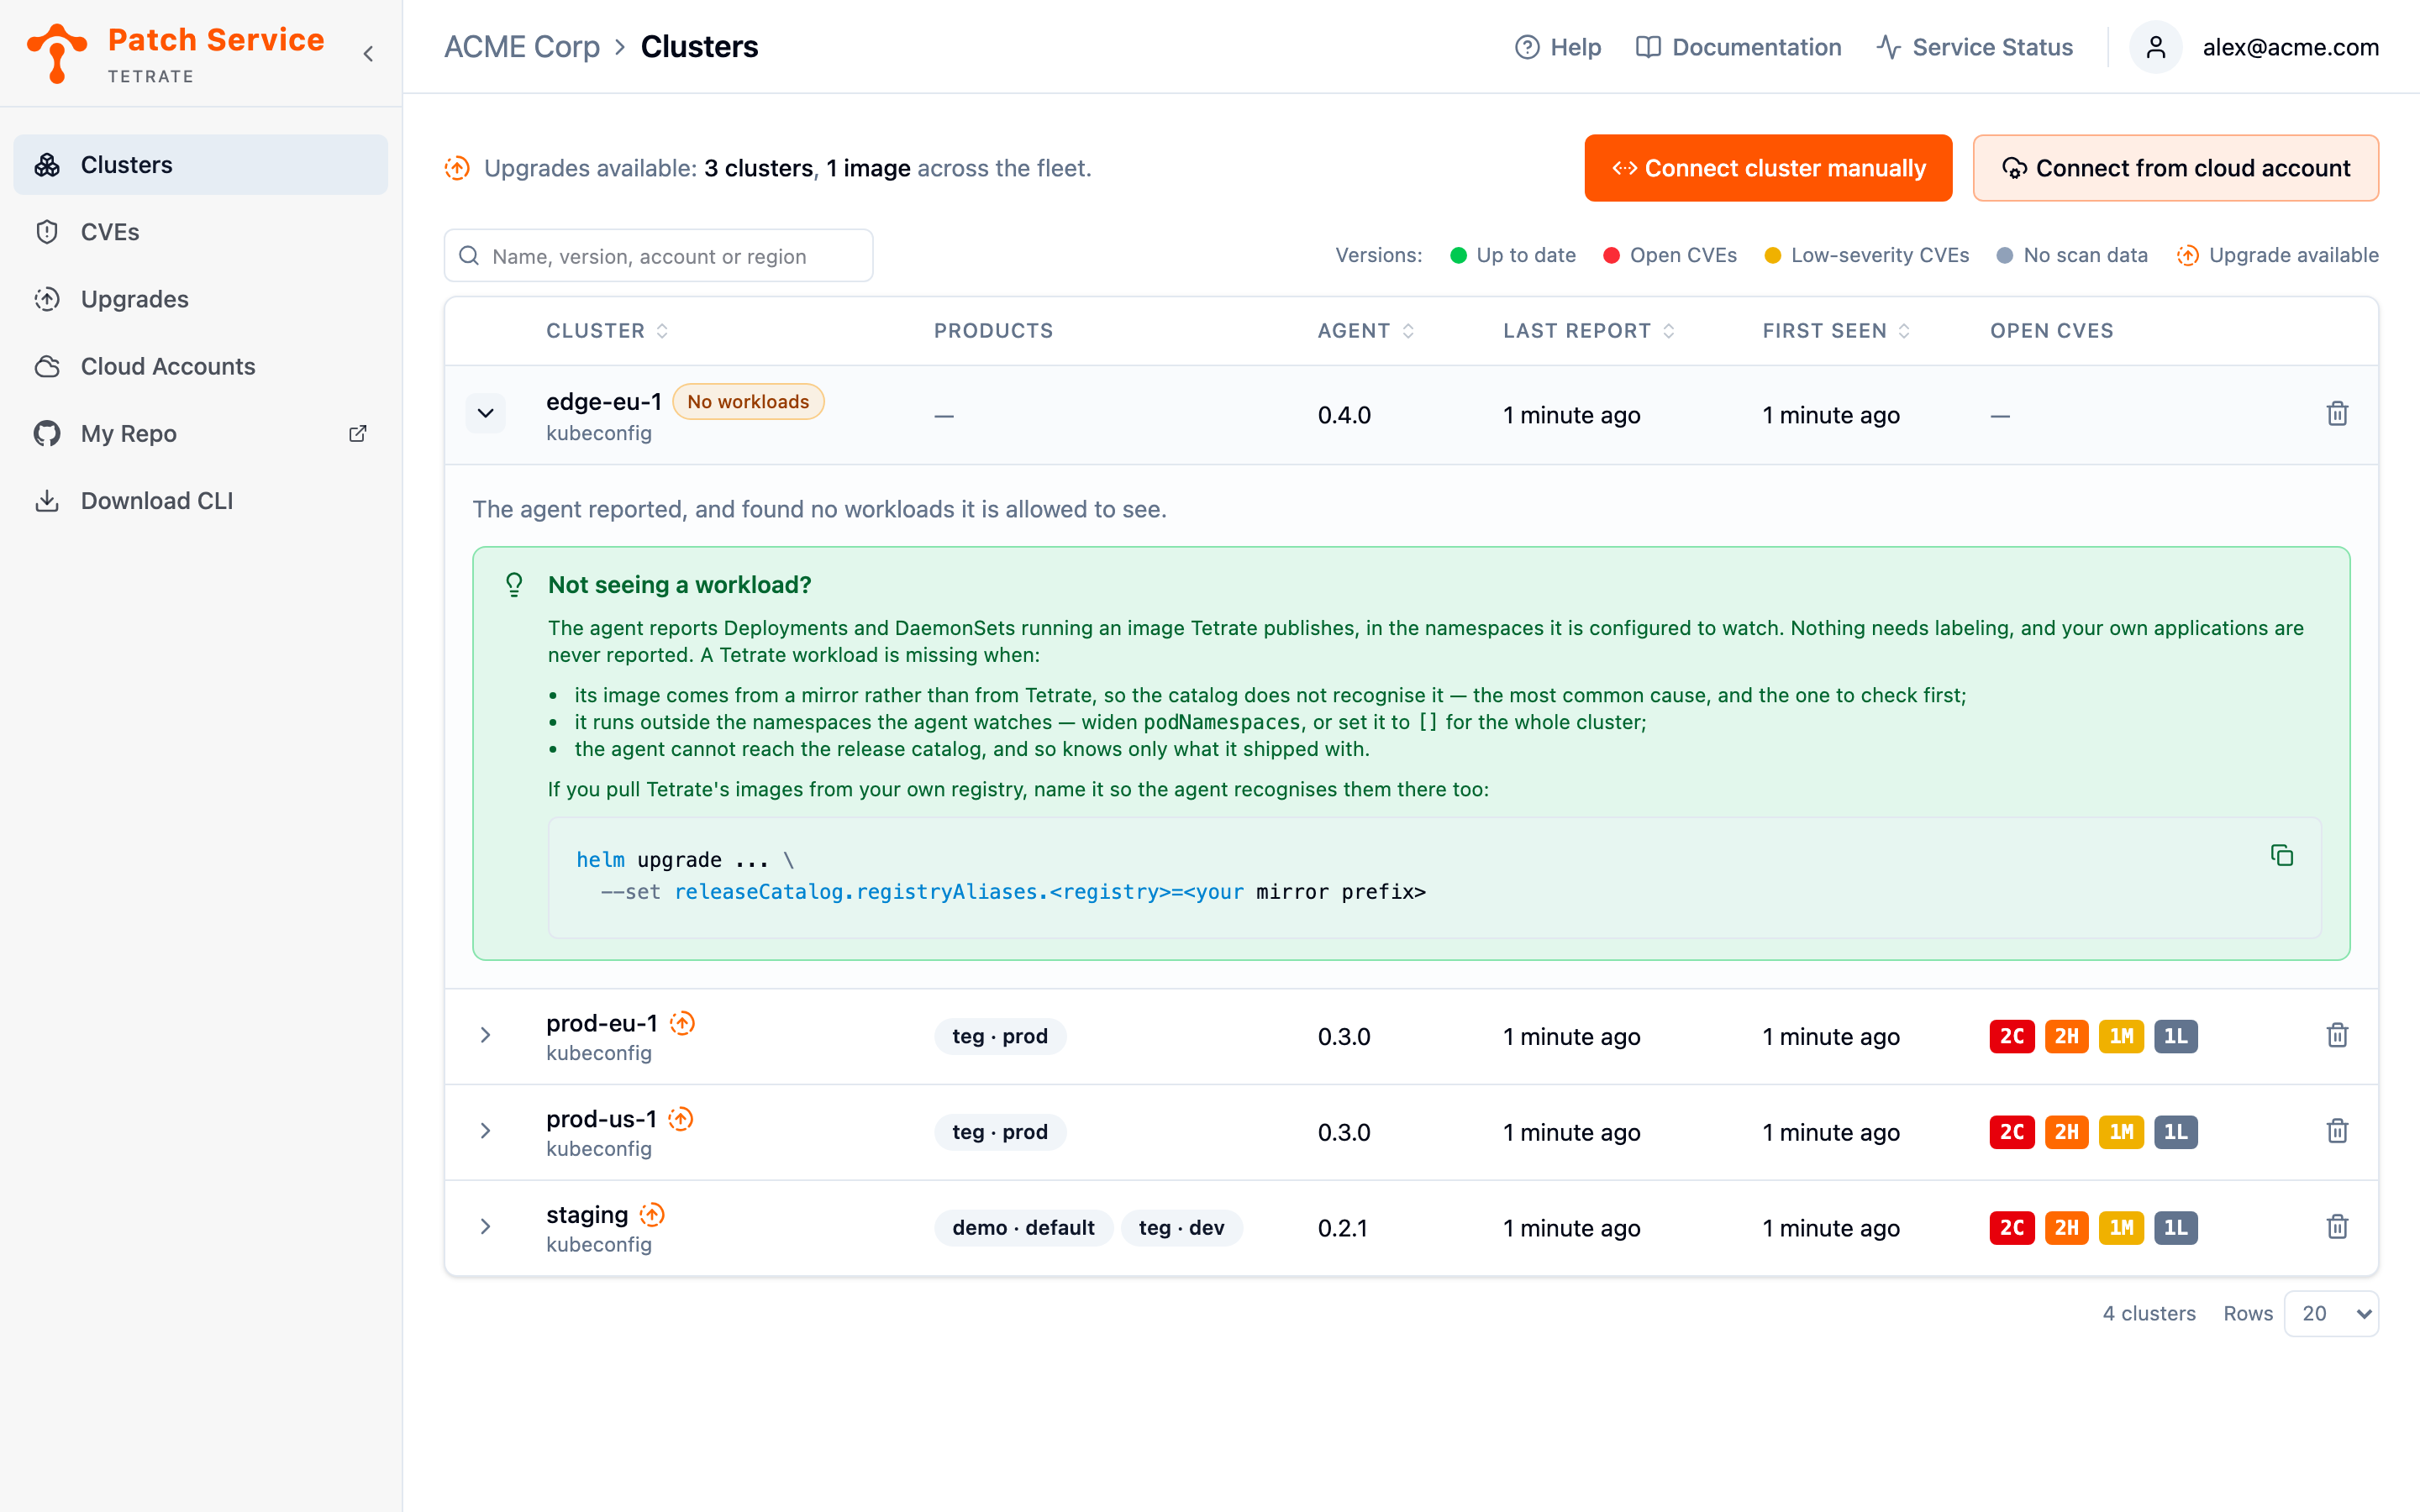
A cluster that has reported and shows no containers carries a No workloads badge: it is running no images the agent recognizes as Tetrate's. Expanding it says so, and names what to check: nothing in your cluster needs labeling, so the usual cause is a mirror the release catalog does not recognize, or Tetrate workloads running outside the namespaces the agent watches. See When a Cluster Reports Nothing.
Reading Version and Status
The two rightmost columns answer two different questions, which is why they are separate. Version is only ever about what runs today; Status is about what to do about it.
The Version badge carries the image's scan verdict, keyed by the legend above the list.
| Badge | What it means |
|---|---|
| Green, Up to date | The image was scanned and no open CVEs were found. Green appears only after a clean scan. |
| Red, Open CVEs | The image has open CVEs. These are the findings behind the cluster's Open CVEs chips. |
| Slate, No scan data | The image was observed but has not been scanned yet. |
The Status cell then carries whatever is worth acting on, and its two halves can appear together:
| Status | What it means |
|---|---|
Severity chips, for example 1C 1H | The image's open Critical and High findings. |
An arrow with a version, for example ↑ 1.9.0 | Upgrade available: the release catalog has a newer release, and the badge names the upgrade target to move to. It is highlighted when the image also has open CVEs, because the upgrade is then the fix. |
| Up to date | Neither of the above: nothing open and nothing newer. It is a stricter claim than the green version badge beside it, which speaks only for the scan, and this is the difference that matters: a clean scan of an old release is not up to date. |
| No scan data | The image was observed but has not been scanned, so there is nothing to say yet. |
The Patch Service fails visibly by design: missing evidence shows as missing, never as green, so treat a slate badge as a question still open, not as a pass.
Because the two columns are independent, a red version badge beside an upgrade badge is an image that is both vulnerable and fixable, which makes it the first place to act.
Removing a Cluster
To remove a decommissioned cluster, click the trash icon at the end of its row and confirm with Delete. This deletes the cluster and all its reported data from the Patch Service, and nothing else: the Patch Service holds no credentials for your clusters, so there is nothing on its side to uninstall or revoke.
A still-running agent re-registers on its next report, and the cluster reappears in the list. To actually stop a cluster from reporting, uninstall the agent from the cluster.
Next Steps
- When a cluster shows Critical or High chips, monitor the findings behind the counts in the CVEs view.
- When a row carries product chips, see the upgrades waiting on those products in the Upgrades view.
- To add clusters to the list, connect them manually or from a cloud account.
- To understand what the agent watches and why every report replaces the last, read Clusters and the Agent.