 Tetrate Patch ServiceVersion: alpha
Connecting Your First Cluster
Connecting a cluster to Tetrate Patch Service installs the Tetrate agent, which reports the container images running in the cluster. From then on the console shows an always-current image inventory and its CVE exposure. This guide takes you through onboarding your first cluster: run one command, and confirm the first report arrives. The agent recognizes Tetrate's workloads by itself, so there is no labeling step in between.
Before You Begin
- The
tetrateCLI, installed as described in Installing the Tetrate CLI. The CLI is self-contained, so you do not need kubectl, Helm, or Git. - A kubeconfig context pointing at the cluster you want to connect.
- Cluster-admin access to that cluster. Installing the agent creates cluster-scoped read permissions: the agent watches Deployments and DaemonSets, has no Pod access, and binds no ports.
Step 1: Open the Connect Cluster Page
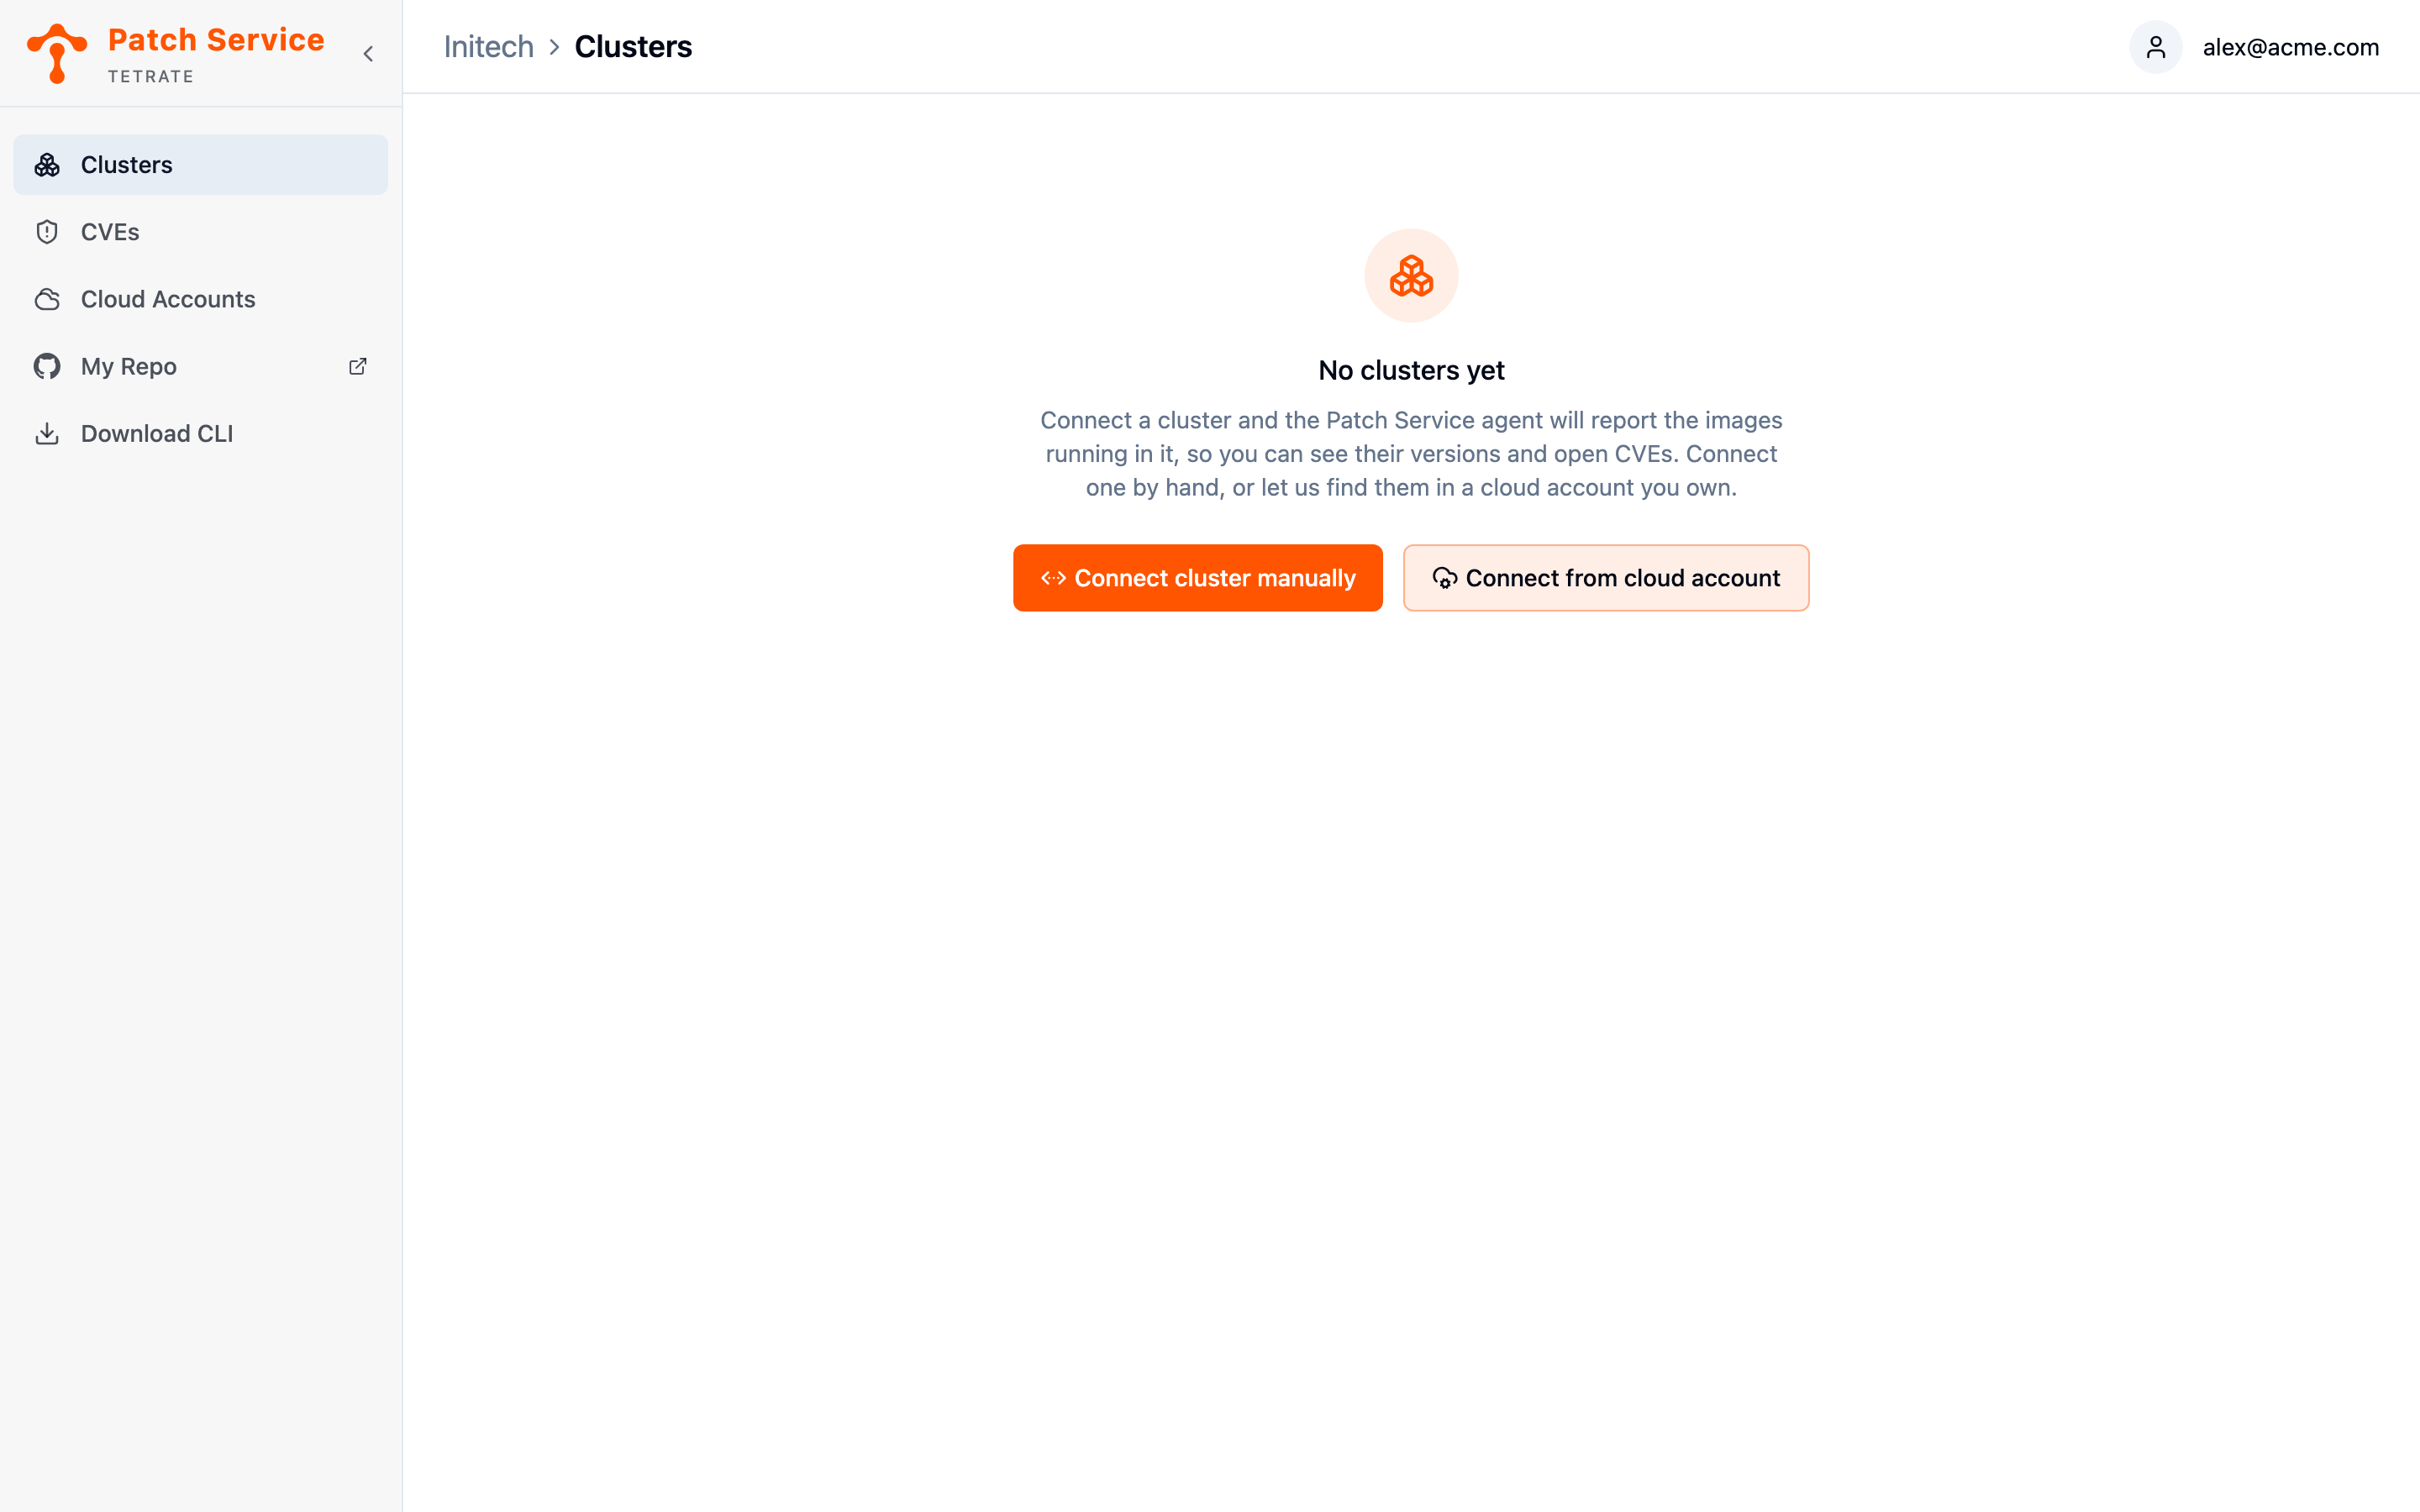
In the sidebar, open Clusters and click Connect cluster manually. The Connect Cluster page opens. If you have no clusters yet, the list is empty and the same buttons sit in the center of the page. The other button, Connect from cloud account, discovers clusters straight from an AWS account; if you have a whole fleet to connect, Connecting an AWS Account is the shorter path.
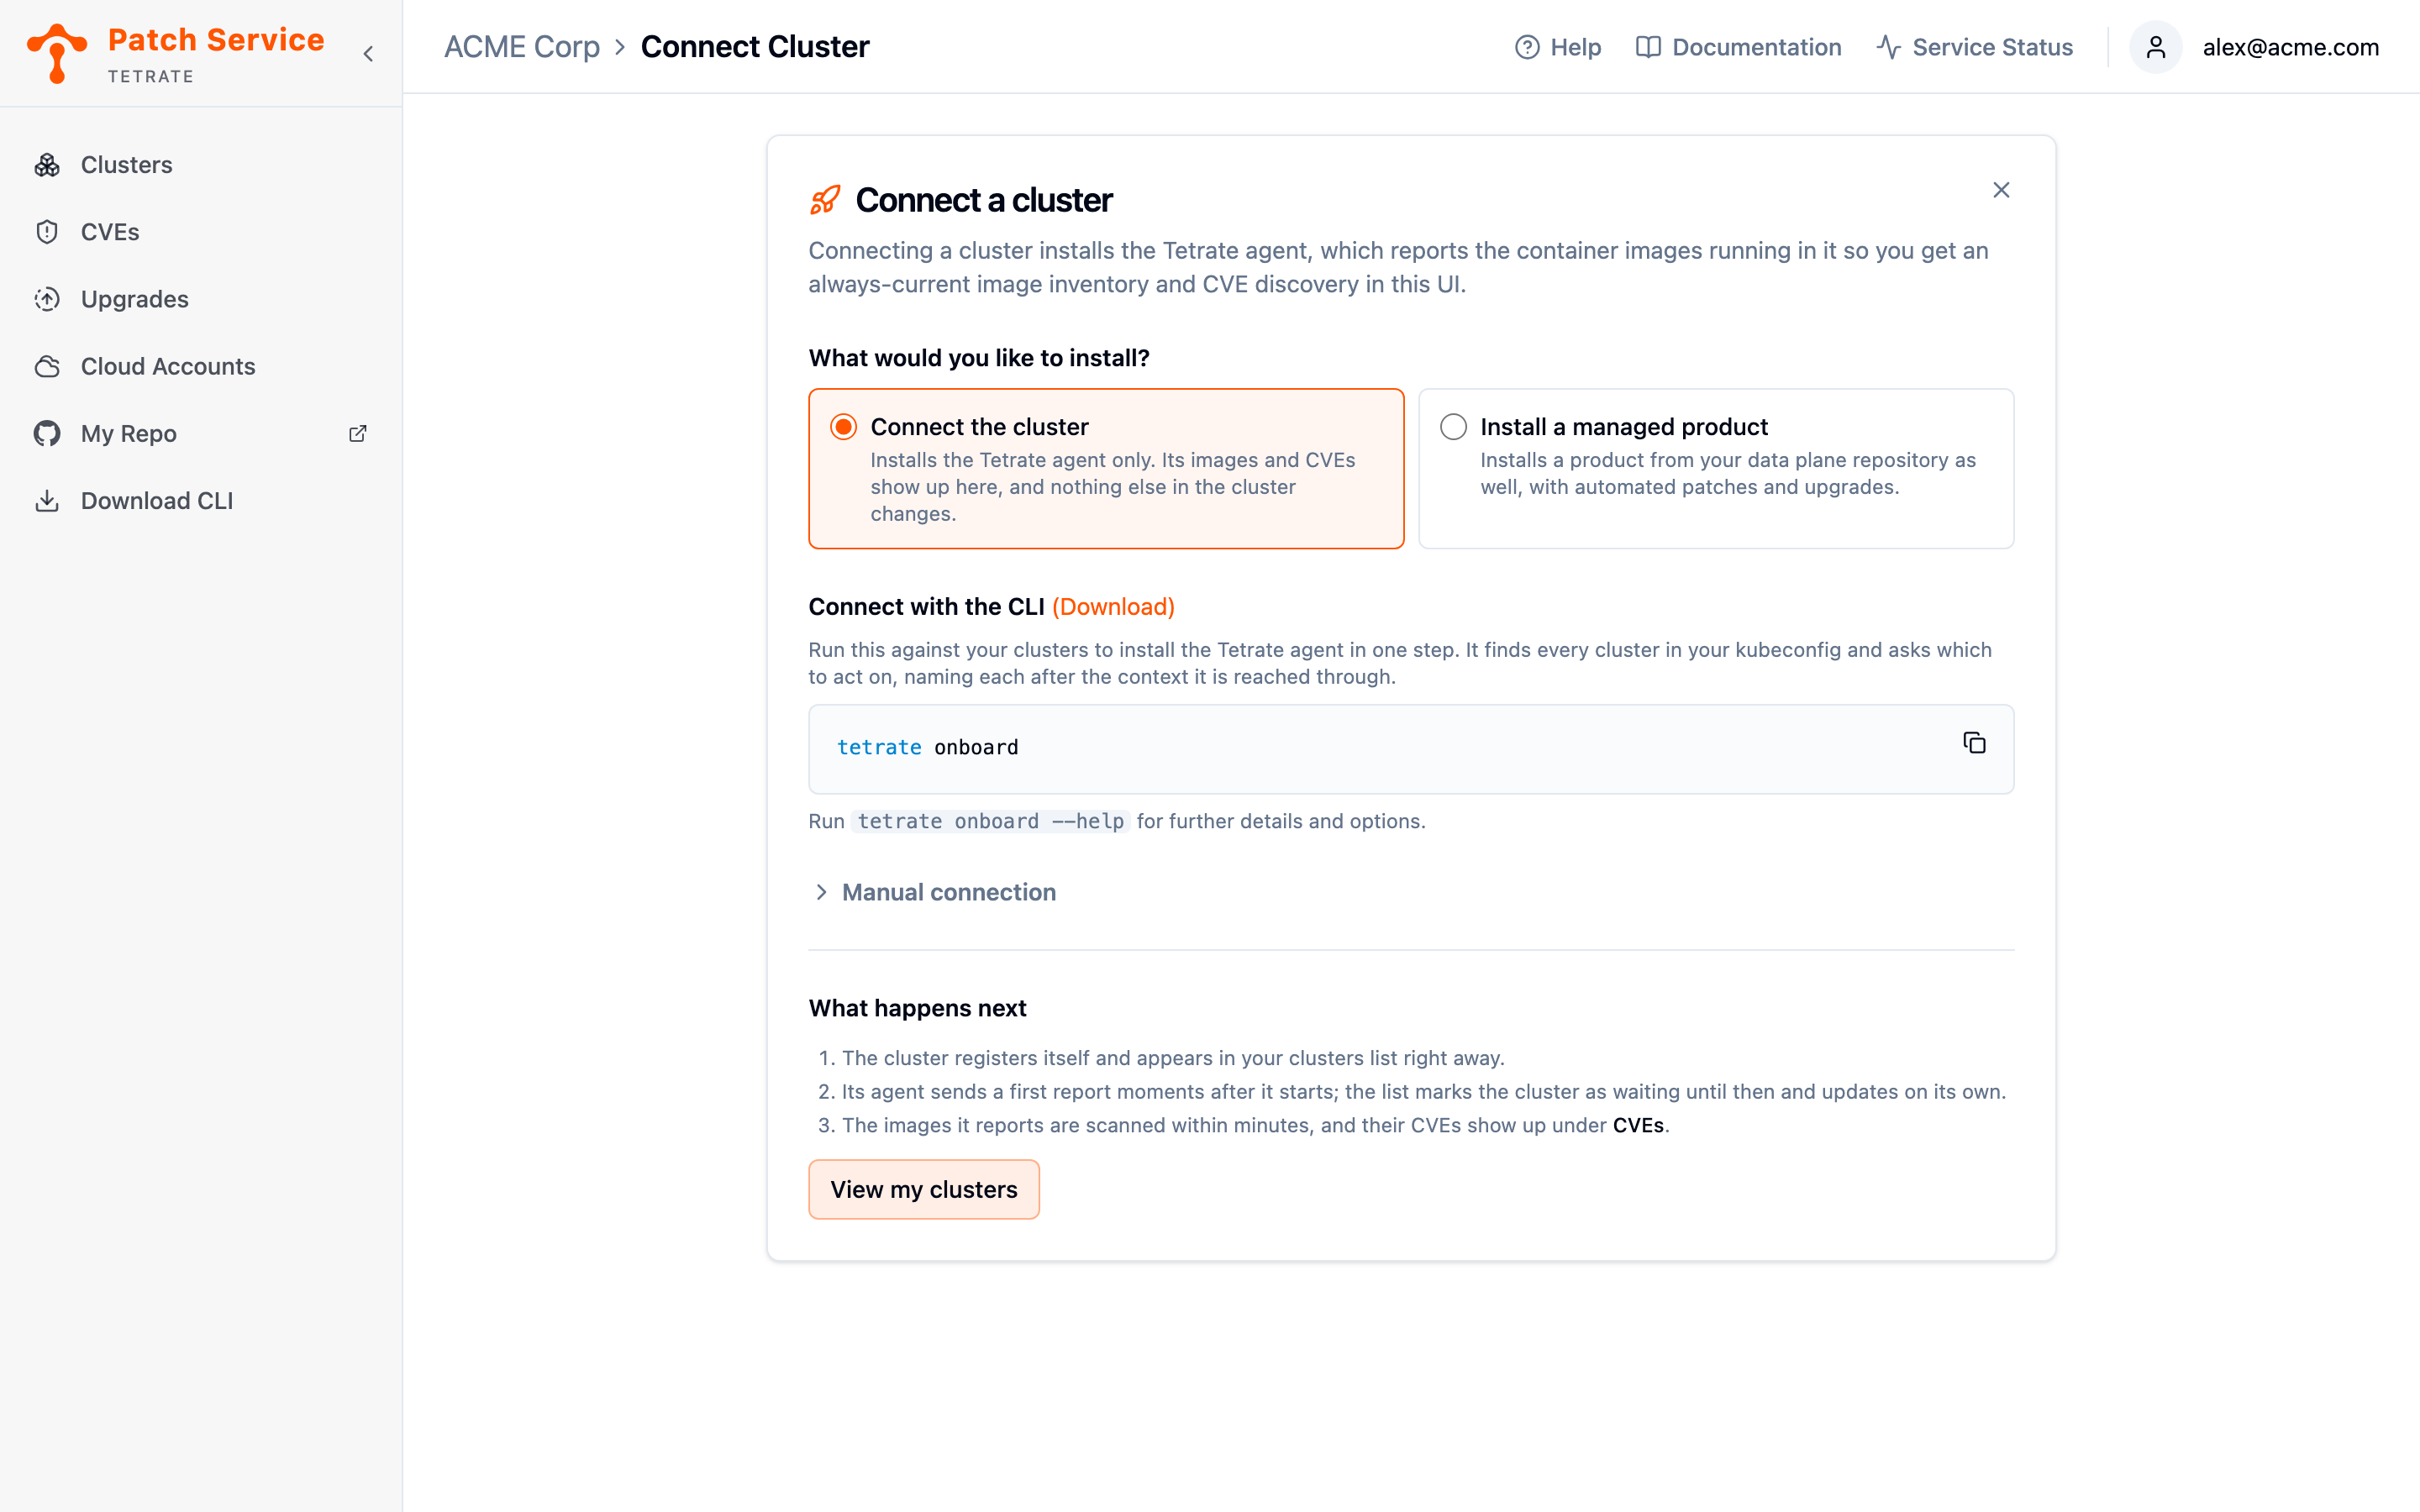
The page presents a set of instructions to help you register your clusters. If your organization uses the managed data plane, the page opens with What would you like to install? and two choices. Leave Connect the cluster selected: this guide installs the agent alone, and a managed install onto a connected cluster later adopts the running agent, so nothing is lost by starting small. To install a product at the same time, pick Install a managed product and see Installing a Managed Product.
Step 2: Run the CLI Command
Copy the command from the page and run it in a terminal:
tetrate onboard
The command looks at every context in your kubeconfig, shows what it would do, and asks which clusters to connect. Only your current context starts selected, so confirming without changing anything connects the cluster you are pointed at; press a to select them all. For each cluster it registers the cluster, applies the credentials the agent needs, and installs the agent.
The run opens with the plan, one row per context, and then the checklist:
CLUSTER           ACTION
payments-prod     onboard
payments-staging  onboard
kind-dev          onboard

3 to onboard

  Select clusters to onboard
  ↑↓/jk move · space toggles · a all · enter confirms · q aborts

> [x] payments-prod
  [ ] payments-staging
  [ ] kind-dev

  1 of 3 selected
Press enter to confirm. Each selected cluster gets its own numbered block, and the run closes with a report and a note on what the agent will find by itself:
Connecting cluster payments-prod

  [1/4] Checking cluster payments-prod… ✓
  [2/4] Preparing cluster payments-prod… ✓
  [3/4] Applying agent configuration… ✓
  [4/4] Installing Tetrate agent… ✓

Succeeded on 1 cluster(s).
  ✔ payments-prod

The agent finds Tetrate workloads on its own: it reports any Deployment or
DaemonSet running an image Tetrate publishes, in the configured namespaces.
There is nothing to label, and your own applications are never reported.

A cluster that stays empty is running no images the agent recognises. The usual
cause is a mirror: if you pull Tetrate's images from your own registry, name it
so the agent recognises them there too --

  --set releaseCatalog.registryAliases.<registry>=<your mirror prefix>
When your kubeconfig holds a single context, or you pass --kubecontext, there is nothing to choose: the command skips the plan and the checklist and runs the steps for that one cluster, with the account check as its first step.
The first command that needs the API opens your browser to sign in; there is no separate login command.
Each cluster is registered under the name its kube context suggests, reduced to a DNS-1123 label. You do not choose the name and there is no flag to override it: names are settled by the service, which keeps them unique for you. If another cluster already holds the name, this one is registered under a name derived from it and the summary says which.
Every step is idempotent, so a failure partway through leaves nothing to undo: fix the cause, run the same command again, and it converges on a connected cluster. Re-running never renames a cluster that is already registered.
If no machine with the CLI can reach the cluster, expand Manual connection on the page for the equivalent copy-paste commands, described in Connecting a Cluster Manually.
Step 3: Verify the Cluster Is Reporting
The cluster appears in the Clusters view with a Last report timestamp once its first snapshot arrives. Under its name, a small gray line names where it came from: kubeconfig for a cluster connected this way. Expand the cluster to see every container it reported, with the image, the version, and when it was observed.
There is nothing to do between installing the agent and seeing workloads. The agent reports the Deployments and DaemonSets running an image Tetrate publishes, matched against the public release catalog; your own applications are never reported, whatever namespace they run in. An install from the CLI watches the namespaces a Tetrate install uses, tetrate-dataplane-system, envoy-gateway-system, and envoy-ai-gateway-system, which you can widen if you run a Tetrate product somewhere else.
A snapshot is the complete set of containers the agent recognized in the cluster and replaces the previous one, so the console shows what runs now, not a history. Clusters and the Agent explains what the agent watches and how reporting works.
A connected cluster that reports nothing is running no images the agent recognizes. Check, in this order: whether its Tetrate images come from your own mirror rather than from Tetrate, whether the Tetrate workloads run outside the namespaces the agent watches, and whether the cluster can reach the release catalog. When a Cluster Reports Nothing covers each case and its setting.
Next Steps
- With the cluster reporting, read its image inventory to see open CVE counts per cluster and the orange Upgrade available markers.
- Once the first scans complete, monitor your CVE exposure to see open findings by severity, category, and age.
- If your clusters run in AWS, connect the whole account at once instead of onboarding each cluster by hand.