Get Started with TSB Telemetry
This page details how to collect telemetry necessary for monitoring and observing Tetrate Service Bridge. Refer to the Service Metrics with PromQL documentation for service and application telemetry.
How TSB provides Internal Metrics
TSB provides a large set of internal Key Metrics that can be used to observe the operation of the internal components of the Tetrate Control and Management Planes.
These metrics are not exposed through the standard PromQL endpoint in the front-envoy service because they are intended to be used to monitor the successful operation of the Tetrate platform.
This ensures that the metrics can still be obtained if the front-envoy service is unavailable for any reason.
The metrics are exposed as a simple, unauthenticated scrape target from an internal Open Telemetry Collector service in the Control and Management Planes. This collector accumulates the metrics from all the local services:
Management Plane Metrics are provided by the otel-collector service in the tsb namespace in the Management Plane cluster, on port 9090:
kubectl port-forward -n tsb svc/otel-collector 9090:9090 &
curl localhost:9090/metrics
Control Plane Metrics are provided by the otel-collector service in the istio-system namespace in each Control Plane cluster, on port 9090
kubectl port-forward -n istio-system svc/otel-collector 9090:9090 &
curl localhost:9090/metrics
Worked Example: Inspect the Key Metrics using Grafana
This quick example will deploy a Prometheus and Grafana stack on a single host, using Docker. You can use this to observe the internal Key Metrics from the Tetrate Management Plane.
This example is intended to be a quickstart only. For production usage, you may wish to deploy Prometheus locally in each Tetrate cluster, and expose the metrics securely.
Expose the Metrics on your local machine
Expose the metrics on port 9094 on the local machine. Note that port 9090 will be required by the Prometheus service you will deploy.
Expose metrics from the Tetrate Management Plane on port 9094kubectl port-forward svc/otel-collector -n tsb 9094:9090Verify that they are accessible:
curl http://localhost:9094/metricsCreate the required Docker and Prometheus configuration
Use the following docker-compose.yaml and prometheus.yml configuration:
docker-compose.yamlversion: '3.8'
networks:
monitoring:
driver: bridge
services:
prometheus:
image: prom/prometheus
container_name: prometheus
ports:
- 9090:9090
volumes:
- ./prometheus.yml:/etc/prometheus/prometheus.yml
networks:
- monitoring
grafana:
image: grafana/grafana:latest
container_name: grafana
ports:
- '3000:3000'
volumes:
- 'grafana_storage:/var/lib/grafana'
networks:
- monitoring
volumes:
grafana_storage: {}prometheus.ymlglobal:
scrape_interval: 15s
scrape_configs:
- job_name: 'tsb'
static_configs:
- targets: ['host.docker.internal:9094']Place both files in the same location (directory) and start the Prometheus/Grafana stack:
docker compose up -dUsing a web browser, verify that you can access the Prometheus service on http://localhost/9090 and the Grafana service on http://localhost:3000 (default username admin, password admin).
Using
curl, verify that the prometheus service is successfully scraping the data from the Management Plane. You should see a list of all the metrics that have been discovered:curl http://localhost:9090/api/v1/label/__name__/values | jq .Configure Grafana to chart the Management Plane metrics
Upload the Tetrate Key Metrics dashboards as follows:
tctl experimental grafana upload --url http://localhost:3000 --username=admin --password=adminUse
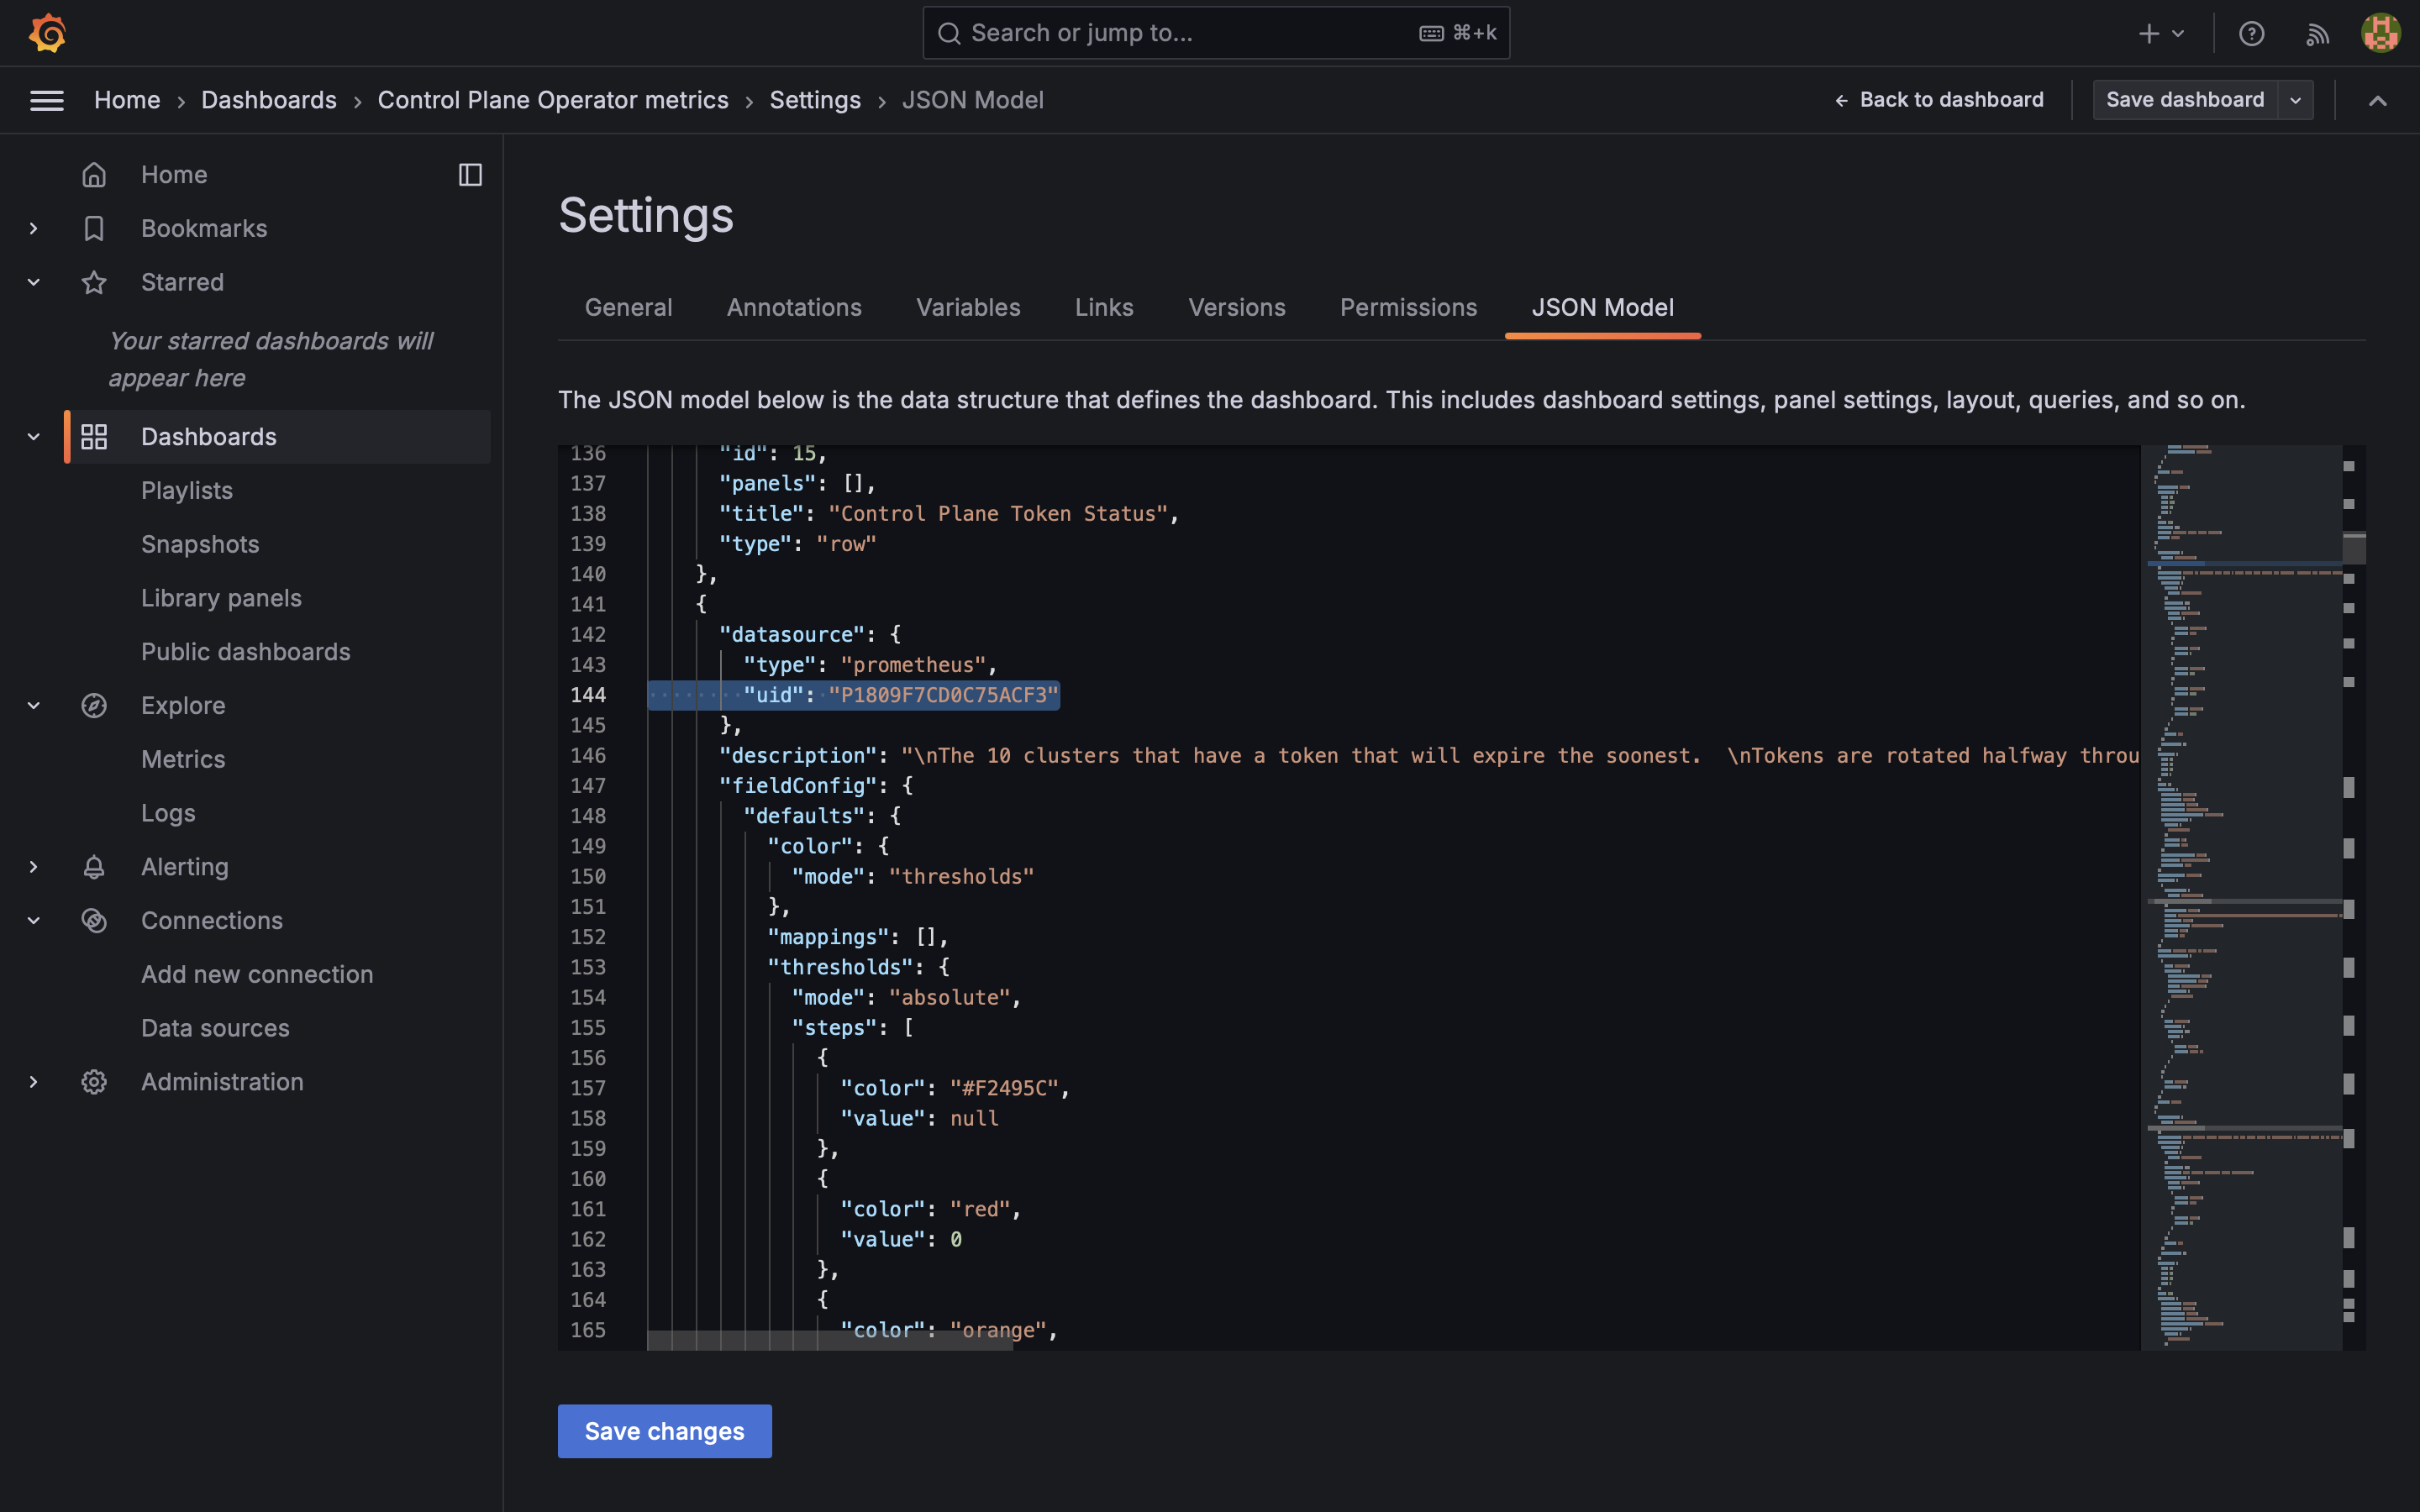
--overwriteif necessary.The dashboards use a default UUID to identify the datasource. Find the UUID (typically something like
P1809F7CD0C75ACF3) by inspecting the JSON model for one of the dashboards: Datasource for the Grafana Dashboard
Create a Datasource with that name (UUID), with the following settings:
- Prometheus Server URL: http://prometheus:9090/
Save and Test the datasource:
 Save and Test the Datasource
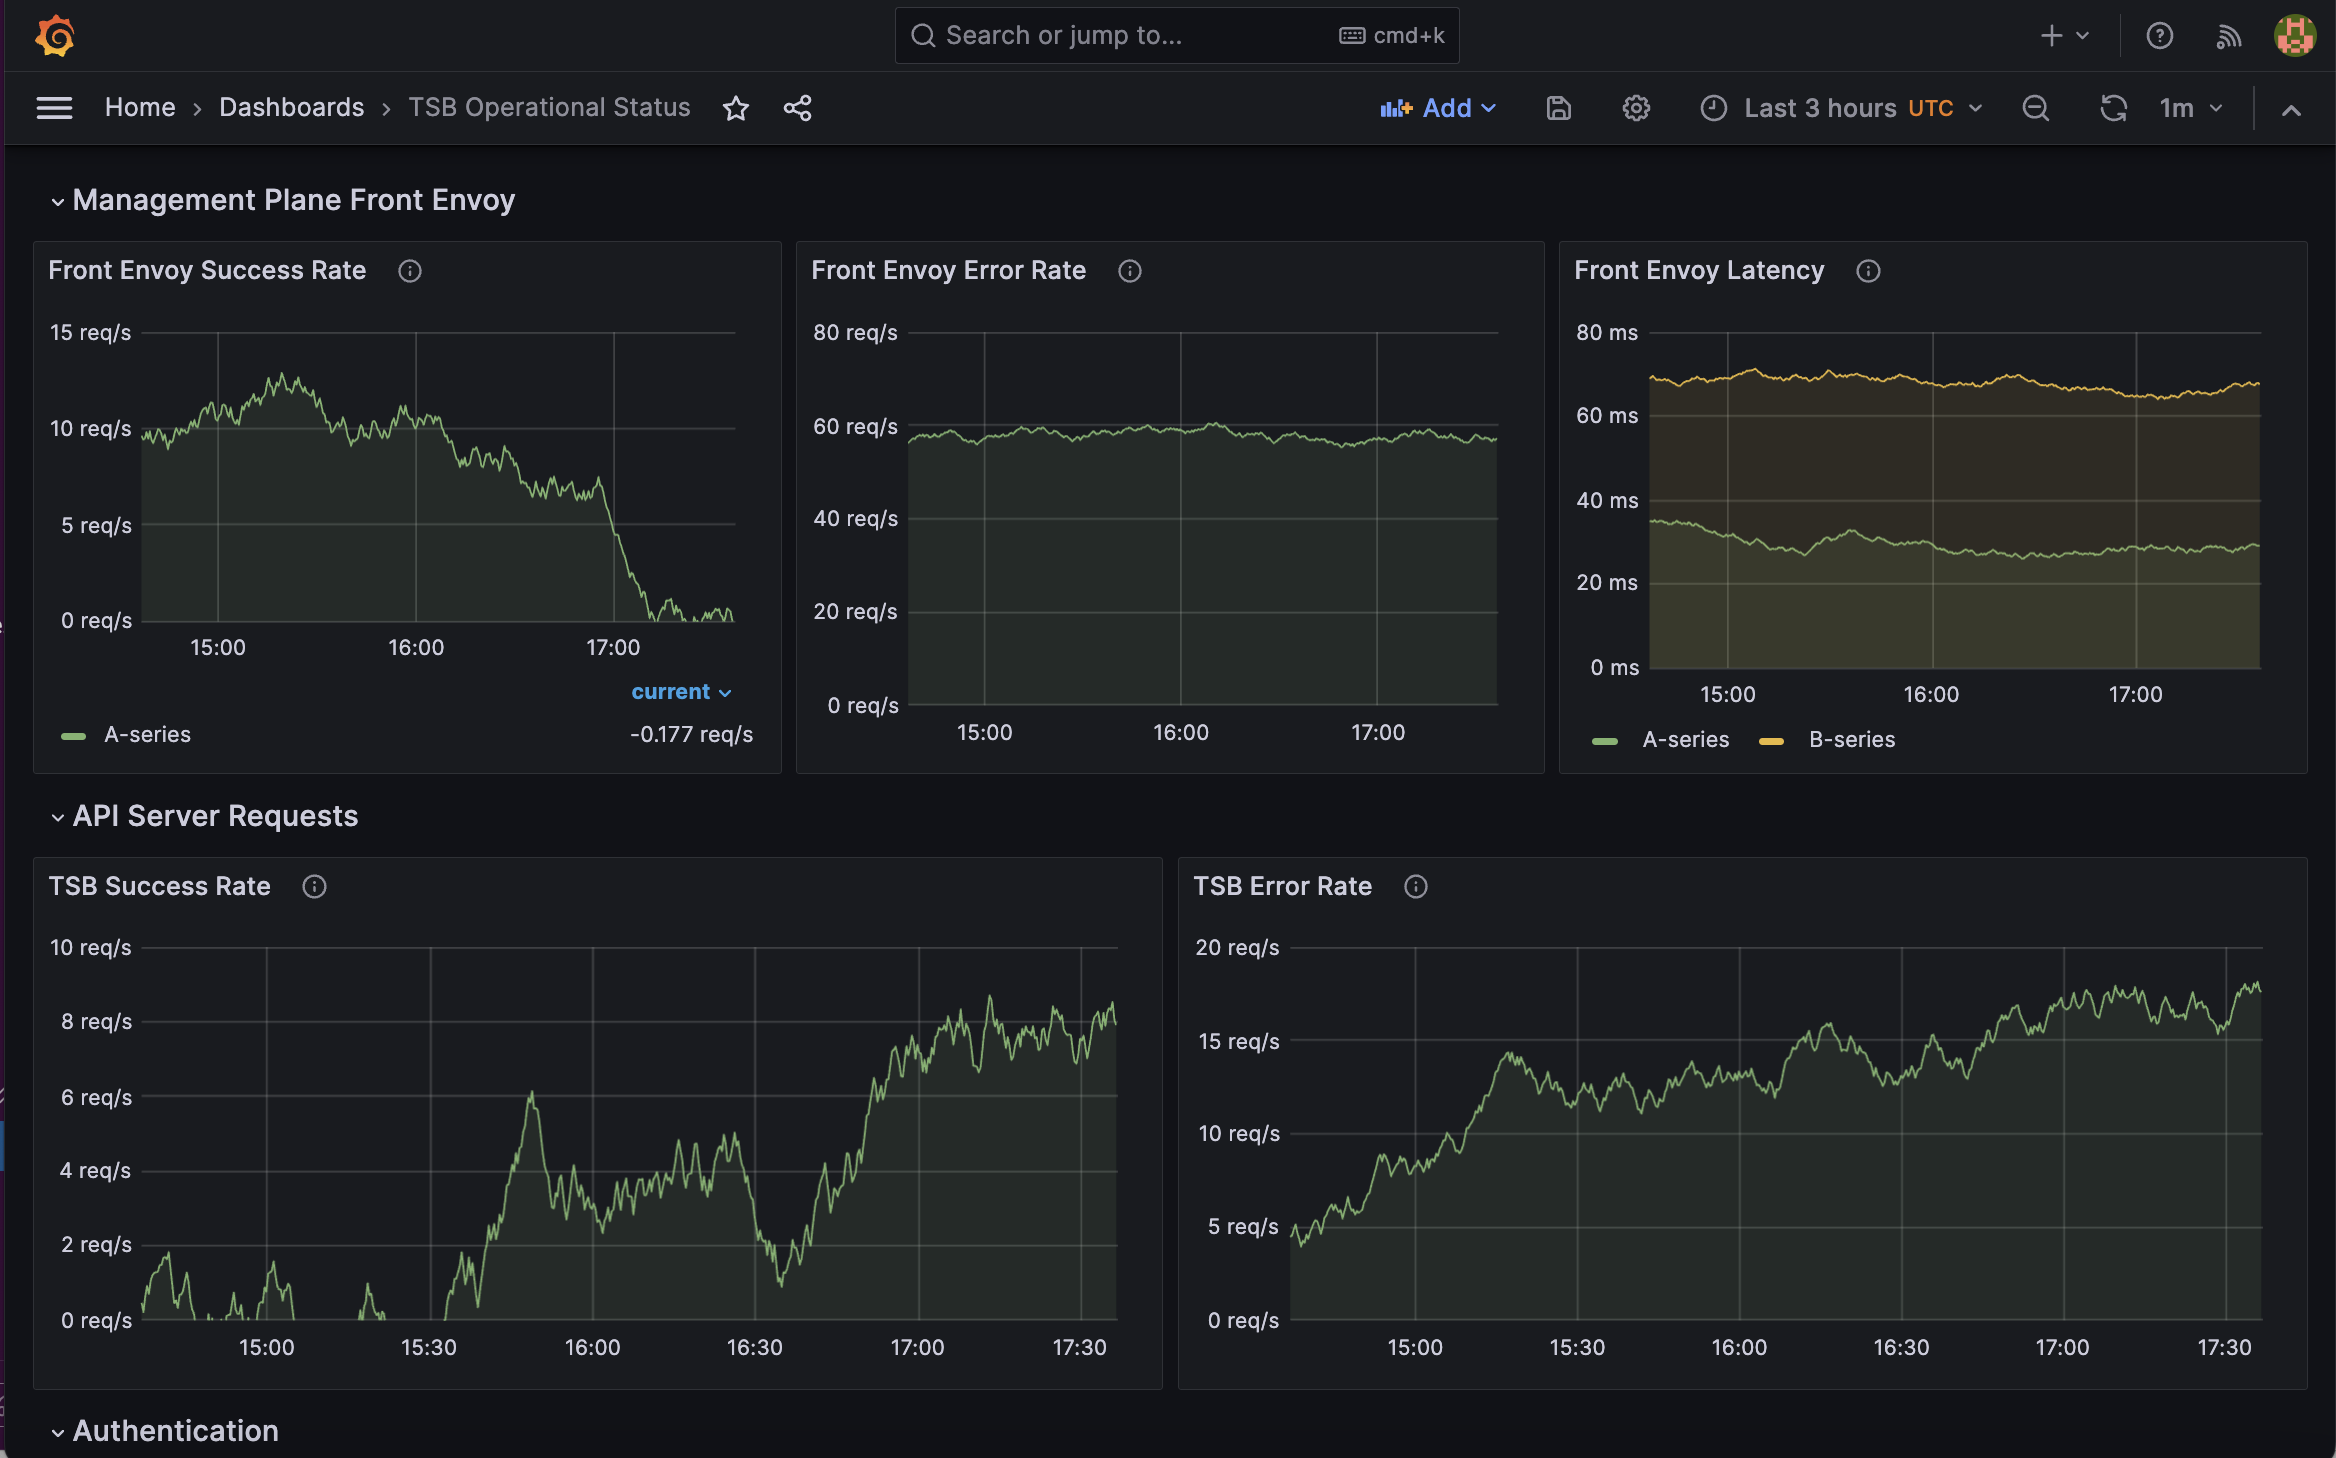
Explore the Management Plane and Control Plane Metrics
Allow a number of minutes for sufficient scrapes of metrics to be gathered. Note that some of the Dashboard Metrics are based on time series so will take time to accumulate and display.

Ensure that the
port-forwardis still active, and restart it if it fails:while sleep 1 ; do
kubectl port-forward svc/otel-collector -n tsb 9094:9090 ;
done
Production Deployment
You should not rely on forwarded metrics in production installations. Instead, we recommend scraping each available collector locally using a dedicated Prometheus installation, and exposing the promql endpoint securely to your Grafana stack.
