Tetrate Service BridgeVersion: 1.13.x
Topology and Metrics
Before you get started, make sure you:
✓ Familiarize yourself with TSB concepts
✓ Install the TSB demo environment
✓ Deploy the Istio Bookinfo sample app
✓ Create a Tenant
✓ Create a Workspace
✓ Create Config Groups
✓ Configure Permissions
✓ Set-up an Ingress Gateway
To view service topology and metrics, the bookinfo app needs traffic so that TSB will have metrics and traces from bookinfo services. Use the following scripts to generate traffic:
Note: change the GATEWAY_IP to actual Ingress Gateway IP on your deployment. We already set the GATEWAY_IP variable in the previous step.
Save the following script as send-requests.sh
#!/bin/sh

while true; do
    result=$(curl -m 5 -k -s -o /dev/null -I -w "%{http_code}" "https://bookinfo.tetrate.com/productpage" --connect-to bookinfo.tetrate.com:443:$GATEWAY_IP)
    echo date: $(date),  status code: "$result"
    sleep 1
done
Make the script executable and run it
chmod +x send-requests.sh
./send-requests.sh
This will send a request to bookinfo's product page every 1 second. After a while, you can inspect services topology and metrics in the TSB UI.
- Under Tenant on the left panel, select Dashboard
- Click Select Clusters-Namespaces
- Check the items you want to see the metrics and topology for. If you followed
the quickstart guide from the beginning, you should see an entry for Tenant
tetrate, Namespacebookinfo, and Clusterdemo.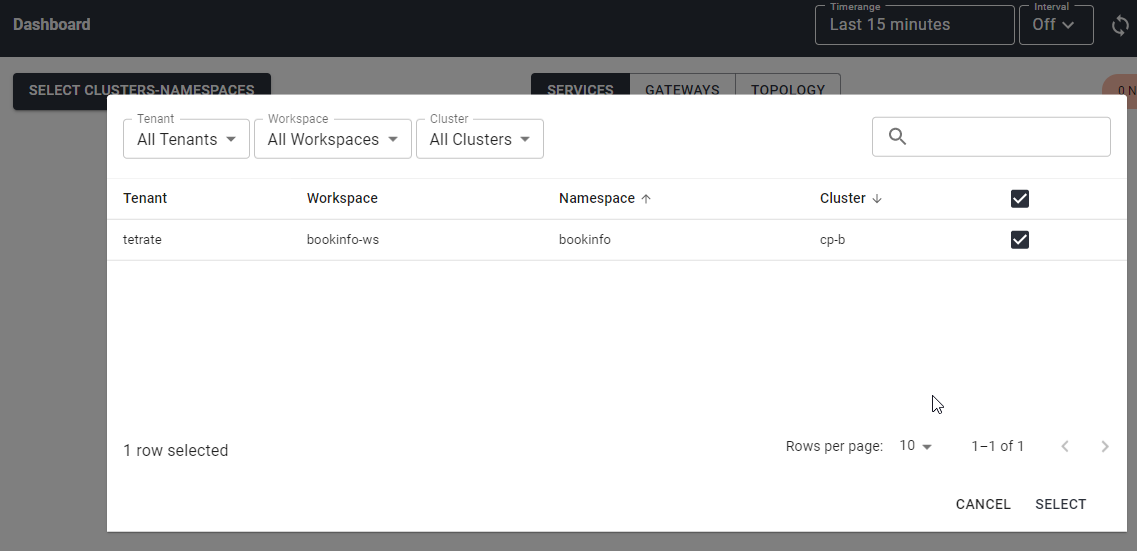
- Click Select

You can set the duration of data you wish to view, and enable automatic refresh. Settings are found in the top menu bar in the TSB UI:
- Select a time range, for example, Last 5 minutes, for the data you wish to view
- Click the Refresh Metrics icon to manually reload metrics, or select a refresh Interval to automatically refresh the page
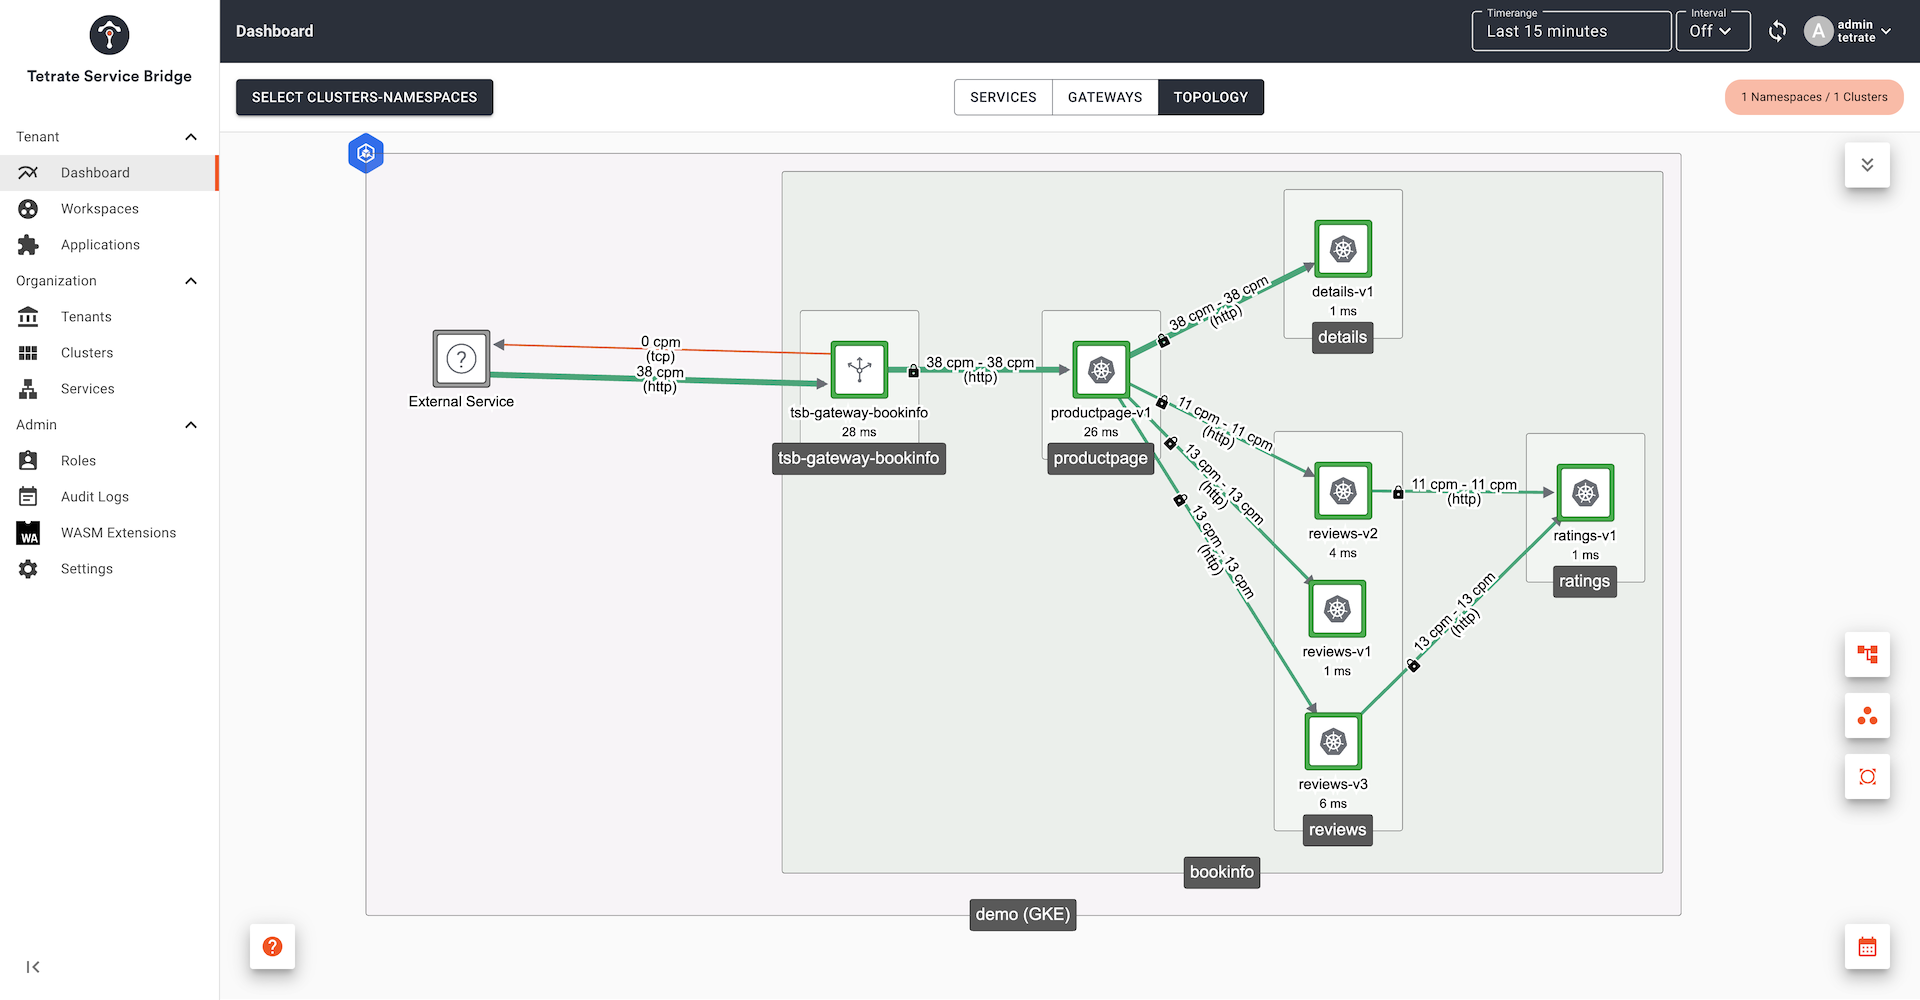
Topology
Begin with the Topology page, and explore the topology graph of your collection of services and look at the metrics relating to traffic volumes, latency and error rates:
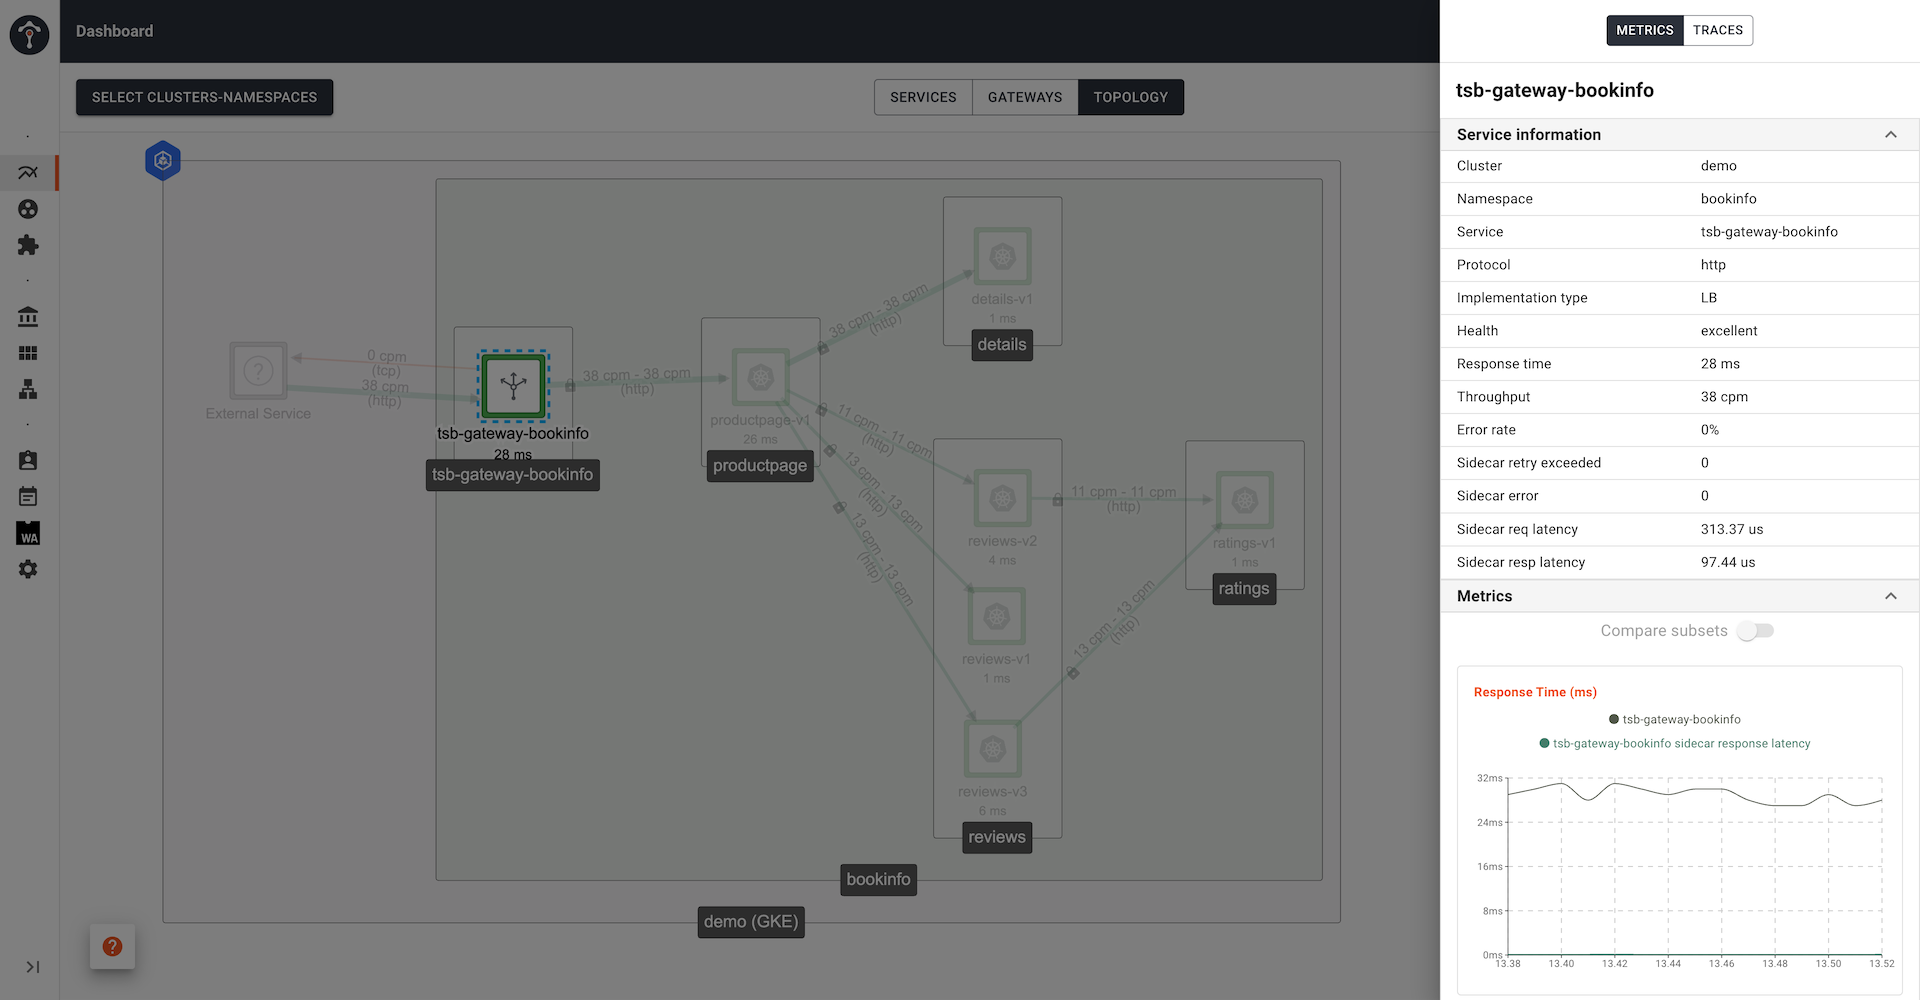
Metrics and Traces
You can hover over an individual service instance to get more detailed metrics, or click for a fuller breakdown:
TSB automatically samples requests and gathers trace data for a subset of requests. Select one of the services, and click Trace to list the recent traces captured through that service. You can then explore the full trace, and identify traffic flows, timings and error events:
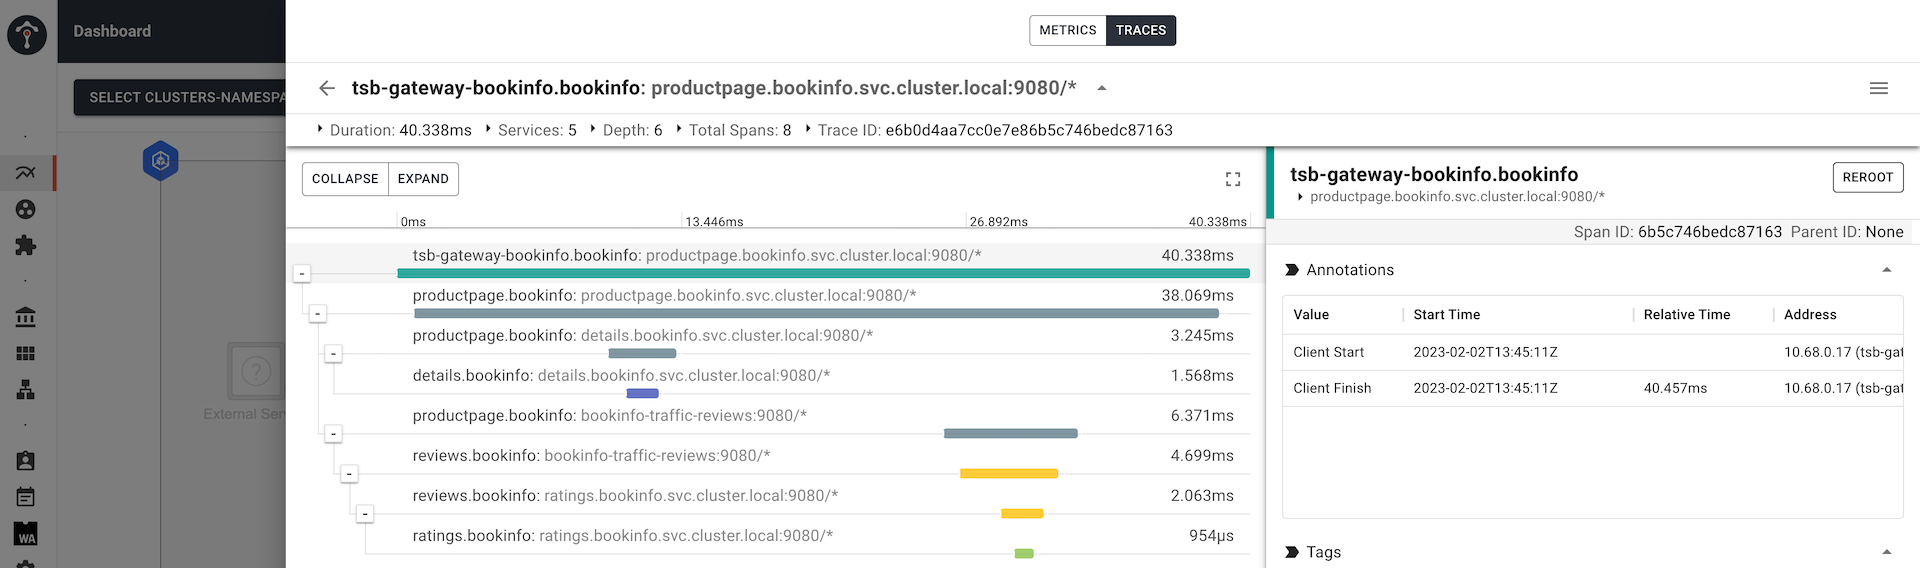
We can interpret this trace, understanding that:
tsb-gateway-bookinfo.bookinfocallsproductpage.bookinfo.svc.cluster.local:9080, invoking serviceproductpagein namespacebookinfoproductpage.bookinfofirst callsdetails.bookinfo.svc.cluster.local:9080, invokingdetailsin namespacebookinfoproductpage.bookinfolater callsreviews.bookinfo.svc.cluster.local:9080, invokingreviewsin namespacebookinforeviews.bookinfocallsratings.bookinfo.svc.cluster.local:9080, invokingratingsin namespacebookinfo
We can see the deltas in time between the caller making the calls, and the target service reading and responding. The deltas correspond to the (typically small) latency of the network call and the mesh sidecar proxies.
For more complex call graphs, you can re-root the display to start from an internal service, thereby filtering out the front-end gateway and other front-end services.
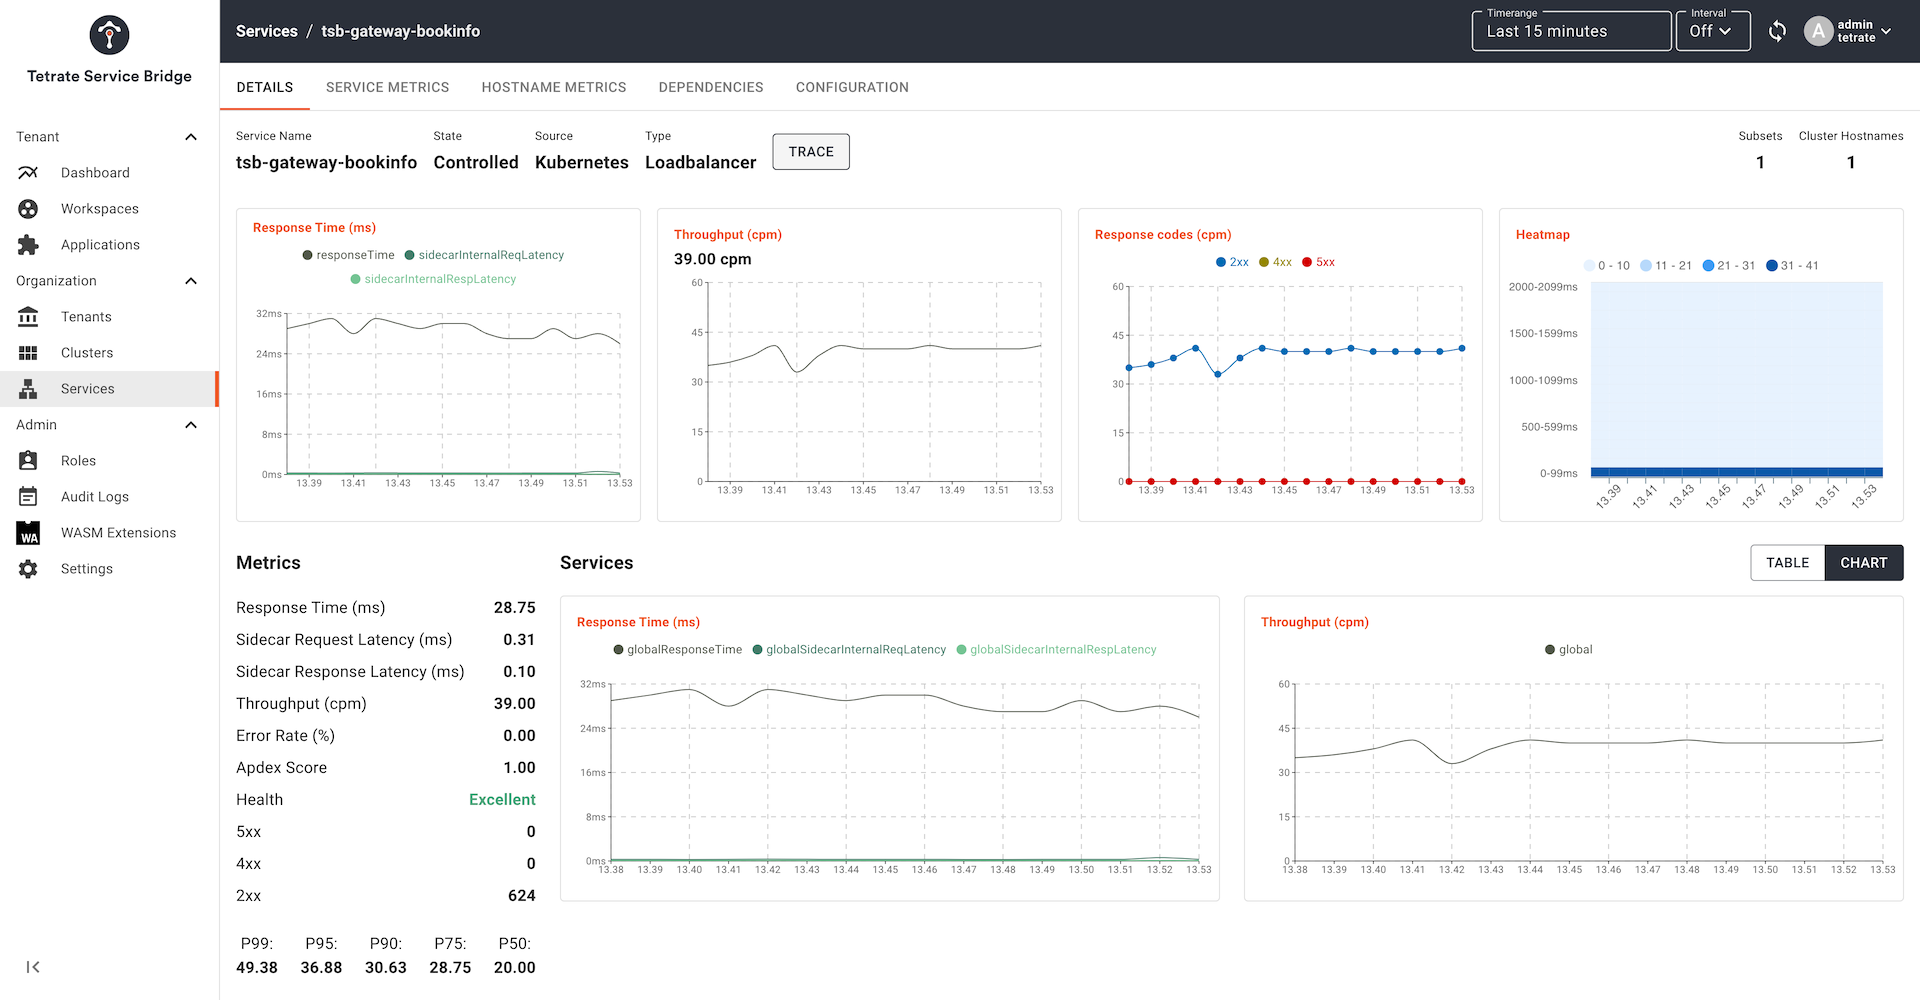
Service Dashboard
Finally, navigate to the Services pane in the TSB UI and select one of the services managed by TSB. This reveals a rich, multi-pane dashboard from where you can drill down into a range of metrics relating to that service: