 Tetrate Service BridgeVersion: 1.12.x
Key Metrics
Tetrate Service Bridge collects a large number of metrics. This page is generated from dashboards ran internally at Tetrate and will be updated periodically based on best practices learned from operational experiences in Tetrate and from user deployments. Each heading represents a different dashboard, and each sub-heading is a panel on this dashboard. For this reason, you may see metrics appear multiple times.
The metrics in this document refer to TSB components, so be sure to check the TSB architecture to get a good understanding of each component and its function.
The list of available dashboards can be obtained with the tctl experimental grafana dashboard command. To download a dashboard in JSON format to upload it to Grafana, you can run the command as follows:
tctl experimental grafana dashboard <dashboard file name> -o json
You can also upload de dashboards directly to your Grafana instance using the tctl experimental grafana upload command.
Control Plane Operator metrics
Dashboard to show the status of control plane operator metrics.
Control Plane Mode
This panel represents the control plane mode configured in the control plane cluster.
Possible values are:
- CONTROL(Default)
- OBSERVE
| Metric Name | Labels | PromQL Expression |
|---|---|---|
control_plane_mode | N/A | control_plane_mode == 1 |
Closest Token To Expire
The 10 clusters that have a token that will expire the soonest.
Tokens are rotated halfway through their validity period. By default, tokens are valid for one hour, so they are rotated 30 minutes after creation. If a cluster's time is displayed in red or with a negative value, it indicates that at least one token has expired without being rotated. In such cases, please review the "Token Rotations Execution Failed" chart to check for any failed token rotation attempts.
| Metric Name | Labels | PromQL Expression |
|---|---|---|
token_expiration_timestamp | cluster_name | max(max_over_time(token_expiration_timestamp{cluster_name=~"${cluster}"}[1m])) by (cluster_name) - time() |
Clusters Not Validating Tokens
Each cluster should validate all its token every 60 seconds. If a cluster shows up it means that the last time it validated the tokens and reported the result is over 120 seconds ago.
This doesn't necessarily mean that any token is invalid or is not being rotated properly. For example, the metrics may not have been reported correctly or in a timely manner, or that there is a problem with the TSB Control Plane operator.
| Metric Name | Labels | PromQL Expression |
|---|---|---|
last_tokens_validation_timestamp | cluster_name | max(time() - max_over_time(last_tokens_validation_timestamp{cluster_name=~"${cluster}"}[1m])) by (cluster_name) |
Valid Tokens
Number of valid control plane tokens.
| Metric Name | Labels | PromQL Expression |
|---|---|---|
valid_tokens | cluster_name | max(max_over_time(valid_tokens{cluster_name=~"${cluster}"}[1m])) by (cluster_name) |
Token Rotation Executions
Number of token rotation executions. An execution doesn't necessarily mean than a token has been rotated as they might still be valid.
| Metric Name | Labels | PromQL Expression |
|---|---|---|
token_rotation_executions_count_total | cluster_name | sum(increase(token_rotation_executions_count_total{cluster_name=~"${cluster}"}[1m])) by(cluster_name) |
Token Rotation Execution Failed
Number of failed token rotation executions. If there are errors in this chart it means that the token could not be rotated. Please check the TSB Control Plane operator logs to find the cause. Use the following command: kubectl logs -n istio-system -l name=tsb-operator --tail=-1 | grep "token rotation failed, retrying in"
| Metric Name | Labels | PromQL Expression |
|---|---|---|
token_rotation_executions_count_total | cluster_name status | sum(increase(token_rotation_executions_count_total{cluster_name=~"${cluster}", status="failed"}[5m])) by(cluster_name) |
Tokens Exceeded Rotation Time
Number of control plane tokens that exceeded their rotation time.
| Metric Name | Labels | PromQL Expression |
|---|---|---|
token_exceeded_rotation_time | cluster_name | max(max_over_time(token_exceeded_rotation_time{cluster_name=~"${cluster}"}[1m])) by (cluster_name) |
Tokens Rotated Successfully.
Number of tokens that have been rotated successfully. If the values are 0 it might mean that the token rotation execution is failing or that TSB Control Plane operator is not even running.
| Metric Name | Labels | PromQL Expression |
|---|---|---|
token_rotations_count_total | cluster_name status | sum(increase(token_rotations_count_total{cluster_name=~"${cluster}", status="success"}[1m])) by(cluster_name) |
Failed Tokens to Rotate.
Number of tokens that have been could not be rotated.
| Metric Name | Labels | PromQL Expression |
|---|---|---|
token_rotations_count_total | cluster_name status | sum(increase(token_rotations_count_total{cluster_name=~"${cluster}", status="failed"}[1m])) by(cluster_name) |
Tokens Exceeded Rotation Timeline
Number of control plane tokens that exceeded their rotation time.
| Metric Name | Labels | PromQL Expression |
|---|---|---|
token_exceeded_rotation_time | cluster_name | max(max_over_time(token_exceeded_rotation_time{cluster_name=~"${cluster}"}[1m])) by (cluster_name) |
Valid Tokens Timeline
Number of valid control plane tokens.
| Metric Name | Labels | PromQL Expression |
|---|---|---|
valid_tokens | cluster_name | sum(valid_tokens{cluster_name=~"${cluster}"}) by (cluster_name) |
Invalid Tokens
Number of invalid control plane tokens grouped by the reason.
| Metric Name | Labels | PromQL Expression |
|---|---|---|
invalid_tokens | cluster_name | sum by (reason) (invalid_tokens{cluster_name=~"$cluster"}) |
token_missing_rotate_at_annotation | cluster_name | sum by (name) (token_missing_rotate_at_annotation{cluster_name=~"$cluster"}) |
GitOps Operational Status
Operational metrics to indicate Cluster GitOps health
GitOps Status
Shows the status of the GitOps component for each cluster.
| Metric Name | Labels | PromQL Expression |
|---|---|---|
gitops_enabled | N/A | gitops_enabled |
Accepted Admission Requests
Accepted admission requests for each cluster. This is the rate at which operations are processed by the GitOps relay and sent to TSB.
| Metric Name | Labels | PromQL Expression |
|---|---|---|
gitops_admission_count_total | allowed | sum(rate(gitops_admission_count_total{allowed="true"}[1h])) by (cluster_name, component) |
Rejected Admission Requests
Rejected admission requests for each cluster. This is the rate at which operations are processed by the GitOps relay and sent to TSB.
A spike in these metrics may indicate an increase in invalid TSB resources being applied to the Kubernetes clusters, or error in the admission webhook processing.
| Metric Name | Labels | PromQL Expression |
|---|---|---|
gitops_admission_count_total | allowed | sum(rate(gitops_admission_count_total{allowed="false"}[1h])) by (cluster_name, component) |
Admission Review Latency
Admission review latency percentiles grouped by cluster.
The GitOps admission reviews make decisions by forwarding the objects to the Management Plane. This metric helps understand the time it takes to make such decisions.
A spike here may indicate network issues or connectivity issues between the Control Plane and the Management Plane.
| Metric Name | Labels | PromQL Expression |
|---|---|---|
gitops_admission_duration_bucket | N/A | histogram_quantile(0.99, sum(rate(gitops_admission_duration_bucket[1h])) by (cluster_name, component, le)) |
gitops_admission_duration_bucket | N/A | histogram_quantile(0.95, sum(rate(gitops_admission_duration_bucket[1h])) by (cluster_name, component, le)) |
Resources Pushed to TSB
Number of resources pushed to the Management Plane.
This should be equivalent to the admission requests in most cases, but this will also account for object pushes that are done by the background reconcile processes.
| Metric Name | Labels | PromQL Expression |
|---|---|---|
gitops_push_count_total | success | sum(rate(gitops_push_count_total{success="true"}[1h])) by (cluster_name, component) |
Failed pushes to TSB
Number of resource pushes to the Management Plane that failed.
This should be equivalent to the failed admission requests in most cases, but this will also account for object pushes that are done by the background reconciliation processes.
| Metric Name | Labels | PromQL Expression |
|---|---|---|
gitops_push_count_total | code | sum(rate(gitops_push_count_total{code!="OK"}[1h])) by (cluster_name, component, code) |
Resources Conversions
Number of Kubernetes resources that have been read from the cluster and successfully converted into TSB objects to be pushed to the Management plane.
The values for this metric should be the same as the Pushed Objects. If there is a difference between them, it probably means some issue when converting the Kubernetes objects to TSB objects.
| Metric Name | Labels | PromQL Expression |
|---|---|---|
gitops_convert_count_total | success | sum(rate(gitops_convert_count_total{success="true"}[1h])) by (cluster_name, component) |
Resources conversions errors
Number of Kubernetes resources that have been read from the cluster and failed to be converted into TSB objects.
A spike on this metric indicates that the Kubernetes objects could not be converted to TSB objects and that those resources were not sent to the Management Plane.
| Metric Name | Labels | PromQL Expression |
|---|---|---|
gitops_convert_count_total | success | sum(rate(gitops_convert_count_total{success="false"}[1h])) by (cluster_name, component) |
Global Configuration Distribution
These metrics indicate the overall health of Tetrate Service Bridge and should be considered the starting point for any investigation into issues with Tetrate Service Bridge.
Connected Clusters
This details all clusters connected to and receiving configuration from the management plane.
If this number drops below 1 or a given cluster does not appear in this table it means that the cluster is disconnected. This may happen for a brief period of time during upgrades/re-deploys.
| Metric Name | Labels | PromQL Expression |
|---|---|---|
xcp_central_current_edge_connections | N/A | xcp_central_current_edge_connections |
TSB Error Rate (Humans)
Rate of failed requests to the TSB apiserver from the UI and CLI.
| Metric Name | Labels | PromQL Expression |
|---|---|---|
grpc_server_handled_total | component grpc_code grpc_method grpc_type | sum(rate(grpc_server_handled_total{component="tsb", grpc_code!="OK", grpc_type="unary", grpc_method!="SendAuditLog"}[1m])) by (grpc_code) OR on() vector(0) |
Istio-Envoy Sync Time (99th Percentile)
Once XCP has synced with the management plane it creates resources for Istio to configure Envoy. Istio usually distributes these within a second.
If this number starts to exceed 10 seconds then you may need to scale out istiod. In small clusters, it is possible this number is too small to be handled by the histogram buckets so may be nil.
| Metric Name | Labels | PromQL Expression |
|---|---|---|
pilot_proxy_convergence_time_bucket | N/A | histogram_quantile(0.99, sum(rate(pilot_proxy_convergence_time_bucket[1m])) by (le, cluster_name)) |
XCP central -> edge Sync Time (99th Percentile)
MPC component translates TSB configuration into XCP objects. XCP central then sends these objects to every Edge connected to it.
This is the time taken for XCP central to send the configs to edges in ms.
| Metric Name | Labels | PromQL Expression |
|---|---|---|
xcp_central_config_propagation_time_ms_bucket | N/A | histogram_quantile(0.99, sum(rate(xcp_central_config_propagation_time_ms_bucket[1m])) by (le, edge)) |
Istiod Errors
Rate of istiod errors broken down by cluster. This graph helps identify clusters that may be experiencing problems. Typically, there should be no errors. Any non-transient errors should be investigated.
Sometimes this graph will show "No data" or these metrics won't exist. This is because istiod only emits these metrics if the errors occur.
| Metric Name | Labels | PromQL Expression |
|---|---|---|
pilot_total_xds_internal_errors | N/A | sum(rate(pilot_xds_write_timeout[1m])) by (cluster_name) + sum(rate(pilot_total_xds_internal_errors[1m])) by (cluster_name) + sum(rate(pilot_total_xds_rejects[1m])) by (cluster_name) + sum(rate(pilot_xds_expired_nonce[1m])) by (cluster_name) + sum(rate(pilot_xds_push_context_errors[1m])) by (cluster_name) + sum(rate(pilot_xds_pushes{type=~".*_senderr"}[1m])) by (cluster_name) OR on() vector(0) |
pilot_total_xds_rejects | N/A | sum(rate(pilot_xds_write_timeout[1m])) by (cluster_name) + sum(rate(pilot_total_xds_internal_errors[1m])) by (cluster_name) + sum(rate(pilot_total_xds_rejects[1m])) by (cluster_name) + sum(rate(pilot_xds_expired_nonce[1m])) by (cluster_name) + sum(rate(pilot_xds_push_context_errors[1m])) by (cluster_name) + sum(rate(pilot_xds_pushes{type=~".*_senderr"}[1m])) by (cluster_name) OR on() vector(0) |
pilot_xds_expired_nonce | N/A | sum(rate(pilot_xds_write_timeout[1m])) by (cluster_name) + sum(rate(pilot_total_xds_internal_errors[1m])) by (cluster_name) + sum(rate(pilot_total_xds_rejects[1m])) by (cluster_name) + sum(rate(pilot_xds_expired_nonce[1m])) by (cluster_name) + sum(rate(pilot_xds_push_context_errors[1m])) by (cluster_name) + sum(rate(pilot_xds_pushes{type=~".*_senderr"}[1m])) by (cluster_name) OR on() vector(0) |
pilot_xds_push_context_errors | N/A | sum(rate(pilot_xds_write_timeout[1m])) by (cluster_name) + sum(rate(pilot_total_xds_internal_errors[1m])) by (cluster_name) + sum(rate(pilot_total_xds_rejects[1m])) by (cluster_name) + sum(rate(pilot_xds_expired_nonce[1m])) by (cluster_name) + sum(rate(pilot_xds_push_context_errors[1m])) by (cluster_name) + sum(rate(pilot_xds_pushes{type=~".*_senderr"}[1m])) by (cluster_name) OR on() vector(0) |
pilot_xds_pushes | type | sum(rate(pilot_xds_write_timeout[1m])) by (cluster_name) + sum(rate(pilot_total_xds_internal_errors[1m])) by (cluster_name) + sum(rate(pilot_total_xds_rejects[1m])) by (cluster_name) + sum(rate(pilot_xds_expired_nonce[1m])) by (cluster_name) + sum(rate(pilot_xds_push_context_errors[1m])) by (cluster_name) + sum(rate(pilot_xds_pushes{type=~".*_senderr"}[1m])) by (cluster_name) OR on() vector(0) |
pilot_xds_write_timeout | N/A | sum(rate(pilot_xds_write_timeout[1m])) by (cluster_name) + sum(rate(pilot_total_xds_internal_errors[1m])) by (cluster_name) + sum(rate(pilot_total_xds_rejects[1m])) by (cluster_name) + sum(rate(pilot_xds_expired_nonce[1m])) by (cluster_name) + sum(rate(pilot_xds_push_context_errors[1m])) by (cluster_name) + sum(rate(pilot_xds_pushes{type=~".*_senderr"}[1m])) by (cluster_name) OR on() vector(0) |
Istio Operational Status
Operational metrics for istiod health.
Connected Envoys
Count of Envoys connected to istiod. This should represent the total number of endpoints in the selected cluster.
If this number significantly decreases for longer than 5 minutes without an obvious reason (e.g. a scale-down event) then you should investigate. This may indicate that Envoys have been disconnected from istiod and are unable to reconnect.
| Metric Name | Labels | PromQL Expression |
|---|---|---|
pilot_xds | cluster_name istio_revision | sum(pilot_xds{cluster_name="$cluster",istio_revision="$istio_revision"}) |
Total Error Rate
The total error rate for Istio when configuring Envoy, including generation and transport errors.
Any errors (current and historic) should be investigated using the more detailed split below.
| Metric Name | Labels | PromQL Expression |
|---|---|---|
pilot_total_xds_internal_errors | cluster_name istio_revision | sum(rate(pilot_xds_write_timeout{cluster_name="$cluster",istio_revision="$istio_revision"}[1m])) + sum(rate(pilot_total_xds_internal_errors{cluster_name="$cluster",istio_revision="$istio_revision"}[1m])) + sum(rate(pilot_total_xds_rejects{cluster_name="$cluster",istio_revision="$istio_revision"}[1m])) + sum(rate(pilot_xds_expired_nonce{cluster_name="$cluster",istio_revision="$istio_revision"}[1m])) + sum(rate(pilot_xds_push_context_errors{cluster_name="$cluster",istio_revision="$istio_revision"}[1m])) + sum(rate(pilot_xds_pushes{cluster_name="$cluster",istio_revision="$istio_revision",type=~".*_senderr"}[1m])) OR on() vector(0) |
pilot_total_xds_rejects | cluster_name istio_revision | sum(rate(pilot_xds_write_timeout{cluster_name="$cluster",istio_revision="$istio_revision"}[1m])) + sum(rate(pilot_total_xds_internal_errors{cluster_name="$cluster",istio_revision="$istio_revision"}[1m])) + sum(rate(pilot_total_xds_rejects{cluster_name="$cluster",istio_revision="$istio_revision"}[1m])) + sum(rate(pilot_xds_expired_nonce{cluster_name="$cluster",istio_revision="$istio_revision"}[1m])) + sum(rate(pilot_xds_push_context_errors{cluster_name="$cluster",istio_revision="$istio_revision"}[1m])) + sum(rate(pilot_xds_pushes{cluster_name="$cluster",istio_revision="$istio_revision",type=~".*_senderr"}[1m])) OR on() vector(0) |
pilot_xds_expired_nonce | cluster_name istio_revision | sum(rate(pilot_xds_write_timeout{cluster_name="$cluster",istio_revision="$istio_revision"}[1m])) + sum(rate(pilot_total_xds_internal_errors{cluster_name="$cluster",istio_revision="$istio_revision"}[1m])) + sum(rate(pilot_total_xds_rejects{cluster_name="$cluster",istio_revision="$istio_revision"}[1m])) + sum(rate(pilot_xds_expired_nonce{cluster_name="$cluster",istio_revision="$istio_revision"}[1m])) + sum(rate(pilot_xds_push_context_errors{cluster_name="$cluster",istio_revision="$istio_revision"}[1m])) + sum(rate(pilot_xds_pushes{cluster_name="$cluster",istio_revision="$istio_revision",type=~".*_senderr"}[1m])) OR on() vector(0) |
pilot_xds_push_context_errors | cluster_name istio_revision | sum(rate(pilot_xds_write_timeout{cluster_name="$cluster",istio_revision="$istio_revision"}[1m])) + sum(rate(pilot_total_xds_internal_errors{cluster_name="$cluster",istio_revision="$istio_revision"}[1m])) + sum(rate(pilot_total_xds_rejects{cluster_name="$cluster",istio_revision="$istio_revision"}[1m])) + sum(rate(pilot_xds_expired_nonce{cluster_name="$cluster",istio_revision="$istio_revision"}[1m])) + sum(rate(pilot_xds_push_context_errors{cluster_name="$cluster",istio_revision="$istio_revision"}[1m])) + sum(rate(pilot_xds_pushes{cluster_name="$cluster",istio_revision="$istio_revision",type=~".*_senderr"}[1m])) OR on() vector(0) |
pilot_xds_pushes | cluster_name istio_revision type | sum(rate(pilot_xds_write_timeout{cluster_name="$cluster",istio_revision="$istio_revision"}[1m])) + sum(rate(pilot_total_xds_internal_errors{cluster_name="$cluster",istio_revision="$istio_revision"}[1m])) + sum(rate(pilot_total_xds_rejects{cluster_name="$cluster",istio_revision="$istio_revision"}[1m])) + sum(rate(pilot_xds_expired_nonce{cluster_name="$cluster",istio_revision="$istio_revision"}[1m])) + sum(rate(pilot_xds_push_context_errors{cluster_name="$cluster",istio_revision="$istio_revision"}[1m])) + sum(rate(pilot_xds_pushes{cluster_name="$cluster",istio_revision="$istio_revision",type=~".*_senderr"}[1m])) OR on() vector(0) |
pilot_xds_write_timeout | cluster_name istio_revision | sum(rate(pilot_xds_write_timeout{cluster_name="$cluster",istio_revision="$istio_revision"}[1m])) + sum(rate(pilot_total_xds_internal_errors{cluster_name="$cluster",istio_revision="$istio_revision"}[1m])) + sum(rate(pilot_total_xds_rejects{cluster_name="$cluster",istio_revision="$istio_revision"}[1m])) + sum(rate(pilot_xds_expired_nonce{cluster_name="$cluster",istio_revision="$istio_revision"}[1m])) + sum(rate(pilot_xds_push_context_errors{cluster_name="$cluster",istio_revision="$istio_revision"}[1m])) + sum(rate(pilot_xds_pushes{cluster_name="$cluster",istio_revision="$istio_revision",type=~".*_senderr"}[1m])) OR on() vector(0) |
Median Proxy Convergence Time
The median (50th percentile) delay between istiod receiving configuration changes and the proxy receiving all required configuration in the selected cluster. This number indicates how stale the proxy configuration is. As this number increases, it may start to impact application traffic.
This number is typically in the hundreds of milliseconds. In small clusters, this number may be zero.
If this number creeps up to 30s for an extended period, istiod likely needs to be scaled out (or up).
| Metric Name | Labels | PromQL Expression |
|---|---|---|
pilot_proxy_convergence_time_bucket | cluster_name istio_revision | histogram_quantile(0.5, sum(rate(pilot_proxy_convergence_time_bucket{cluster_name="$cluster",istio_revision="$istio_revision"}[1m])) by (le)) |
Time to Root CA expiration
Time remaining until expiration of the Istiod root CA (displayed as 'days hours:minutes:seconds'). The value will turn yellow (warning) when the time to expiration is less than 6 month, and will turn red (critical) when it expires in less than a month.
| Metric Name | Labels | PromQL Expression |
|---|---|---|
citadel_server_root_cert_expiry_timestamp | cluster_name istio_revision | citadel_server_root_cert_expiry_timestamp{cluster_name="$cluster",istio_revision="$istio_revision"} - time() |
Time to cert chain expiration
Time remaining until expiration of the Istiod certificate chain (the certificates istiod uses to sign workload certificates). The value will turn yellow (warning) when the time to expiration is less than 6 month, and will turn red (critical) when it expires in less than a month.
If this shows no value, it means your istiod instances are using a self-signed certificate or a root CA certificate to issue workload certificates, instead of using an intermediate CA. If that is the case, this panel is meaningless to you, but you should consider using an intermediate CA for your istio control planes.
| Metric Name | Labels | PromQL Expression |
|---|---|---|
citadel_server_cert_chain_expiry_timestamp | cluster_name istio_revision | citadel_server_cert_chain_expiry_timestamp{cluster_name="$cluster",istio_revision="$istio_revision"} - time() |
Applied Envoy Filters
Number of successfully applied Envoy Filters in the cluster.
| Metric Name | Labels | PromQL Expression |
|---|---|---|
pilot_envoy_filter_status | cluster_name istio_revision result | sum(pilot_envoy_filter_status{cluster_name="$cluster",istio_revision="$istio_revision",result="applied"}) |
Errored Envoy Filters
Number of Envoy Filters in the cluster that failed to apply.
| Metric Name | Labels | PromQL Expression |
|---|---|---|
pilot_envoy_filter_status | cluster_name istio_revision result | sum(pilot_envoy_filter_status{cluster_name="$cluster",istio_revision="$istio_revision",result="error"}) |
Envoy Filter status
Status of each Envoy Filter in the cluster (applied/error).
| Metric Name | Labels | PromQL Expression |
|---|---|---|
pilot_envoy_filter_status | cluster_name istio_revision | pilot_envoy_filter_status{cluster_name="$cluster",istio_revision="$istio_revision"} |
Istiod Push Rate
The rate of istiod pushes to Envoy grouped by discovery service. Istiod pushes clusters (CDS), endpoints (EDS), listeners (LDS) or routes (RDS) any time it receives a configuration change.
Changes are triggered by a user interacting with TSB or a change in infrastructure such as a new endpoint (service instance/pod) creation.
In small relatively static clusters these values can be zero most of the time.
| Metric Name | Labels | PromQL Expression |
|---|---|---|
pilot_xds_pushes | cluster_name istio_revision type | sum(irate(pilot_xds_pushes{cluster_name="$cluster",istio_revision="$istio_revision",type=~"cds|eds|rds|lds"}[1m])) by (type) |
Istiod Error Rate
The different error rates for Istio during general operations. Including the generation and distribution of Envoy configuration.
pilot_xds_write_timeout
Rate of connection timeouts between Envoy and istiod. This number indicates that an Envoy has taken too long to acknowledge a configuration change from Istio. An increase in these errors typically indicates network issues, envoy resource limits or istiod resource limits (usually cpu)
pilot_total_xds_internal_errors
Rate of errors thrown inside istiod whilst generating Envoy configuration. Check the istiod logs for more details if you see internal errors.
pilot_total_xds_rejects
Rate of rejected configuration from Envoy. Istio should never produce any invalid Envoy configuration so any errors here warrants investigation, starting with the istiod logs.
pilot_xds_expired_nonce
Rate of expired nonces from Envoys. This number indicates that an Envoy has responded to the wrong request sent from Istio. An increase in these errors typically indicates network issues (saturation or partition), Envoy resource limits or istiod resource limits (usually cpu).
pilot_xds_push_context_errors
Rate of errors setting a connection with an Envoy instance. An increase in these errors typically indicates network issues (saturation or partition), Envoy resource limits or istiod resource limits (usually cpu). Check istiod logs for further details.
pilot_xds_pushes
Rate of transport errors sending configuration to Envoy. An increase in these errors typically indicates network issues (saturation or partition), Envoy resource limits or istiod resource limits (usually cpu).
| Metric Name | Labels | PromQL Expression |
|---|---|---|
pilot_total_xds_internal_errors | cluster_name istio_revision | sum(rate(pilot_total_xds_internal_errors{cluster_name="$cluster",istio_revision="$istio_revision"}[1m])) |
pilot_total_xds_rejects | cluster_name istio_revision | sum(rate(pilot_total_xds_rejects{cluster_name="$cluster",istio_revision="$istio_revision"}[1m])) |
pilot_xds_expired_nonce | cluster_name istio_revision | sum(rate(pilot_xds_expired_nonce{cluster_name="$cluster",istio_revision="$istio_revision"}[1m])) |
pilot_xds_push_context_errors | cluster_name istio_revision | sum(rate(pilot_xds_push_context_errors{cluster_name="$cluster",istio_revision="$istio_revision"}[1m])) |
pilot_xds_pushes | cluster_name istio_revision type | sum(rate(pilot_xds_pushes{cluster_name="$cluster",istio_revision="$istio_revision",type=~".*_senderr"}[1m])) by (type) |
pilot_xds_write_timeout | cluster_name istio_revision | sum(rate(pilot_xds_write_timeout{cluster_name="$cluster",istio_revision="$istio_revision"}[1m])) |
Proxy Convergence Time
The delay between an istiod receiving configuration changes and a proxy receiving all required configuration in the cluster. Broken down by percentiles.
This number indicates how stale the proxy configuration is. As this number increases it may start to affect application traffic.
This number is typically in the hundreds of milliseconds. If this number creeps up to 30s for an extended period of time, it is likely that istiod needs to be scaled out (or up) as it is likely pinned up against its CPU limits.
| Metric Name | Labels | PromQL Expression |
|---|---|---|
pilot_proxy_convergence_time_bucket | cluster_name istio_revision | histogram_quantile(0.5, sum(rate(pilot_proxy_convergence_time_bucket{cluster_name="$cluster",istio_revision="$istio_revision"}[1m])) by (le)) |
pilot_proxy_convergence_time_bucket | cluster_name istio_revision | histogram_quantile(0.90, sum(rate(pilot_proxy_convergence_time_bucket{cluster_name="$cluster",istio_revision="$istio_revision"}[1m])) by (le)) |
pilot_proxy_convergence_time_bucket | cluster_name istio_revision | histogram_quantile(0.99, sum(rate(pilot_proxy_convergence_time_bucket{cluster_name="$cluster",istio_revision="$istio_revision"}[1m])) by (le)) |
pilot_proxy_convergence_time_bucket | cluster_name | histogram_quantile(0.999, sum(rate(pilot_proxy_convergence_time_bucket{cluster_name="$cluster"}[1m])) by (le)) |
Configuration Validation
Success and failure rate of istio configuration validation requests. This is triggered when TSB configuration is created or updated.
Any failures here should be investigated in the istiod and edge logs.
If there are TSB configuration changes being made that affect the selected cluster and the success number is zero then there is an issue with configuration propagation. Check the XCP edge logs to debug further.
| Metric Name | Labels | PromQL Expression |
|---|---|---|
galley_validation_failed | cluster_name | sum(rate(galley_validation_failed{cluster_name="$cluster"}[1m])) |
galley_validation_passed | cluster_name istio_revision | sum(rate(galley_validation_passed{cluster_name="$cluster",istio_revision="$istio_revision"}[1m])) |
Sidecar Injection
Rate of sidecar injection requests. Sidecar injection is triggered whenever a new instance/pod is created.
Any errors displayed here should be investigated further by checking the istiod logs.
| Metric Name | Labels | PromQL Expression |
|---|---|---|
sidecar_injection_failure_total | cluster_name | sum(rate(sidecar_injection_failure_total{cluster_name="$cluster"}[1m])) |
sidecar_injection_success_total | cluster_name istio_revision | sum(rate(sidecar_injection_success_total{cluster_name="$cluster",istio_revision="$istio_revision"}[1m])) |
MPC Operational Status
Operational metrics to indicate Management Plane Controller (MPC) health.
Get All Config Objects duration
How long does it take to execute the GetAllConfigObjects grpc method to retrieve all the configuration objects. If you want to know the error cause take a look at the grpc charts that contain the status response codes.
| Metric Name | Labels | PromQL Expression |
|---|---|---|
mpc_get_all_config_objects_time | component error | sum(max_over_time(mpc_get_all_config_objects_time{error="", component="mpc"}[5m])) by (component) |
mpc_get_all_config_objects_time | component error | sum(max_over_time(mpc_get_all_config_objects_time{error="true", component="mpc"}[5m])) by (component) |
Received configs
The number of resources that sent from TSB to MPC.
This metric shows the number of objects that are created, updated, and deleted as part of a configuration push from MPC to XCP.
This metric can be used together with the XCP push operations and push duration to get an understanding of how the amount of resources being pushed to XCP affects the time it takes for the entire configuration push operation to complete.
| Metric Name | Labels | PromQL Expression |
|---|---|---|
mpc_tsb_config_received_count | component resource | sum(max_over_time(mpc_tsb_config_received_count{resource="", component="mpc"}[5m])) by(component) |
Config Processing duration
Time it takes to process an entire config set. It shows the details about the amount of time spent pre-processing the configurations, converting them to XCP, and pushing them to the k8s cluster
| Metric Name | Labels | PromQL Expression |
|---|---|---|
mpc_config_conversion_time | component error | sum(max_over_time(mpc_config_conversion_time{error="", component="mpc"}[5m])) by (component) |
mpc_config_pre_process_time | component error | sum(max_over_time(mpc_config_pre_process_time{error="", component="mpc"}[5m])) by (component) |
mpc_config_total_process_time | component error | sum(max_over_time(mpc_config_total_process_time{error="", component="mpc"}[5m])) by (component) |
mpc_xcp_config_push_time | component error | sum(max_over_time(mpc_xcp_config_push_time{error="", component="mpc"}[5m])) by (component) |
Received configs by type
Configuration updates received from TSB are processed by MPC and translated into XCP resources. This metric shows the number of objects of each type MPC will convert.
| Metric Name | Labels | PromQL Expression |
|---|---|---|
mpc_tsb_config_received_count | component resource | sum(max_over_time(mpc_tsb_config_received_count{resource!="", component="mpc"}[5m])) by(component, resource) |
Total Conversion Time by Type every 5m
Time it takes to convert TSB resources to the XCP APIs.
| Metric Name | Labels | PromQL Expression |
|---|---|---|
mpc_xcp_conversion_duration_sum | component | sum(rate(mpc_xcp_conversion_duration_sum{component="mpc"}[5m])) by (resource) |
Conversion Time by Type every 5m
Time it takes to convert TSB resources to the XCP APIs.
| Metric Name | Labels | PromQL Expression |
|---|---|---|
mpc_xcp_conversion_duration_bucket | N/A | histogram_quantile(0.99, sum(rate(mpc_xcp_conversion_duration_bucket[5m])) by (le, resource)) |
Conversions by Resource every 5m
Conversions by resource executed in a time period. This can be used to understand the throughput of the MPC conversions.
| Metric Name | Labels | PromQL Expression |
|---|---|---|
mpc_xcp_conversion_duration_count | component resource | sum(increase(mpc_xcp_conversion_duration_count{resource!="", component="mpc"}[5m])) by (resource) |
Conversions Invalidations by Resource every 5m
Conversions Invalidations by resource executed in a time period. This can be used to understand the throughput of the MPC conversions.
| Metric Name | Labels | PromQL Expression |
|---|---|---|
mpc_xcp_conversion_invalidation_duration_count | component resource | sum(increase(mpc_xcp_conversion_invalidation_duration_count{component="mpc", resource!=""}[5m])) by (resource) |
Conversion Invalidation Time every 5m
Time it takes to invalidate TSB resources for a given conversion to the XCP APIs.
| Metric Name | Labels | PromQL Expression |
|---|---|---|
mpc_xcp_conversion_invalidation_duration_bucket | component resource | histogram_quantile(0.99, sum(rate(mpc_xcp_conversion_invalidation_duration_bucket{component="mpc", resource!=""}[5m])) by (le, resource)) |
Updates from TSB every 5m
Configuration and onboarded cluster messages received from TSB.
The number of update messages may increase or decrease based on the time it takes for MPC to fully process the messages. The more time it takes to process, the less frequent config updates will be retrieved.
| Metric Name | Labels | PromQL Expression |
|---|---|---|
grpc_client_handled_total | component grpc_code grpc_method | sum(increase(grpc_client_handled_total{component="mpc", grpc_method="GetAllConfigObjects", grpc_code="OK"}[5m])) or on() vector(0) |
grpc_client_handled_total | component grpc_code grpc_method | sum(increase(grpc_client_handled_total{component="mpc", grpc_method="GetAllClusters", grpc_code="OK"}[5m])) or on() vector(0) |
grpc_client_handled_total | component grpc_code grpc_method | sum(increase(grpc_client_handled_total{component="mpc", grpc_method="GetAllConfigObjects", grpc_code!="OK"}[5m])) or on() vector(0) |
grpc_client_handled_total | component grpc_code grpc_method | sum(increase(grpc_client_handled_total{component="mpc", grpc_method="GetAllClusters", grpc_code!="OK"}[5m])) or on() vector(0) |
MPC to XCP pushed configs
The number of resources that are pushed to XCP.
This metric shows the number of objects that are created, updated, and deleted as part of a configuration push from MPC to XCP. It also shows how many fetch calls to the k8s api server are done.
This metric can be used together with the TSB tp MPC sent configs and XCP push operations and push duration to get an understanding of how the amount of resources being pushed to XCP affects the time it takes for the entire configuration push operation to complete.
| Metric Name | Labels | PromQL Expression |
|---|---|---|
mpc_xcp_config_create_ops | component | sum(mpc_xcp_config_create_ops{component="mpc"}) |
mpc_xcp_config_delete_ops | component | sum(mpc_xcp_config_delete_ops{component="mpc"}) |
mpc_xcp_config_fetch_ops | component | sum(mpc_xcp_config_fetch_ops{component="mpc"}) |
mpc_xcp_config_update_ops | component | sum(mpc_xcp_config_update_ops{component="mpc"}) |
MCP to XCP pushed configs error
The number of resources that failed while pushing to XCP.
This metric shows the number of objects that fail when they are tried to be created, updated, and deleted as part of a configuration push from MPC to XCP. It also shows the number of failed fetch calls to the k8s api server.
This metric can be used together with the MPC to TSB push configs and the XCP push operations and push duration to get an understanding of how the amount of resources being pushed to XCP affects the time it takes for the entire configuration push operation to complete.
| Metric Name | Labels | PromQL Expression |
|---|---|---|
mpc_xcp_config_create_ops_err | component | sum(mpc_xcp_config_create_ops_err{component="mpc"}) |
mpc_xcp_config_delete_ops_err | component | sum(mpc_xcp_config_delete_ops_err{component="mpc"}) |
mpc_xcp_config_fetch_ops_err | component | sum(mpc_xcp_config_fetch_ops_err{component="mpc"}) |
mpc_xcp_config_update_ops_err | component | sum(mpc_xcp_config_update_ops_err{component="mpc"}) |
Config Status updates every 5m
Config Status update messages sent over the gRPC streams, from XCP to MPC to XCP.
This metric can help understand how messages are queued in TSB when it is under load. The value for both metrics should always be the same. If the Received by TSB metric has a value lower than the MPC one, it means TSB is under load and cannot process all messages sent by MPC as fast as MPC is sending them.
| Metric Name | Labels | PromQL Expression |
|---|---|---|
grpc_client_msg_received_total | component grpc_method | sum(increase(grpc_client_msg_received_total{grpc_method="Report",component="mpc"}[5m])) or on() vector(0) |
grpc_client_msg_sent_total | component grpc_method | sum(increase(grpc_client_msg_sent_total{grpc_method="PushStatus",component="mpc"}[5m])) or on() vector(0) |
grpc_server_msg_received_total | component grpc_method | sum(increase(grpc_server_msg_received_total{grpc_method="PushStatus", component="tsb"}[5m])) or on() vector(0) |
Config Status updates processed every 5m
This is the number of config status updates that are processed by the Management Plane Controller (MPC), that are received from XCP and to be sent to TSB.
There are two gRPC streams, one that connects XCP to MPC and another one that connects MPC to TSB.
| Metric Name | Labels | PromQL Expression |
|---|---|---|
permanent_stream_operation_total | component error name | sum(increase(permanent_stream_operation_total{name="StatusPush", error="", component="mpc"}[5m])) or on() vector(0) |
permanent_stream_operation_total | component error name | sum(increase(permanent_stream_operation_total{name="StatusPull", error="", component="mpc"}[5m])) or on() vector(0) |
permanent_stream_operation_total | component error name | sum(increase(permanent_stream_operation_total{name="StatusPush", error!="", component="mpc"}[5m])) or on() vector(0) |
permanent_stream_operation_total | component error name | sum(increase(permanent_stream_operation_total{name="StatusPull", error!="", component="mpc"}[5m])) or on() vector(0) |
Config Status stream connection attempts every 5m
The number of connection (and reconnection) attempts on the config status updates streams. MPC sends the config status updates over a permanently connected gRPC stream to TSB. At the same time, XCP sends them to MPC. This metric shows the number of connections and reconnections that happened on each stream.
| Metric Name | Labels | PromQL Expression |
|---|---|---|
permanent_stream_connection_attempts_total | error name | sum(increase(permanent_stream_connection_attempts_total{name="StatusPull", error="" }[5m])) or on() vector(0) |
permanent_stream_connection_attempts_total | error name | sum(increase(permanent_stream_connection_attempts_total{name="StatusPull", error!="" }[5m])) or on() vector(0) |
permanent_stream_connection_attempts_total | error name | sum(increase(permanent_stream_connection_attempts_total{name="StatusPush", error="" }[5m])) or on() vector(0) |
permanent_stream_connection_attempts_total | error name | sum(increase(permanent_stream_connection_attempts_total{name="StatusPush", error!="" }[5m])) or on() vector(0) |
TSB Handled Status Reports 5m
Number of config status reports handled by TSB. Each received config status report is either handled or skipped.
- Handled: Process and store the status report directly, or if --max-status-report-workers is > 1, enqueued for async processing.
- Skipped: For duplicated status reports.
| Metric Name | Labels | PromQL Expression |
|---|---|---|
config_handling_duration_count | component | sum(increase(config_handling_duration_count{component="tsb"}[5m])) by(skip) |
Config status cache operations every 5m
Number of operations done in the config status cache when receiving new config statuses.
| Metric Name | Labels | PromQL Expression |
|---|---|---|
config_status_cache_add_total | error | sum(increase(config_status_cache_add_total{error="false"}[5m])) |
config_status_cache_add_total | error | sum(increase(config_status_cache_add_total{error="true"}[5m])) or on() vector(0) |
config_status_cache_check_total | N/A | sum(increase(config_status_cache_check_total[5m])) |
config_status_cache_check_total | error | sum(increase(config_status_cache_check_total{error="true"}[5m])) or on() vector(0) |
config_status_cache_invalidate_total | N/A | sum(increase(config_status_cache_invalidate_total[5m])) |
grpc_server_msg_received_total | component grpc_method | sum(increase(grpc_server_msg_received_total{grpc_method="PushStatus", component="tsb"}[5m])) |
TSB Processed Status Reports in 5m
The number of config status reports processed by TSB. This number must be the same as the number of handled ones without the skipped ones.
| Metric Name | Labels | PromQL Expression |
|---|---|---|
config_status_report_work_duration_bucket | component | histogram_quantile(0.99, sum(rate(config_status_report_work_duration_bucket{component="tsb"}[5m])) by (le, skip)) |
TSB Handling Status Reports Duration 5m
The P99 duration in milliseconds of handling a received status reports handled by TSB. Each received config status report is either handled or skipped.
- Handled: Process and store the status report directly, or if --max-status-report-workers is > 1, enqueued for async processing.
- Skipped: For duplicated status reports.
| Metric Name | Labels | PromQL Expression |
|---|---|---|
config_handling_duration_bucket | component | histogram_quantile(0.99, sum(rate(config_handling_duration_bucket{component="tsb"}[5m])) by (le, skip)) |
Config status cache operations by event type every 5m
Number of operations done in the cache by event type.
This metric helps understand the amount of event processing that can be skipped on the TSB side when receiving events because TSB already knows about them, and help understand how status event reporting relates to load on the TSB side.
| Metric Name | Labels | PromQL Expression |
|---|---|---|
config_status_cache_add_total | component error | sum(increase(config_status_cache_add_total{error="false", component="tsb"}[5m])) by (type) |
config_status_cache_check_total | component error | sum(increase(config_status_cache_check_total{error="false", component="tsb"}[5m])) by (type) |
TSB Processing Status Reports Duration 5m
The P99 duration in milliseconds of processing config status reports handled by TSB. Processing of a config status report involves analyse, apply/storing the result, propagate to parents and dependants.
| Metric Name | Labels | PromQL Expression |
|---|---|---|
config_status_report_work_duration_bucket | component | histogram_quantile(0.99, sum(rate(config_status_report_work_duration_bucket{component="tsb"}[5m])) by (le, skip)) |
Status Reports Work per Shard Distribution
Only applies when tsb --max-status-report-workers is > 1. Distribution of the status report work across the different shards.
| Metric Name | Labels | PromQL Expression |
|---|---|---|
sharded_queue_work_duration_count | component name | sum(increase(sharded_queue_work_duration_count{name="status-reports", component="tsb"}[5m])) by (component, shard) |
Work executions every 5m
Only applies when tsb --max-status-report-workers is > 1. Amount of status processing jobs processed
| Metric Name | Labels | PromQL Expression |
|---|---|---|
sharded_queue_work_duration_count | component | sum(increase(sharded_queue_work_duration_count{component="tsb"}[5m])) by (name) |
Status updates worker time every 5m
Only applies when tsb --max-status-report-workers is > 1. Time it takes for workers to process a single status update event.
| Metric Name | Labels | PromQL Expression |
|---|---|---|
sharded_queue_work_duration_bucket | N/A | histogram_quantile(0.99, sum(rate(sharded_queue_work_duration_bucket[5m])) by (le, name)) |
TSB Status Updates Enqueue Delay 5m
Only applies when tsb --max-status-report-workers is > 1. The P99 delay is milliseconds since a config status report started the enqueuing until the queue accepted(enqueued) the config status report.
If the P99 delay goes high it means that that a shard of the queue is filled up reaching its max capacity. If it goes over minutes, it means that there is deadlock probably.
| Metric Name | Labels | PromQL Expression |
|---|---|---|
sharded_queue_enqueue_delay_bucket | name | histogram_quantile(0.99, sum(rate(sharded_queue_enqueue_delay_bucket{name="status-reports"}[5m])) by (le, name)) |
TSB Status Updates Enqueue Delay 5m
Only applies when tsb --max-status-report-workers is > 1. The delay is milliseconds since a config status report started the enqueuing until the queue accepted(enqueued) the config status report.
The config status report queue has a fixed size of element in can't hold per bucket. If the enqueuing latency goes up, it means that there is contention in the queue and more elements cannot be placed until the queue releases spaces by consuming its enqueued elements.
| Metric Name | Labels | PromQL Expression |
|---|---|---|
sharded_queue_enqueue_delay_bucket | name | sum(rate(sharded_queue_enqueue_delay_bucket{name="status-reports"}[5m])) by (le) |
TSB Status Updates Worker Delay 5m
Only applies when tsb --max-status-report-workers is > 1. The delay is milliseconds since a config status report is received and processed by the work queue.
| Metric Name | Labels | PromQL Expression |
|---|---|---|
sharded_queue_work_delay_bucket | name | histogram_quantile(0.99, sum(rate(sharded_queue_work_delay_bucket{name="status-reports"}[5m])) by (le, name)) |
TSB Status Updates Worker Delay 5m
Only applies when tsb --max-status-report-workers is > 1. The delay is milliseconds since a config status report is received and processed by the work queue.
| Metric Name | Labels | PromQL Expression |
|---|---|---|
sharded_queue_work_delay_bucket | name | sum(rate(sharded_queue_work_delay_bucket{name="status-reports"}[5m])) by (le) |
Cluster Status Update from XCP every 5m
Cluster status update messages received from XCP over a gRPC stream.
| Metric Name | Labels | PromQL Expression |
|---|---|---|
grpc_client_msg_received_total | component grpc_method | sum(increase(grpc_client_msg_received_total{component="mpc", grpc_method="GetClusterState" }[5m])) or on() vector(0) |
Cluster updates from XCP processed every 5m
The number of cluster status updates received by the Management Plane Controller (MPC) from XCP that must be processed and sent to TSB.
XCP sends the cluster status updates (e.g. services deployed in the cluster) over a permanently connected gRPC stream to MPC. This metric shows the number of messages received and processed by MPC on that stream.
| Metric Name | Labels | PromQL Expression |
|---|---|---|
permanent_stream_operation_total | error name | sum(increase(permanent_stream_operation_total{name="ClusterStateFromXCP", error="" }[5m])) or on() vector(0) |
permanent_stream_operation_total | error name | sum(increase(permanent_stream_operation_total{name="ClusterStateFromXCP", error!="" }[5m])) or on() vector(0) |
XCP cluster status updates Sent to TSB every 5m
This is the number of cluster status updates that are processed by the Management Plane Controller (MPC) to be sent to TSB.
MPC sends the cluster status updates over a gRPC stream that is permanently connected to TSB, and this metric shows the number of cluster updates that are processed by MPC and sent to TSB on that stream.
| Metric Name | Labels | PromQL Expression |
|---|---|---|
permanent_stream_operation_total | error name | sum(increase(permanent_stream_operation_total{name="ClusterUpdates", error=""}[5m])) or on() vector(0) |
permanent_stream_operation_total | error name | sum(increase(permanent_stream_operation_total{name="ClusterUpdates", error!=""}[5m])) or on() vector(0) |
Cluster status updates to TSB stream connection attempts every 5m
The number of connection (and reconnection) attempts on the cluster status updates stream. MPC sends the cluster status updates over a permanently connected gRPC stream to TSB. This metric shows the number of connections and reconnections that happened on that stream.
| Metric Name | Labels | PromQL Expression |
|---|---|---|
permanent_stream_connection_attempts_total | error name | sum(increase(permanent_stream_connection_attempts_total{name="ClusterUpdates", error=""}[5m])) or on() vector(0) |
permanent_stream_connection_attempts_total | error name | sum(increase(permanent_stream_connection_attempts_total{name="ClusterUpdates", error!=""}[5m])) or on() vector(0) |
Cluster updates from XCP stream connection attempts every 5m
The number of connection (and reconnection) attempts on the cluster status updates from XCP stream. XCP sends the cluster status updates over a permanently connected gRPC stream to MPC. This metric shows the number of connections and reconnections that happened on that stream.
| Metric Name | Labels | PromQL Expression |
|---|---|---|
permanent_stream_connection_attempts_total | error name | sum(increase(permanent_stream_connection_attempts_total{name="ClusterStateFromXCP", error="" }[5m])) or on() vector(0) |
permanent_stream_connection_attempts_total | error name | sum(increase(permanent_stream_connection_attempts_total{name="ClusterStateFromXCP", error!="" }[5m])) or on() vector(0) |
GC Count by Component in Management Plane
| Metric Name | Labels | PromQL Expression |
|---|---|---|
go_gc_duration_seconds_count | component plane | sum(rate(go_gc_duration_seconds_count{component=~"tsb|mpc|xcp", plane="management"}[5m])) by (component) |
GC Duration by Component in Management Plane
| Metric Name | Labels | PromQL Expression |
|---|---|---|
go_gc_duration_seconds_count | component plane | sum(rate(go_gc_duration_seconds_sum{component= |
go_gc_duration_seconds_sum | component plane | sum(rate(go_gc_duration_seconds_sum{component= |
Heap Allocations by Component in Management Plane
| Metric Name | Labels | PromQL Expression |
|---|---|---|
go_memstats_heap_alloc_bytes | component plane | sum(max_over_time(go_memstats_heap_alloc_bytes{component=~"tsb|mpc|xcp", plane="management"}[5m])) by (component) |
Heap Objects by Component in Management Plane
| Metric Name | Labels | PromQL Expression |
|---|---|---|
go_memstats_heap_objects | component plane | sum(max_over_time(go_memstats_heap_objects{component=~"tsb|mpc|xcp", plane="management"}[5m])) by (component) |
Next GC Target by Component in Management Plane
The heap memory size during the next GC cycle. GC is used to guarantee that the value is no less than the value of
| Metric Name | Labels | PromQL Expression |
|---|---|---|
go_memstats_next_gc_bytes | component plane | sum(max_over_time(go_memstats_next_gc_bytes{component=~"tsb|mpc|xcp", plane="management"}[5m])) by (component) |
Heap Utilization Percentage by Component in Management Plane
| Metric Name | Labels | PromQL Expression |
|---|---|---|
go_memstats_heap_idle_bytes | component | ( sum(go_memstats_heap_inuse_bytes{component="xcp"}) by (component) / sum(go_memstats_heap_idle_bytes{component="xcp"} + go_memstats_heap_inuse_bytes{component="xcp"}) by (component) ) * 100 |
go_memstats_heap_idle_bytes | component | ( sum(go_memstats_heap_inuse_bytes{component="tsb"}) by (component) / sum(go_memstats_heap_idle_bytes{component="tsb"} + go_memstats_heap_inuse_bytes{component="tsb"}) by (component) ) * 100 |
go_memstats_heap_idle_bytes | component | ( sum(go_memstats_heap_inuse_bytes{component="mpc"}) by (component) / sum(go_memstats_heap_idle_bytes{component="mpc"} + go_memstats_heap_inuse_bytes{component="mpc"}) by (component) ) * 100 |
go_memstats_heap_inuse_bytes | component | ( sum(go_memstats_heap_inuse_bytes{component="xcp"}) by (component) / sum(go_memstats_heap_idle_bytes{component="xcp"} + go_memstats_heap_inuse_bytes{component="xcp"}) by (component) ) * 100 |
go_memstats_heap_inuse_bytes | component | ( sum(go_memstats_heap_inuse_bytes{component="tsb"}) by (component) / sum(go_memstats_heap_idle_bytes{component="tsb"} + go_memstats_heap_inuse_bytes{component="tsb"}) by (component) ) * 100 |
go_memstats_heap_inuse_bytes | component | ( sum(go_memstats_heap_inuse_bytes{component="mpc"}) by (component) / sum(go_memstats_heap_idle_bytes{component="mpc"} + go_memstats_heap_inuse_bytes{component="mpc"}) by (component) ) * 100 |
GC CPU Fraction by Component in Management Plane
| Metric Name | Labels | PromQL Expression |
|---|---|---|
go_gc_duration_seconds_sum | component plane | sum( rate(go_gc_duration_seconds_sum{component= |
process_cpu_seconds_total | component plane | sum( rate(go_gc_duration_seconds_sum{component= |
Goroutines by Component in Management Plane
| Metric Name | Labels | PromQL Expression |
|---|---|---|
go_goroutines | component plane | sum(max_over_time(go_goroutines{component=~"tsb|mpc|xcp", plane="management"}[5m])) by (component) |
Heap Sys by Component in Management Plane
| Metric Name | Labels | PromQL Expression |
|---|---|---|
go_memstats_heap_sys_bytes | component plane | sum(max_over_time(go_memstats_heap_sys_bytes{component=~"tsb|mpc|xcp", plane="management"}[5m])) by (component) |
gRPC Server Calls Started Rate
The rate of RPCs started on the server.
| Metric Name | Labels | PromQL Expression |
|---|---|---|
grpc_server_started_total | component grpc_method | sum(rate(grpc_server_started_total{component="tsb", grpc_method=~"GetAllClusters|UpdateClusterState|GetAllConfigObjects"}[5m])) by (grpc_method, component) |
gRPC Server Handled Rate
The rate of RPCs completed on the server.
| Metric Name | Labels | PromQL Expression |
|---|---|---|
grpc_server_handled_total | component grpc_method | sum(rate(grpc_server_handled_total{component="tsb", grpc_method=~"GetAllClusters|UpdateClusterState|GetAllConfigObjects"}[5m])) by (grpc_method, component) |
gRPC Client Calls Started Rate
The rate of the RPCs started on the client.
| Metric Name | Labels | PromQL Expression |
|---|---|---|
grpc_client_started_total | component | sum(rate(grpc_client_started_total{component="mpc"}[5m])) by (grpc_method, component) |
gRPC Client Handled Rate
The rate of RPCs completed on the client.
| Metric Name | Labels | PromQL Expression |
|---|---|---|
grpc_client_handled_total | component | sum(rate(grpc_client_handled_total{component="mpc"}[5m])) by (grpc_method, component) |
gRPC Server Handled Status Rate
| Metric Name | Labels | PromQL Expression |
|---|---|---|
grpc_server_handled_total | component grpc_method | sum(rate(grpc_server_handled_total{component="tsb", grpc_method=~"GetAllClusters|UpdateClusterState|GetAllConfigObjects"}[5m])) by (component, grpc_code) |
gRPC Client Handled Status Rate
| Metric Name | Labels | PromQL Expression |
|---|---|---|
grpc_client_handled_total | component | max(rate(grpc_client_handled_total{component="mpc"}[5m])) by (grpc_code, component) |
gRPC Server Msg Sent Rate
| Metric Name | Labels | PromQL Expression |
|---|---|---|
grpc_server_msg_sent_total | component grpc_method | sum(rate(grpc_server_msg_sent_total{component="tsb", grpc_method=~"GetAllClusters|UpdateClusterState|GetAllConfigObjects"}[5m])) by (grpc_method, component) |
gRPC Client Msg Received Rate
| Metric Name | Labels | PromQL Expression |
|---|---|---|
grpc_client_msg_received_total | component | sum(rate(grpc_client_msg_received_total{component="mpc"}[5m])) by (grpc_method, component) |
gRPC Client Msg Sent Rate
| Metric Name | Labels | PromQL Expression |
|---|---|---|
grpc_server_msg_sent_total | component grpc_method | sum(rate(grpc_server_msg_sent_total{component="tsb", grpc_method=~"GetAllClusters|UpdateClusterState|GetAllConfigObjects"}[5m])) by (grpc_method, component) |
gRPC Server Msg Received Rate
| Metric Name | Labels | PromQL Expression |
|---|---|---|
grpc_server_msg_received_total | component grpc_method | max(rate(grpc_server_msg_received_total{component="tsb", grpc_method=~"GetAllClusters|UpdateClusterState|GetAllConfigObjects|PushStatus"}[5m])) by (grpc_method, component) |
OAP Operational Status
Operational metrics to indicate Tetrate Service Bridge OAP stack health.
OAP Request Rate
The request rate to OAP, by status.
| Metric Name | Labels | PromQL Expression |
|---|---|---|
envoy_cluster_upstream_rq_xx_total | envoy_cluster_name plane | sum by (envoy_response_code_class) (rate(envoy_cluster_upstream_rq_xx_total{envoy_cluster_name="oap-grpc", plane="management"}[1m])) |
OAP Request Latency
The OAP, request latency.
| Metric Name | Labels | PromQL Expression |
|---|---|---|
envoy_cluster_upstream_rq_time_bucket | envoy_cluster_name plane | histogram_quantile(0.99, sum(rate(envoy_cluster_upstream_rq_time_bucket{envoy_cluster_name="oap-grpc", plane="management"}[1m])) by (le)) |
envoy_cluster_upstream_rq_time_bucket | envoy_cluster_name plane | histogram_quantile(0.95, sum(rate(envoy_cluster_upstream_rq_time_bucket{envoy_cluster_name="oap-grpc", plane="management"}[1m])) by (le)) |
envoy_cluster_upstream_rq_time_bucket | envoy_cluster_name plane | histogram_quantile(0.90, sum(rate(envoy_cluster_upstream_rq_time_bucket{envoy_cluster_name="oap-grpc", plane="management"}[1m])) by (le)) |
envoy_cluster_upstream_rq_time_bucket | envoy_cluster_name plane | histogram_quantile(0.75, sum(rate(envoy_cluster_upstream_rq_time_bucket{envoy_cluster_name="oap-grpc", plane="management"}[1m])) by (le)) |
envoy_cluster_upstream_rq_time_bucket | envoy_cluster_name plane | histogram_quantile(0.50, sum(rate(envoy_cluster_upstream_rq_time_bucket{envoy_cluster_name="oap-grpc", plane="management"}[1m])) by (le)) |
OAP Aggregation Request Rate
OAP Aggregation Request Rate, by type:
- central aggregation service handler received
- central application aggregation received
- central service aggregation received
| Metric Name | Labels | PromQL Expression |
|---|---|---|
central_aggregation_handler_total | N/A | sum(rate(central_aggregation_handler_total[1m])) |
central_app_aggregation_total | N/A | sum(rate(central_app_aggregation_total[1m])) |
central_service_aggregation_total | N/A | sum(rate(central_service_aggregation_total[1m])) |
OAP Aggregation Rows
Cumulative rate of rows in OAP aggreagation.
| Metric Name | Labels | PromQL Expression |
|---|---|---|
metrics_aggregation_total | plane | sum(rate(metrics_aggregation_total{plane="management"}[1m])) |
OAP Mesh Analysis Latency
The process latency of OAP service mesh telemetry streaming process.
| Metric Name | Labels | PromQL Expression |
|---|---|---|
mesh_analysis_latency_bucket | component plane | histogram_quantile(0.99, sum(rate(mesh_analysis_latency_bucket{plane="control", component="oap"}[1m])) by (le)) |
mesh_analysis_latency_bucket | component plane | histogram_quantile(0.95, sum(rate(mesh_analysis_latency_bucket{plane="control", component="oap"}[1m])) by (le)) |
mesh_analysis_latency_bucket | component plane | histogram_quantile(0.90, sum(rate(mesh_analysis_latency_bucket{plane="control", component="oap"}[1m])) by (le)) |
mesh_analysis_latency_bucket | component plane | histogram_quantile(0.75, sum(rate(mesh_analysis_latency_bucket{plane="control", component="oap"}[1m])) by (le)) |
OAP Zipkin Trace Rate
The OAP Zipkin processing trace rate
| Metric Name | Labels | PromQL Expression |
|---|---|---|
trace_in_latency_count | plane protocol | sum(rate(trace_in_latency_count{protocol='zipkin-http',plane='control'}[1m])) |
OAP Zipkin Trace Latency
The OAP trace processing latency
| Metric Name | Labels | PromQL Expression |
|---|---|---|
trace_in_latency_bucket | N/A | histogram_quantile(0.99, sum(rate(trace_in_latency_bucket[5m])) by (le)) |
trace_in_latency_bucket | N/A | histogram_quantile(0.95, sum(rate(trace_in_latency_bucket[5m])) by (le)) |
trace_in_latency_bucket | N/A | histogram_quantile(0.90, sum(rate(trace_in_latency_bucket[5m])) by (le)) |
trace_in_latency_bucket | N/A | histogram_quantile(0.75, sum(rate(trace_in_latency_bucket[5m])) by (le)) |
trace_in_latency_bucket | N/A | histogram_quantile(0.50, sum(rate(trace_in_latency_bucket[5m])) by (le)) |
OAP Zipkin Trace Error Rate
The OAP Zipkin processing trace error rate
| Metric Name | Labels | PromQL Expression |
|---|---|---|
trace_analysys_error_count | plane protocol | sum(rate(trace_analysys_error_count{protocol='zipkin-http',plane='control'}[1m])) |
JVM Threads
Numbed of threads in OAP JVM
| Metric Name | Labels | PromQL Expression |
|---|---|---|
jvm_threads_current | component plane | sum(jvm_threads_current{component="oap", plane="management"}) |
jvm_threads_daemon | component plane | sum(jvm_threads_daemon{component="oap", plane="management"}) |
jvm_threads_deadlocked | component plane | sum(jvm_threads_deadlocked{component="oap", plane="management"}) |
jvm_threads_peak | component plane | sum(jvm_threads_peak{component="oap", plane="management"}) |
JVM Memory
JVM Memory stats of OAP JVM instances.
| Metric Name | Labels | PromQL Expression |
|---|---|---|
jvm_memory_bytes_max | component plane | sum by (area, instance) (jvm_memory_bytes_max{component="oap", plane="management"}) |
jvm_memory_bytes_used | component plane | sum by (area, instance) (jvm_memory_bytes_used{component="oap", plane="management"}) |
TSB Health
TSB Health fast diagnosis
MPC Health
MPC Health Status. Three metrics define the health of this component:
- If mpc_info stops reporting, then it is KO.
- If mpc has create operations errors, then it is degraded (!!!).
- If mpc has fetch operations errors, then it is degraded (!!!).
- If mpc gRPC streams had more than X errors, then it is degraded (!!!)
If 2 and 3, then it is KO
| Metric Name | Labels | PromQL Expression |
|---|---|---|
mpc_info | N/A | absent(mpc_info) OR on() vector(0) |
mpc_xcp_config_create_ops_err | N/A | rate(mpc_xcp_config_create_ops_err[20m]) OR on() vector(1) > 0 |
mpc_xcp_config_fetch_ops_err | N/A | rate(mpc_xcp_config_fetch_ops_err[20m]) OR on() vector(1) > 0 |
permanent_stream_operation_total | component error | (sum(increase(permanent_stream_operation_total{error!="", component="mpc"}[5m])) or on() vector(0)) > bool 5 |
XCP Central Health
CentralXCP Health Status.
- If the number of grpc connections from Central to edges and MPC is less than 1, then KO. Edge connections of type cluster_state should be 1 for tsb api and 1 for each cluster. Because in previous versions we had some scenarios with negative values, we account for it with the less tha 1.
- If the propagation time is greater than 10 seconds, it is degraded (!!!). If it is equal or greater than 20 seconds, then it is KO.
| Metric Name | Labels | PromQL Expression |
|---|---|---|
xcp_central_config_propagation_time_ms_bucket | N/A | max(histogram_quantile(0.95, sum(rate(xcp_central_config_propagation_time_ms_bucket[60m])) by (le, edge))) OR on() vector(0) |
xcp_central_current_edge_connections | component connection_type | (sum(xcp_central_current_edge_connections{connection_type="cluster_state", component="xcp"}) OR on() vector(0)) < bool 1 |
XCP Edge Health
XCP Edge Health
- This is a key metric about messages received by central from edges. If some of the edges stop reporting, there's a problem with the edges.
- This is a key metric about time passed since edges synced with central. If it is more than 10 minutes, there's a problem with one of the edges.
| Metric Name | Labels | PromQL Expression |
|---|---|---|
xcp_central_config_propagation_event_count_total | status type | (min(increase(xcp_central_config_propagation_event_count_total{status="received",type="config_resync_request"}[8m])) OR on() vector(0)) == bool 0 |
xcp_central_current_onboarded_edge | N/A | max (time() - max((increase(xcp_central_current_onboarded_edge_total[2m]) unless increase(xcp_central_current_onboarded_edge[2m]) == 0) + on(edge,instance) group_right xcp_central_last_config_propagation_event_timestamp_ms{edge!="", type="cluster_state"} /1000) by (edge,type,instance) > bool 700) |
xcp_central_current_onboarded_edge_total | N/A | max (time() - max((increase(xcp_central_current_onboarded_edge_total[2m]) unless increase(xcp_central_current_onboarded_edge[2m]) == 0) + on(edge,instance) group_right xcp_central_last_config_propagation_event_timestamp_ms{edge!="", type="cluster_state"} /1000) by (edge,type,instance) > bool 700) |
xcp_central_last_config_propagation_event_timestamp_ms | edge type | max (time() - max((increase(xcp_central_current_onboarded_edge_total[2m]) unless increase(xcp_central_current_onboarded_edge[2m]) == 0) + on(edge,instance) group_right xcp_central_last_config_propagation_event_timestamp_ms{edge!="", type="cluster_state"} /1000) by (edge,type,instance) > bool 700) |
TSB API Health
TSB API Health Status.
- If OK grpc codes reported by TSB API are 0 or not being reported, this silence indicates an error. IF KO, use tctl or UI to check if tsb api is returning. If everything's alright, any call should set this metric to OK.
| Metric Name | Labels | PromQL Expression |
|---|---|---|
grpc_server_handled_total | component grpc_code grpc_type | (sum(rate(grpc_server_handled_total{component="tsb", grpc_code="OK", grpc_type="unary"}[5m])) by (grpc_code) OR on() vector(0)) == bool 0 |
IAM Health
IAM Health Status.
- If no authentication operations are reported, IAM is having an issue.
- If the difference between the short and middle term latencies for JWT is more than 1 second, then IAM is degraded.
- If the difference between the short and middle term latencies for JWT is more than 5 seconds, then IAM is having an issue.
- If the difference between the short and middle term latencies for non-JWT is more than 5 seconds, then IAM is degraded.
- If the difference between the short and middle term latencies for non-JWT is more than 30 seconds, then IAM is having an issue.
| Metric Name | Labels | PromQL Expression |
|---|---|---|
iam_auth_time_bucket | error provider | (abs((histogram_quantile(0.95, sum(rate(iam_auth_time_bucket{error="", provider="jwt.Provider"}[5m])) by (le)) OR on() vector(1)) - (histogram_quantile(0.95, sum(rate(iam_auth_time_bucket{error="", provider="jwt.Provider"}[30m])) by (le)) OR on() vector(1))) / 1000) > bool 1 |
iam_auth_time_bucket | error provider | (abs((histogram_quantile(0.95, sum(rate(iam_auth_time_bucket{error="", provider="jwt.Provider"}[5m])) by (le)) OR on() vector(1)) - (histogram_quantile(0.95, sum(rate(iam_auth_time_bucket{error="", provider="jwt.Provider"}[30m])) by (le)) OR on() vector(1))) / 1000) > bool 5 |
iam_auth_time_bucket | error provider | (abs((histogram_quantile(0.95, sum(rate(iam_auth_time_bucket{error="", provider!="jwt.Provider"}[5m])) by (le)) OR on() vector(1)) - (histogram_quantile(0.95, sum(rate(iam_auth_time_bucket{error="", provider!="jwt.Provider"}[30m])) by (le)) OR on() vector(1))) / 1000) > bool 5 |
iam_auth_time_bucket | error provider | (abs((histogram_quantile(0.95, sum(rate(iam_auth_time_bucket{error="", provider!="jwt.Provider"}[5m])) by (le)) OR on() vector(1)) - (histogram_quantile(0.95, sum(rate(iam_auth_time_bucket{error="", provider!="jwt.Provider"}[30m])) by (le)) OR on() vector(1))) / 1000) > bool 30 |
iam_auth_time_count | error | (max(sum(rate(iam_auth_time_count{error=""}[1m])) by (provider)) OR on() vector(0)) == bool 0 |
OAP Health
OAP Health Status.
- If OAP's JVM are not reported, then OAP in the management plane has an issue.
- If the number of reporting clusters to xcp central is less than the number of control planes OAPs, theres an issue with one or more OAPs in the CPs. The dependency on xcp central health is controlled by only accounting for positive differences.
| Metric Name | Labels | PromQL Expression |
|---|---|---|
jvm_threads_current | component plane | (sum(jvm_threads_current{component="oap", plane="management"}) OR on() vector(0)) == bool 0 |
jvm_threads_current | component plane | count(rate(xcp_central_config_propagation_event_count_total{status="received",type="config_resync_request"}[5m]) OR on() vector(0)) - count(jvm_threads_current{component="oap", plane="control"} OR on() vector(0)) > bool 0 |
xcp_central_config_propagation_event_count_total | status type | count(rate(xcp_central_config_propagation_event_count_total{status="received",type="config_resync_request"}[5m]) OR on() vector(0)) - count(jvm_threads_current{component="oap", plane="control"} OR on() vector(0)) > bool 0 |
Front Envoy Health
Front Envoy Health Status. 1.If the difference between the short and the long average response time from its upstream transactions exceeds a given threshold in ms (defined by the divisor).
| Metric Name | Labels | PromQL Expression |
|---|---|---|
envoy_cluster_internal_upstream_rq_time_bucket | component | histogram_quantile(0.95, sum(rate(envoy_cluster_internal_upstream_rq_time_bucket{component="front-envoy"}[5m])) by (le)) OR on() vector(2000) |
envoy_cluster_internal_upstream_rq_time_bucket | component | histogram_quantile(0.95, sum(rate(envoy_cluster_internal_upstream_rq_time_bucket{component="front-envoy"}[60m])) by (le)) OR on() vector(1000) |
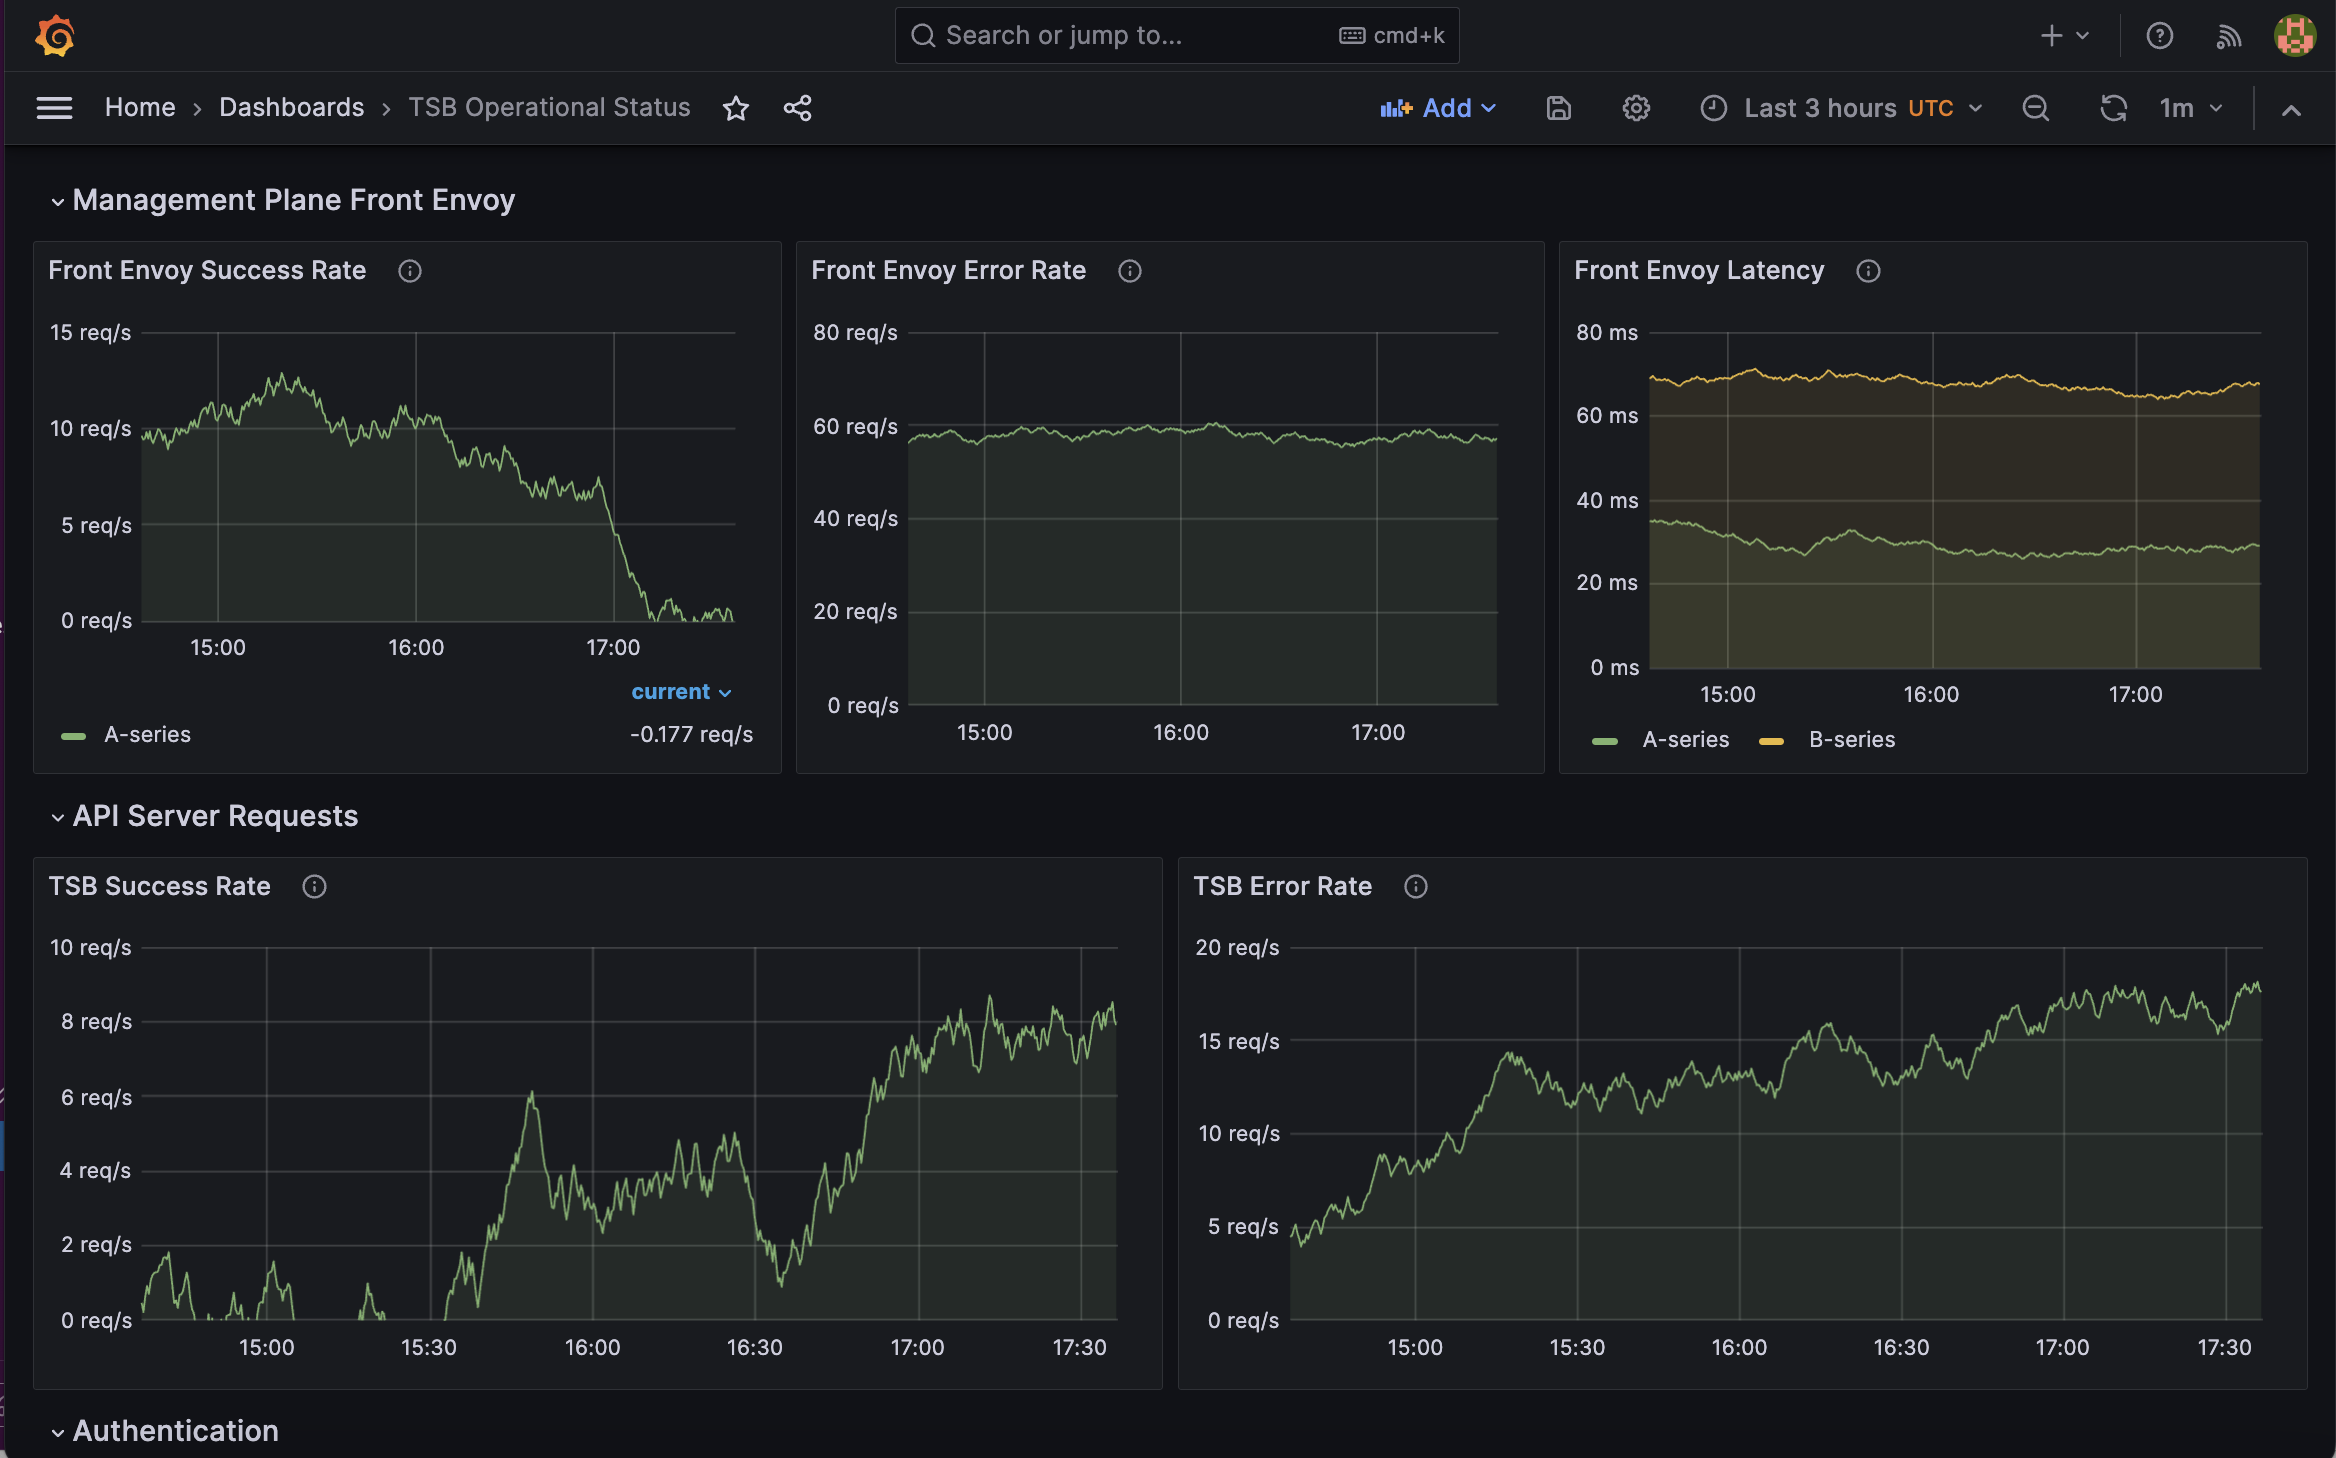
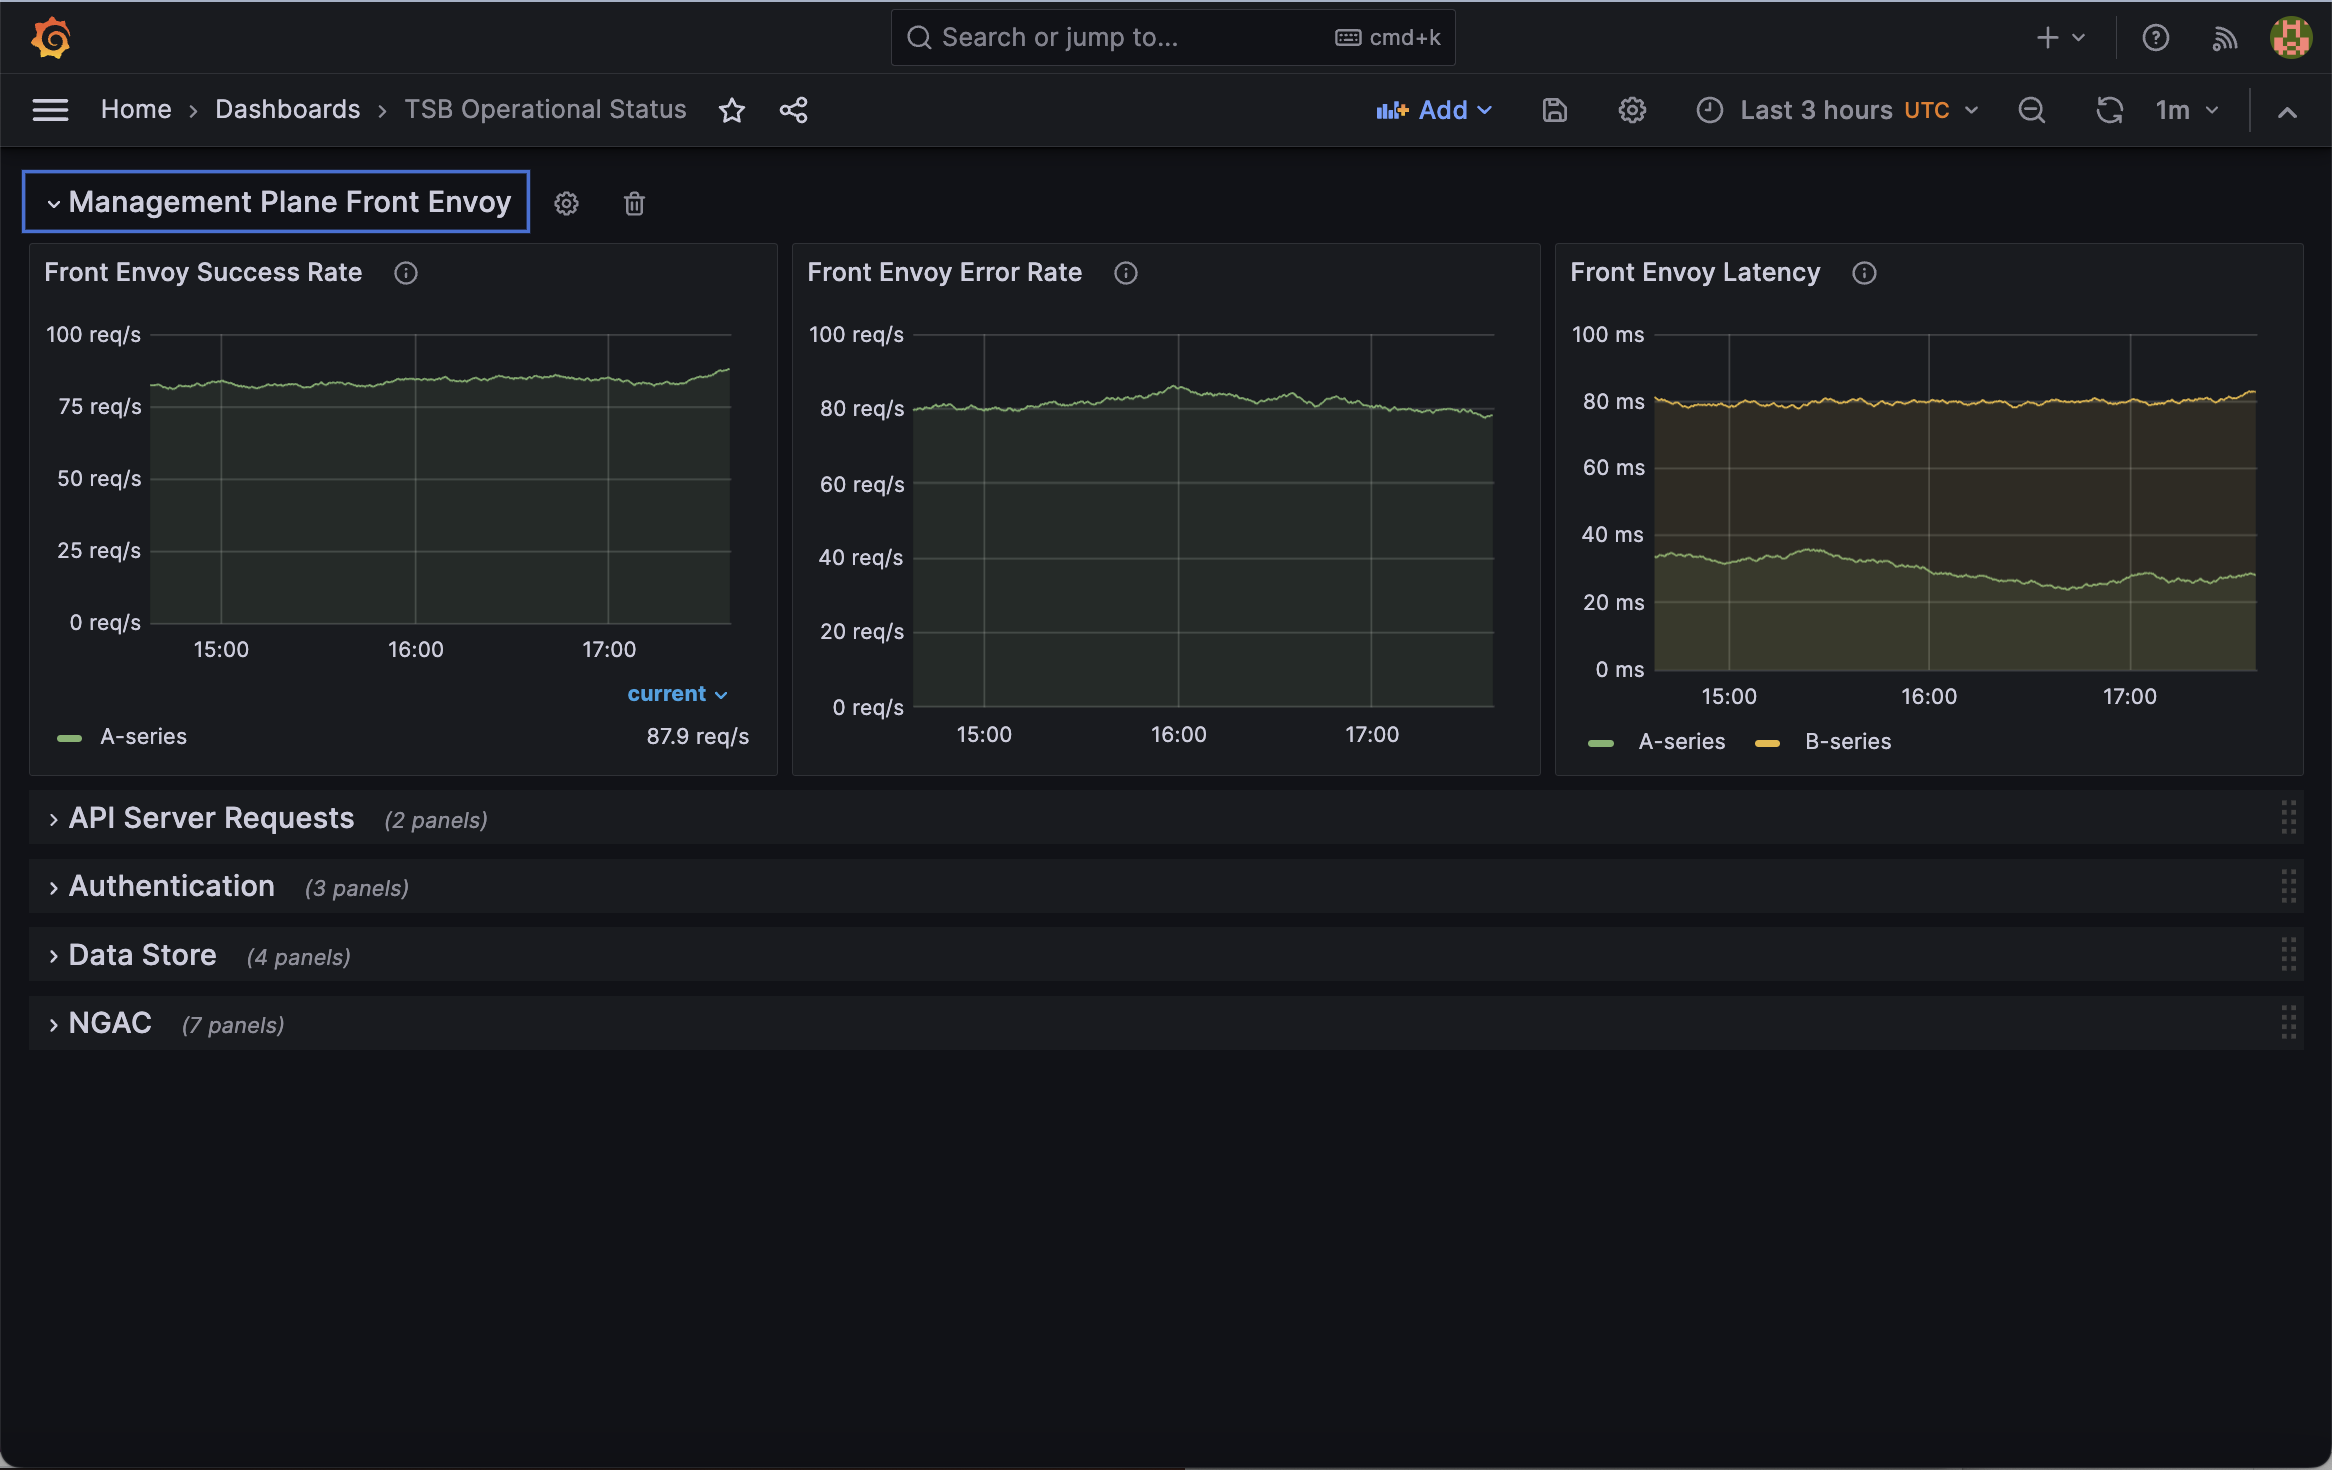
TSB Operational Status
Operational metrics to indicate Tetrate Service Bridge API server health.
Front Envoy Success Rate
Rate of successful requests to Front Envoy. This includes all user and cluster requests into the management plane.
Note: This indicates the health of the AuthZ server not whether the user or cluster making the request has the correct permissions.
| Metric Name | Labels | PromQL Expression |
|---|---|---|
envoy_cluster_internal_upstream_rq_total | component envoy_response_code | sum(rate(envoy_cluster_internal_upstream_rq_total{envoy_response_code=~"2.|3.|401", component="front-envoy"}[1m])) by (envoy_cluster_name) |
Front Envoy Error Rate
The error rate of requests to the Front Envoy server. This includes all user and cluster requests into the management plane. Note: This indicates the health of the AuthZ server not whether the user or cluster making the request has the correct permissions.
| Metric Name | Labels | PromQL Expression |
|---|---|---|
envoy_cluster_internal_upstream_rq_total | component envoy_response_code | sum(rate(envoy_cluster_internal_upstream_rq_total{envoy_response_code!~"2.|3.|401", component="front-envoy"}[1m])) by (envoy_cluster_name, envoy_response_code) |
Front Envoy Latency
Front Envoy request latency percentiles.
| Metric Name | Labels | PromQL Expression |
|---|---|---|
envoy_cluster_internal_upstream_rq_time_bucket | component | histogram_quantile(0.99, sum(rate(envoy_cluster_internal_upstream_rq_time_bucket{component="front-envoy"}[1m])) by (le, envoy_cluster_name)) |
envoy_cluster_internal_upstream_rq_time_bucket | component | histogram_quantile(0.95, sum(rate(envoy_cluster_internal_upstream_rq_time_bucket{component="front-envoy"}[1m])) by (le, envoy_cluster_name)) |
TSB Success Rate
Rate of successful requests to the TSB apiserver from the UI and CLI.
| Metric Name | Labels | PromQL Expression |
|---|---|---|
grpc_server_handled_total | component grpc_code grpc_method grpc_type | sum(rate(grpc_server_handled_total{component="tsb", grpc_code="OK", grpc_type="unary", grpc_method!="SendAuditLog"}[1m])) by (grpc_method) |
TSB Error Rate
Rate of failed requests to the TSB apiserver from the UI and CLI.
| Metric Name | Labels | PromQL Expression |
|---|---|---|
grpc_server_handled_total | component grpc_code grpc_method grpc_type | sum(rate(grpc_server_handled_total{component="tsb", grpc_code!="OK", grpc_type="unary", grpc_method!="SendAuditLog"}[1m])) by (grpc_code, grpc_method) |
Authentication Success Rate
The success rate for authentication operations for each type of authentication provider.
| Metric Name | Labels | PromQL Expression |
|---|---|---|
iam_auth_time_count | error | sum(rate(iam_auth_time_count{error=""}[1m])) by (provider) |
Authentication Error Rate
The error rate for authentication operations for each type of authentication provider.
Spikes may indicate problems with the provider or the given credentials, such as expired JWT tokens.
| Metric Name | Labels | PromQL Expression |
|---|---|---|
iam_auth_time_count | error | sum(rate(iam_auth_time_count{error!=""}[1m])) by (provider) |
Authentication Latency
The latency for authentication operations for each type of authentication provider.
Spikes in the latency may indicate that the authentication provider has a sub-optimal configuration (such as too wide LDAP queries).
| Metric Name | Labels | PromQL Expression |
|---|---|---|
iam_auth_time_bucket | error | histogram_quantile(0.99, sum(rate(iam_auth_time_bucket{error=""}[1m])) by (le, provider)) |
iam_auth_time_bucket | error | histogram_quantile(0.95, sum(rate(iam_auth_time_bucket{error=""}[1m])) by (le, provider)) |
Data Store Operations Rate
Request rate for operations persisting data to the datastore grouped by method and kind.
| Metric Name | Labels | PromQL Expression |
|---|---|---|
persistence_operation_total | N/A | sum(rate(persistence_operation_total[1m])) by (kind, method) |
Data Store Operations Error Rate
The request error rate for operations persisting data to the datastore grouped by method and kind. This graph also includes transactions. These are standard SQL transactions and consists of multiple operations. Note: The graph explicitly excludes "resource not found" errors. A small number of "not found" responses are normal as TSB for optimization often uses Get queries instead of Exists to determine the resource existence.
| Metric Name | Labels | PromQL Expression |
|---|---|---|
persistence_operation_total | error kind | sum(rate(persistence_operation_total{error="true", kind!="iam_revoked_token"}[1m])) by (kind, method, error) |
Data Store Operations Latency
The request latency for operations persisting data to the datastore grouped by method.
| Metric Name | Labels | PromQL Expression |
|---|---|---|
persistence_operation_duration_bucket | N/A | histogram_quantile(0.99, sum(rate(persistence_operation_duration_bucket[1m])) by (le, method)) |
Data Store Transaction Rate
The rate of newly creates transactions dry run mode. These are standard SQL transactions and consist of multiple operations.
| Metric Name | Labels | PromQL Expression |
|---|---|---|
persistence_transaction_total | N/A | sum(rate(persistence_transaction_total[1m])) by (dry_run_mode) |
Data Store Transaction Error Rate
The rate of transactions that failed at execution time by dry run mode. These are standard SQL transactions and consist of multiple operations.
| Metric Name | Labels | PromQL Expression |
|---|---|---|
persistence_transaction_total | error | sum(rate(persistence_transaction_total{error="true"}[1m])) by (dry_run_mode) |
Data Store Transactions Latency
TheP99 latency of transactions execution grouped by dry run mode.
| Metric Name | Labels | PromQL Expression |
|---|---|---|
persistence_transaction_duration_bucket | N/A | histogram_quantile(0.99, sum(rate(persistence_transaction_duration_bucket[1m])) by (le, dry_run_mode)) |
Active Transactions
The number of running transactions on the datastore.
This graph shows how many active transactions are running at a given point in time. It helps you understand the load of the system generated by concurrent access to the platform.
| Metric Name | Labels | PromQL Expression |
|---|---|---|
persistence_concurrent_transaction | N/A | sum(persistence_concurrent_transaction) by (dry_run_mode) |
Mismatching Transactions dry run mode
This is the number of child transactions that do not match parent's transaction dry run mode.
This means that the dry run mode has not properly been propagated to child transactions.
| Metric Name | Labels | PromQL Expression |
|---|---|---|
persistence_dry_run_transaction_mismatch_total | N/A | sum(persistence_dry_run_transaction_mismatch_total) |
In Use Connections
The number of connections currently in use.
| Metric Name | Labels | PromQL Expression |
|---|---|---|
go_sql_in_use_connections | db_name | sum(max_over_time(go_sql_in_use_connections{db_name="dbpool"}[1m])) by(component) |
Open Connections/Max Connections
The number of established connections both in use and idle. Also the maximum allowed number of connections is displayed.
| Metric Name | Labels | PromQL Expression |
|---|---|---|
go_sql_max_open_connections | db_name | sum(max_over_time(go_sql_max_open_connections{db_name="dbpool"}[1m])) by(component) |
go_sql_open_connections | db_name | sum(max_over_time(go_sql_open_connections{db_name="dbpool"}[1m])) by(component) |
Connections Waited
The total number of connections waited for.
| Metric Name | Labels | PromQL Expression |
|---|---|---|
go_sql_wait_count_total | db_name | sum(increase(go_sql_wait_count_total{db_name="dbpool"}[1m])) by(component) |
Time Waiting for Connections
The total time blocked waiting for a new connection.
| Metric Name | Labels | PromQL Expression |
|---|---|---|
go_sql_wait_duration_seconds_total | component db_name | sum(increase(go_sql_wait_duration_seconds_total{component="tsb", db_name="dbpool"}[1m])) by(component) |
Created Connections
The number of created connections
| Metric Name | Labels | PromQL Expression |
|---|---|---|
db_sql_created_connections_duration_count | N/A | sum(increase(db_sql_created_connections_duration_count[1m])) by (component) |
Create Connections Latency
The p99 duration in milliseconds for creating new connection.
| Metric Name | Labels | PromQL Expression |
|---|---|---|
db_sql_created_connections_duration_bucket | N/A | histogram_quantile(0.99, sum(rate(db_sql_created_connections_duration_bucket[1m])) by (le, component)) |
Closed Connections
The number of closed connections by reasons.
- Max Idle: The total number of connections closed due to SetMaxIdleConns.
- Idle Time: The total number of connections closed due to SetConnMaxIdleTime.
- Max Lifetime: The total number of connections closed due to SetConnMaxLifetime.
| Metric Name | Labels | PromQL Expression |
|---|---|---|
go_sql_max_idle_closed_total | db_name | sum(increase(go_sql_max_idle_closed_total{db_name="dbpool"}[1m])) by(component) |
go_sql_max_idle_time_closed_total | db_name | sum(increase(go_sql_max_idle_time_closed_total{db_name="dbpool"}[1m])) by(component) |
go_sql_max_lifetime_closed_total | db_name | sum(increase(go_sql_max_lifetime_closed_total{db_name="dbpool"}[1m])) by(component) |
Idle Connections
The number of idle connections.
| Metric Name | Labels | PromQL Expression |
|---|---|---|
go_sql_idle_connections | db_name | sum(max_over_time(go_sql_idle_connections{db_name="dbpool"}[1m])) by(component) |
Service Registry Operations
This metric shows the amount of operations done by the service registry. The service registry will handle all service changes across the clusters, detecting and persisting them in the database.
| Metric Name | Labels | PromQL Expression |
|---|---|---|
service_registry_operation_duration_count | error | sum(increase(service_registry_operation_duration_count{error=""}[1m])) by (operation) |
service_registry_operation_duration_count | error | sum(increase(service_registry_operation_duration_count{error!=""}[1m])) by (operation) |
Service Registry Operations Duration
Duration of operations performed by the service registry.
This graph also includes the total duration of the reconciliation process during which the service registry iterates through all clusters to identify changes that need to be persisted in the database.
| Metric Name | Labels | PromQL Expression |
|---|---|---|
service_registry_operation_duration_bucket | N/A | histogram_quantile(0.99, sum(rate(service_registry_operation_duration_bucket[1m])) by (le, operation)) |
service_registry_total_duration_bucket | N/A | histogram_quantile(0.99, sum(rate(service_registry_total_duration_bucket[1m])) by (le)) |
PDP Success Rate
Successful request rate of PDP grouped by method. NGAC is a graph-based authorization framework that consists of three main components: Policy Information Point (PIP): Maintains the NGAC graph. It creates the nodes and edges in the graph that represents the state of the system. The other components of NGAC use this graph to perform access decisions. Policy Decision Point (PDP): Performs access decisions based on the NGAC graph's policies. The PDP is used to perform binary Allow/Deny access decisions (Check) and determine the objects a user has access to (List). These access decisions are enforced at the Policy Enforcement Point (PEP). Policy Enforcement Point (PEP): Enforces access control by calling the PDP to get an access decision. Successful requests to the PDP show the number of requests that the PEP has successfully made to the PDP. A successful request does not represent "access granted" decisions; they represent the access decision requests for which a verdict was obtained. A drop in this metric may show that operations against the graph are failing. This may mean that the graph is unavailable for reads and this is usually a consequence of failures in the PIP. Failures in the PIP for write operations will result in the graph not being properly updated to the latest status, resulting in access decisions based on stale models.
| Metric Name | Labels | PromQL Expression |
|---|---|---|
ngac_pdp_operation_total | error | sum(rate(ngac_pdp_operation_total{error=""}[1m])) by (method) |
PDP Error Rate
Rate of errors for PDP requests grouped by method. NGAC is a graph-based authorization framework that consists of three main components: Policy Information Point (PIP): Maintains the NGAC graph. It creates the nodes and edges in the graph that represents the state of the system. The other components of NGAC use this graph to perform access decisions. Policy Decision Point (PDP): Performs access decisions based on the NGAC graph's policies. The PDP is used to perform binary Allow/Deny access decisions (Check) and determine the objects a user has access to (List). These access decisions are enforced at the Policy Enforcement Point (PEP). Policy Enforcement Point (PEP): Enforces access control by calling the PDP to get an access decision. Successful requests to the PDP show the number of requests that the PEP has successfully made to the PDP. A successful request does not represent "access granted" decisions; they represent the access decision requests where a verdict was obtained. Failed requests to the PDP show the number of requests from the PEP to the PDP that have failed. They do not represent "access denied" decisions; they represent the access decision requests where a verdict could not be obtained. A rise in this metric may show that operations against the graph are failing. This may mean that the graph is unavailable for reads and this is usually a consequence of failures in the PIP. Failures in the PIP for write operations will result in the graph not being correctly updated to the latest status, resulting in access decisions based on stale models.
| Metric Name | Labels | PromQL Expression |
|---|---|---|
ngac_pdp_operation_total | error | sum(rate(ngac_pdp_operation_total{error!=""}[1m])) by (method) |
PDP Latency
PDP latency percentiles grouped by method. NGAC is a graph-based authorization framework that consists of three main components: Policy Information Point (PIP): Maintains the NGAC graph. It creates the nodes and edges in the graph that represents the state of the system. The other components of NGAC use this graph to perform access decisions. Policy Decision Point (PDP): Performs access decisions based on the NGAC graph's policies. The PDP is used to perform binary Allow/Deny access decisions (Check) and determine the objects a user has access to (List). These access decisions are enforced at the Policy Enforcement Point (PEP). Policy Enforcement Point (PEP): Enforces access control by calling the PDP to get an access decision. Successful requests to the PDP show the number of requests that the PEP has successfully made to the PDP. A successful request does not represent "access granted" decisions; they represent the access decision requests for which a verdict was obtained. This metric shows the time it takes to get an access decision for authorization requests. Degradation in PDP operations may result in general degradation of the system. PDP latency represents the time it takes to make access decisions, and that will impact user experience since access decisions are made and enforced for every operation.
| Metric Name | Labels | PromQL Expression |
|---|---|---|
ngac_pdp_operation_duration_bucket | N/A | histogram_quantile(0.99, sum(rate(ngac_pdp_operation_duration_bucket[1m])) by (method, le)) |
ngac_pdp_operation_duration_bucket | N/A | histogram_quantile(0.95, sum(rate(ngac_pdp_operation_duration_bucket[1m])) by (method, le)) |
PIP Success Rate
Successful request rate of PIP grouped by method.
NGAC is a graph based authorization framework that consists on three main components:
- Policy Information Point (PIP): Maintains the NGAC graph. It creates the nodes and edges in the graph that represents the state of the system. This graph is used by the other components of NGAC to perform access decisions.
- Policy Decision Point (PDP): Performs access decisions based on the policies configured in the NGAC graph. The PDP is used to perform binary Allow/Deny access decisions (Check), and to determine the objects a user has access to (List). These access decisions are enforced at the Policy Enforcement Point (PEP).
- Policy Enforcement Point (PEP): Enforces access control by calling the PDP to get an access decision. Successful requests to the PDP show the number of requests that the PEP has successfully made to the PDP. Successful request do not represent "access granted" decisions; they just represent the access decision requests for which a verdict was obtained.
PIP operations are executed against the NGAC graph to represent and maintain the objects in the system and the relationships between them.
A drop in this metric may show that operations against the graph are failing. This may mean that the graph is unavailable for reads, or that it is failing to persist data. Read failures may result in failed access decisions (in the PDP) and user interaction with the system may be rejected as well. Failures in write operations will result in the graph not being properly updated to the latest status and that could result in access decisions based on stale models.
| Metric Name | Labels | PromQL Expression |
|---|---|---|
ngac_pip_operation_total | error | sum(rate(ngac_pip_operation_total{error=""}[1m])) by (method) |
PIP Latency
PiP latency percentiles grouped by method.
NGAC is a graph based authorization framework that consists on three main components:
- Policy Information Point (PIP): Maintains the NGAC graph. It creates the nodes and edges in the graph that represents the state of the system. This graph is used by the other components of NGAC to perform access decisions.
- Policy Decision Point (PDP): Performs access decisions based on the policies configured in the NGAC graph. The PDP is used to perform binary Allow/Deny access decisions (Check), and to determine the objects a user has access to (List). These access decisions are enforced at the Policy Enforcement Point (PEP).
- Policy Enforcement Point (PEP): Enforces access control by calling the PDP to get an access decision. Successful requests to the PDP show the number of requests that the PEP has successfully made to the PDP. Successful request do not represent "access granted" decisions; they just represent the access decision requests for which a verdict was obtained.
This metric shows the time it takes for a PIP operation to complete and, in the case of write operations, to have data persisted in the NGAC graph.
Degradation in PIP operations may result in general degradation of the system. PIP latency represents the time it takes to access the NGAC graph, and this directly affects the PDP when running access decisions. A degraded PIP may result in a degraded PDP, and that will impact user experience, as access decisions are made and enforced for every operation.
| Metric Name | Labels | PromQL Expression |
|---|---|---|
ngac_pip_operation_duration_bucket | N/A | histogram_quantile(0.99, sum(rate(ngac_pip_operation_duration_bucket[1m])) by (method, le)) |
ngac_pip_operation_duration_bucket | N/A | histogram_quantile(0.95, sum(rate(ngac_pip_operation_duration_bucket[1m])) by (method, le)) |
PIP Error Rate
Rate of errors for PIP requests grouped by method.
NGAC is a graph based authorization framework that consists on three main components:
- Policy Information Point (PIP): Maintains the NGAC graph. It creates the nodes and edges in the graph that represents the state of the system. This graph is used by the other components of NGAC to perform access decisions.
- Policy Decision Point (PDP): Performs access decisions based on the policies configured in the NGAC graph. The PDP is used to perform binary Allow/Deny access decisions (Check), and to determine the objects a user has access to (List). These access decisions are enforced at the Policy Enforcement Point (PEP).
- Policy Enforcement Point (PEP): Enforces access control by calling the PDP to get an access decision. Successful requests to the PDP show the number of requests that the PEP has successfully made to the PDP. Successful request do not represent "access granted" decisions; they just represent the access decision requests for which a verdict was obtained.
PIP operations are executed against the NGAC graph to represent and maintain the objects in the system and the relationships between them.
Note: the "Node not found" errors are explicitly excluded as TSB often uses GetNode method instead of Exists to determine the node existence, for the purposes of optimisation.
A general raise in this metric may show that operations against the graph are failing. This may mean that the graph is unavailable for reads, or that it is failing to persist data. Read failures may result in failed access decisions (in the PDP) and user interaction with the system may be rejected as well. Failures in write operations will result in the graph not being properly updated to the latest status and that could result in access decisions based on stale models.
| Metric Name | Labels | PromQL Expression |
|---|---|---|
ngac_pip_operation_total | error | sum(rate(ngac_pip_operation_total{error!="", error!="Node not found"}[1m])) by (method) |
Active PIP Transactions
The number of running transactions on the NGAC PIP. NGAC is a graph-based authorization framework that consists on three main components: Policy Information Point (PIP): Maintains the NGAC graph. It creates the nodes and edges in the graph that represents the state of the system. The other components of NGAC use this graph to perform access decisions. Policy Decision Point (PDP): Performs access decisions based on the NGAC graph's policies. The PDP is used to perform binary Allow/Deny access decisions (Check) and determine the objects a user has access to (List). These access decisions are enforced at the Policy Enforcement Point (PEP). Policy Enforcement Point (PEP): Enforces access control by calling the PDP to get an access decision. Successful requests to the PDP show the number of requests that the PEP has successfully made to the PDP. A successful request does not represent "access granted" decisions; they represent the access decision requests for which a verdict was obtained. This metric shows the number of active write operations against the NGAC graph. It can be useful to understand the load of the system generated by concurrent access to the platform.
| Metric Name | Labels | PromQL Expression |
|---|---|---|
ngac_pip_concurrent_transaction | N/A | sum(ngac_pip_concurrent_transaction) |
TSB webhooks
Operational status of the Tetrate Service Bridge webhooks
Management Plane webhook requests
Shows the rate of requests for the webhooks in each management plane component
| Metric Name | Labels | PromQL Expression |
|---|---|---|
controller_runtime_webhook_requests_total | plane | sum by(component) (rate(controller_runtime_webhook_requests_total{plane="management"}[1m])) |
Control Plane webhooks requests
Shows the rate of requests for the webhooks in each control plane component for the selected cluster
| Metric Name | Labels | PromQL Expression |
|---|---|---|
controller_runtime_webhook_requests_total | cluster_name plane | sum by(component) (rate(controller_runtime_webhook_requests_total{plane="control", cluster_name="$cluster"}[1m])) |
Management Plane webhook latency
Shows the latency percentiles across all management plane webhooks
| Metric Name | Labels | PromQL Expression |
|---|---|---|
controller_runtime_webhook_latency_seconds_bucket | plane | histogram_quantile(0.5, sum by(le) (rate(controller_runtime_webhook_latency_seconds_bucket{plane="management"}[1m]))) |
controller_runtime_webhook_latency_seconds_bucket | plane | histogram_quantile(0.95, sum by(le) (rate(controller_runtime_webhook_latency_seconds_bucket{plane="management"}[1m]))) |
controller_runtime_webhook_latency_seconds_bucket | plane | histogram_quantile(0.99, sum by(le) (rate(controller_runtime_webhook_latency_seconds_bucket{plane="management"}[1m]))) |
Control Plane webhook latency
Shows the latency percentiles across all control plane webhooks for the selected cluster
| Metric Name | Labels | PromQL Expression |
|---|---|---|
controller_runtime_webhook_latency_seconds_bucket | cluster_name plane | histogram_quantile(0.5, sum by(le) (rate(controller_runtime_webhook_latency_seconds_bucket{plane="control", cluster_name="$cluster"}[1m]))) |
controller_runtime_webhook_latency_seconds_bucket | cluster_name plane | histogram_quantile(0.95, sum by(le) (rate(controller_runtime_webhook_latency_seconds_bucket{plane="control", cluster_name="$cluster"}[1m]))) |
controller_runtime_webhook_latency_seconds_bucket | cluster_name plane | histogram_quantile(0.99, sum by(le) (rate(controller_runtime_webhook_latency_seconds_bucket{plane="control", cluster_name="$cluster"}[1m]))) |
Management Plane deletion protection webhook
Shows the number of deletion requests denied and invalid requests received by the deletion protection webhook in the management plane
| Metric Name | Labels | PromQL Expression |
|---|---|---|
deletion_protection_webhook_denied_total | plane | sum by(component) (rate(deletion_protection_webhook_denied_total{plane="management"}[1m])) |
deletion_protection_webhook_invalid_total | plane | sum by(component) (rate(deletion_protection_webhook_invalid_total{plane="management"}[1m])) |
Control Plane deletion protection webhooks
Shows the number of deletion requests denied and invalid requests received by the deletion protection webhook in the control plane for the selected cluster
| Metric Name | Labels | PromQL Expression |
|---|---|---|
deletion_protection_webhook_denied_total | cluster_name plane | sum by(component) (rate(deletion_protection_webhook_denied_total{plane="control", cluster_name="$cluster"}[1m])) |
deletion_protection_webhook_invalid_total | cluster_name plane | sum by(component) (rate(deletion_protection_webhook_invalid_total{plane="control", cluster_name="$cluster"}[1m])) |
XCP Central Operational Status
Operational metrics to indicate XCP Central health.
| Metric Name | Labels | PromQL Expression |
|---|---|---|
process_start_time_seconds | component plane | time() - process_start_time_seconds{component="xcp",plane="management"} |
XCP Central Version
| Metric Name | Labels | PromQL Expression |
|---|---|---|
xcp_central_version | N/A | label_replace(xcp_central_version, "xcp_version", "$1", "version", "(.*)") |
Time since last cluster state received from the edge (seconds)
Since the default cluster state resync time is 10 minutes, any value higher than 600-700 seconds is considered abnormal.
| Metric Name | Labels | PromQL Expression |
|---|---|---|
xcp_central_current_onboarded_edge_total | N/A | time() - max(max((increase(xcp_central_current_onboarded_edge_total[2m]) unless increase(xcp_central_current_onboarded_edge_total[2m]) == 0)) by (edge) + on(edge) group_right xcp_central_last_config_propagation_event_timestamp_ms{edge!="", status="received" , type="cluster_state"} /1000) by (edge,type) |
xcp_central_last_config_propagation_event_timestamp_ms | edge status type | time() - max(max((increase(xcp_central_current_onboarded_edge_total[2m]) unless increase(xcp_central_current_onboarded_edge_total[2m]) == 0)) by (edge) + on(edge) group_right xcp_central_last_config_propagation_event_timestamp_ms{edge!="", status="received" , type="cluster_state"} /1000) by (edge,type) |
Time since cluster states were sent to the MPC and Edges clients (seconds)
| Metric Name | Labels | PromQL Expression |
|---|---|---|
xcp_central_current_onboarded_edge | N/A | time() - max((xcp_central_last_cluster_state_event_timestamp_ms / 1000 unless on(peer_cluster_name) label_replace(increase(xcp_central_current_onboarded_edge[5m]),"peer_cluster_name", "$1", "edge", "(.)") == 0) unless on(cluster_state_event_cluster_name) label_replace(increase(xcp_central_current_onboarded_edge[5m]),"cluster_state_event_cluster_name", "$1", "edge", "(.)") == 0) by (peer_cluster_name, cluster_state_event_cluster_name) |
xcp_central_last_cluster_state_event_timestamp_ms | N/A | time() - max((xcp_central_last_cluster_state_event_timestamp_ms / 1000 unless on(peer_cluster_name) label_replace(increase(xcp_central_current_onboarded_edge[5m]),"peer_cluster_name", "$1", "edge", "(.)") == 0) unless on(cluster_state_event_cluster_name) label_replace(increase(xcp_central_current_onboarded_edge[5m]),"cluster_state_event_cluster_name", "$1", "edge", "(.)") == 0) by (peer_cluster_name, cluster_state_event_cluster_name) |
Time since config resync request is received from the edge (seconds)
Because regular periodic resync requests would be coming, a high value than the resync period, 60 sec default, is not normal.
| Metric Name | Labels | PromQL Expression |
|---|---|---|
xcp_central_current_onboarded_edge_total | N/A | time() - max(max((increase(xcp_central_current_onboarded_edge_total[2m]) unless increase(xcp_central_current_onboarded_edge_total[2m]) == 0)) by (edge) + on(edge) group_right xcp_central_last_config_propagation_event_timestamp_ms{edge!="", status="received" , type="config_resync_request"} /1000) by (edge,type) |
xcp_central_last_config_propagation_event_timestamp_ms | edge status type | time() - max(max((increase(xcp_central_current_onboarded_edge_total[2m]) unless increase(xcp_central_current_onboarded_edge_total[2m]) == 0)) by (edge) + on(edge) group_right xcp_central_last_config_propagation_event_timestamp_ms{edge!="", status="received" , type="config_resync_request"} /1000) by (edge,type) |
Time since config CRs sent to the edge (seconds)
Sent: Time since configs like workspaces, traffic groups etc were sent to the edge. In steady state, a very high value is fine
| Metric Name | Labels | PromQL Expression |
|---|---|---|
xcp_central_current_onboarded_edge_total | N/A | time() - max( max((increase(xcp_central_current_onboarded_edge_total[2m]) unless increase(xcp_central_current_onboarded_edge_total[2m]) == 0)) by (edge) + on(edge) group_right xcp_central_last_config_propagation_event_timestamp_ms{edge!="", status="sent"} /1000) by (edge,type) |
xcp_central_last_config_propagation_event_timestamp_ms | edge status | time() - max( max((increase(xcp_central_current_onboarded_edge_total[2m]) unless increase(xcp_central_current_onboarded_edge_total[2m]) == 0)) by (edge) + on(edge) group_right xcp_central_last_config_propagation_event_timestamp_ms{edge!="", status="sent"} /1000) by (edge,type) |
messages received by central from edges in last 5 min
Number of times any message is received by central from edges
Messages received by central from any edge are of three types:
- Periodic(per minute by default) config resync request
- cluster state
- Header message to ack the config received
This number is combined count of all three in the last 5 min.
| Metric Name | Labels | PromQL Expression |
|---|---|---|
xcp_central_config_propagation_event_count_total | status type | increase(xcp_central_config_propagation_event_count_total{status="received",type="config_resync_request"}[5m]) unless on(edge) increase(xcp_central_current_onboarded_edge_total[5m]) == 0 |
xcp_central_config_propagation_event_count_total | status type | increase(xcp_central_config_propagation_event_count_total{status="received",type="cluster_state"}[5m]) unless on(edge) increase(xcp_central_current_onboarded_edge_total[5m]) == 0 |
xcp_central_current_onboarded_edge_total | N/A | increase(xcp_central_config_propagation_event_count_total{status="received",type="config_resync_request"}[5m]) unless on(edge) increase(xcp_central_current_onboarded_edge_total[5m]) == 0 |
xcp_central_current_onboarded_edge_total | N/A | increase(xcp_central_config_propagation_event_count_total{status="received",type="cluster_state"}[5m]) unless on(edge) increase(xcp_central_current_onboarded_edge_total[5m]) == 0 |
Number of times config CRs sent by central to the edges in last 5m
Number of times config CRs like workspaces. traffic groups etc sent by central in last 5m
| Metric Name | Labels | PromQL Expression |
|---|---|---|
xcp_central_config_propagation_event_count_total | status | increase(xcp_central_config_propagation_event_count_total{status="sent"}[5m]) unless on(edge) increase(xcp_central_current_onboarded_edge_total[5m]) == 0 |
xcp_central_current_onboarded_edge_total | N/A | increase(xcp_central_config_propagation_event_count_total{status="sent"}[5m]) unless on(edge) increase(xcp_central_current_onboarded_edge_total[5m]) == 0 |
Config Propagation Latency by Edge
Distribution of time to propagate updates from Central (Management plane) to Edges. If there is no config push in last one minute, you will see all 0s, which is expected.
| Metric Name | Labels | PromQL Expression |
|---|---|---|
xcp_central_config_propagation_time_ms_bucket | N/A | histogram_quantile(0.99, sum(rate(xcp_central_config_propagation_time_ms_bucket[1m])) by (le, edge)) unless on(edge) increase(xcp_central_current_onboarded_edge[5m]) == 0 |
xcp_central_config_propagation_time_ms_bucket | N/A | histogram_quantile(0.95, sum(rate(xcp_central_config_propagation_time_ms_bucket[1m])) by (le, edge)) unless on(edge) increase(xcp_central_current_onboarded_edge[5m]) == 0 |
xcp_central_config_propagation_time_ms_bucket | N/A | histogram_quantile(0.90, sum(rate(xcp_central_config_propagation_time_ms_bucket[1m])) by (le, edge)) unless on(edge) increase(xcp_central_current_onboarded_edge[5m]) == 0 |
xcp_central_config_propagation_time_ms_bucket | N/A | histogram_quantile(0.75, sum(rate(xcp_central_config_propagation_time_ms_bucket[1m])) by (le, edge)) unless on(edge) increase(xcp_central_current_onboarded_edge[5m]) == 0 |
xcp_central_config_propagation_time_ms_bucket | N/A | histogram_quantile(0.50, sum(rate(xcp_central_config_propagation_time_ms_bucket[1m])) by (le, edge)) unless on(edge) increase(xcp_central_current_onboarded_edge[5m]) == 0 |
xcp_central_current_onboarded_edge | N/A | histogram_quantile(0.99, sum(rate(xcp_central_config_propagation_time_ms_bucket[1m])) by (le, edge)) unless on(edge) increase(xcp_central_current_onboarded_edge[5m]) == 0 |
xcp_central_current_onboarded_edge | N/A | histogram_quantile(0.95, sum(rate(xcp_central_config_propagation_time_ms_bucket[1m])) by (le, edge)) unless on(edge) increase(xcp_central_current_onboarded_edge[5m]) == 0 |
xcp_central_current_onboarded_edge | N/A | histogram_quantile(0.90, sum(rate(xcp_central_config_propagation_time_ms_bucket[1m])) by (le, edge)) unless on(edge) increase(xcp_central_current_onboarded_edge[5m]) == 0 |
xcp_central_current_onboarded_edge | N/A | histogram_quantile(0.75, sum(rate(xcp_central_config_propagation_time_ms_bucket[1m])) by (le, edge)) unless on(edge) increase(xcp_central_current_onboarded_edge[5m]) == 0 |
xcp_central_current_onboarded_edge | N/A | histogram_quantile(0.50, sum(rate(xcp_central_config_propagation_time_ms_bucket[1m])) by (le, edge)) unless on(edge) increase(xcp_central_current_onboarded_edge[5m]) == 0 |
Errors in config push REQUESTS to the edges in last 5 minutes
Central enqueues the config push request to the debouncer(an internal component of central) when:
- It receives event about config resources from k8s apiserver , or
- Any edge connects first time, or
- It is handling a periodic resync request from any of the edges.
In either case, if central meets an error in the event handling before en-queuing the config push request to the debouncer, this metric gets incremented. So this panel is inversely related to "config push(to the edges) requests enqueued to debouncer in last 5 min".
| Metric Name | Labels | PromQL Expression |
|---|---|---|
xcp_central_config_update_error_count | N/A | increase(xcp_central_config_update_error_count[5m]) OR on() vector(0) |
config push(to the edges) requests enqueued to debouncer in last 5 min
Number of times central enqueued config push(to the connected edges) request to the debouncer in last 5 min. Along with count of the request, reason for the config push request are also shown.
Note: This metric does not indicate the count of actual config push by central. Because of debouncing, actual config push will generally be lesser than this metric. In other words, this metric shows input events for config push. Output (config push on grpc channels to edges) will be lesser because of debouncer
Reasons could be:
- ADD/DELETE/UPDATE : These are the events received by the central from the k8s apiserver. Example: ADD/IngressGateway means count of config push requests enqueued because of new IngressGateway CRs creation at k8s apiserver.
- EDGE_RESYNC: This shows the count of config push requests when periodic config resync request from edge triggers config push. This will be non-zero only in rare cases when, for whatever reason, edge reported a stale set of configs and central triggers config push to refresh the configs
- EDGE_FIRST_CONNECTION: When any edge connects to central, central syncs config to the edge. In steady state, its count must be 0. If its count is non-zero, that indicates grpc stream between central and edge is in error and getting reconnected.
- CENTRAL_RESYNC: central enqueues a config push request every 5 minute to reconcile configs at edges. Note that this will result into actual config push only to those edges which are not actively sending their config version periodically. Since 1.4, edges request config resync and therefore central will actually push configs over grpc as a result of these request only if edge is < 1.4.
| Metric Name | Labels | PromQL Expression |
|---|---|---|
xcp_central_config_update_push_count_total | N/A | increase(xcp_central_config_update_push_count_total[5m]) |
Pending configurations (orphan configs)
Pending configurations are configs for which cluster could not be determined yet because the parent resource is missing. These metrics show which configurations are currently in Pending state, and the missing Parent group configuration due to which this is in Pending state.
For more information on the Pending configurations can be found by using the XCP central debug endpoint - /debug/cluster_scoped_configs/?pending=true
| Metric Name | Labels | PromQL Expression |
|---|---|---|
xcp_central_pending_configs_total | N/A | xcp_central_pending_configs_total |
Number of connections(cluster state pushing and config pushing)
Central has two type of grpc connections:
- edge_config_distribution: One grpc connection with each edge for pushing user configs like workspace, trafficgroup etc
- cluster_state: One grpc connection with each edge for pushing learned cluster state(service discovery) from all other peer edges. In addition, one more grpc connection with the mpc for pushing all the learned cluster states to the tsb server.
count of edge_config_distribution will be equal to the number of edges connected to the central count of cluster_state connections will be one more that count of edge_config_distribution connections because of additional mpc connection.
IMPORTANT NOTE: If the cluster is not onboarded(TSB cluster object missing), but the edge is up and connected to central, in that scenario connection counts will include such edges
| Metric Name | Labels | PromQL Expression |
|---|---|---|
xcp_central_current_edge_connections | connection_type | xcp_central_current_edge_connections{connection_type="edge_config_distribution"} OR on() vector(0) |
xcp_central_current_edge_connections | connection_type | xcp_central_current_edge_connections{connection_type="cluster_state"} OR on() vector(0) |
Pending on reference configurations
Pending on reference configurations are configs referring to a missing configuration in the TSB hierarchy. The configs are propagated to edges with missing reference resolution metadata. Currently, only Security Settings refer other configurations. These metrics show which configurations are currently in PendingOnRef state, and the missing Parent group configuration due to which this is in PendingOnRef state.
| Metric Name | Labels | PromQL Expression |
|---|---|---|
xcp_central_pending_on_ref_configs_total | N/A | xcp_central_pending_on_ref_configs_total |
validation webhook passed count in last 5 min
count of requests that validation webhook passed in last 5 minutes by GVK
| Metric Name | Labels | PromQL Expression |
|---|---|---|
xcp_central_validation_webhook_passed_count | N/A | increase(xcp_central_validation_webhook_passed_count[5m]) OR on() vector(0) |
New connections per min(cluster state pushing and config pushing)
In steady state, edges should be reconnecting continuously to central for cluster state and config streams. Therefore, rate must be 0.
| Metric Name | Labels | PromQL Expression |
|---|---|---|
xcp_central_connection_register_count_total | connection_type | rate(xcp_central_connection_register_count_total{connection_type="cluster_state"}[1m]) * 60 |
xcp_central_connection_register_count_total | connection_type | rate(xcp_central_connection_register_count_total{connection_type="edge_config_distribution"}[1m]) * 60 |
Connection Push timeouts[5m]
This Panel represents the connection push timeouts in the last 5 minutes in Central grouped by connection types and peer cluster name.
There are two types of connections: Config Propagation and Cluster State Propagation. If the propagation of data(cluster_state/config_propagation) takes more than the configured timeout duration(2 mins by default), central drops the push. This metric can highlight if pushes of certain connection types are failing in certain edges, helping narrow down the problematic component. The push can get a timeout if the previous send to the edge is taking too long.
| Metric Name | Labels | PromQL Expression |
|---|---|---|
xcp_central_connection_push_timeout_count | N/A | sum by(connection_type, peer_cluster_name) (increase(xcp_central_connection_push_timeout_count[5m])) |
All goroutines
| Metric Name | Labels | PromQL Expression |
|---|---|---|
go_goroutines | component plane | go_goroutines{component="xcp",plane="management"} |
Rate of webhook validation errors
Rate of webhook validation errors by GVK
| Metric Name | Labels | PromQL Expression |
|---|---|---|
xcp_central_validation_webhook_failed_count | N/A | increase(xcp_central_validation_webhook_failed_count[5m]) OR on() vector(0) |
xcp_central_validation_webhook_http_error_count | N/A | increase(xcp_central_validation_webhook_http_error_count[5m]) OR on() vector(0) |
Central memory consumption
| Metric Name | Labels | PromQL Expression |
|---|---|---|
go_memstats_heap_inuse_bytes | component plane | go_memstats_heap_inuse_bytes{component="xcp",plane="management"} |
go_memstats_stack_inuse_bytes | component plane | go_memstats_stack_inuse_bytes{component="xcp",plane="management"} |
Central specific goroutines
This shows the number of active goroutines in XCP Central that are responsible for config pushes to edges.
| Metric Name | Labels | PromQL Expression |
|---|---|---|
go_goroutines | component plane | increase(go_goroutines{component="xcp",plane="management"}[1m]) |
xcp_central_go_routine_count_total | N/A | increase(xcp_central_go_routine_count_total[1m]) |
Edges' memory consumption
This shows the current memory usage for all Edges
| Metric Name | Labels | PromQL Expression |
|---|---|---|
go_memstats_heap_inuse_bytes | component plane | go_memstats_heap_inuse_bytes{component="xcp",plane="control"} |
Central CPU consumption
| Metric Name | Labels | PromQL Expression |
|---|---|---|
process_cpu_seconds_total | job | rate(process_cpu_seconds_total{job="central-xcp"}[1m]) |
All edges' CPU consumption
| Metric Name | Labels | PromQL Expression |
|---|---|---|
process_cpu_seconds_total | job | rate(process_cpu_seconds_total{job="edge-xcp"}[1m]) |
XCP Central Coordinator running
This panel represents if the XCP Central Coordinator is running across the Central instances.
| Metric Name | Labels | PromQL Expression |
|---|---|---|
xcp_central_ha_coordinator_up | N/A | avg by(instance) (xcp_central_ha_coordinator_up) |
XCP Central Leader
| Metric Name | Labels | PromQL Expression |
|---|---|---|
xcp_central_ha_coordinator_acting_as_leader | N/A | avg by(instance) (xcp_central_ha_coordinator_acting_as_leader) |
XCP Central Followers
| Metric Name | Labels | PromQL Expression |
|---|---|---|
xcp_central_ha_coordinator_acting_as_follower | N/A | avg by(instance) (xcp_central_ha_coordinator_acting_as_follower) |
XCP Central Coordinator Leader election loop[5m]
This panel represents how many times the XCP Central Coordinator started the leader election loop in the last 5 minutes.
| Metric Name | Labels | PromQL Expression |
|---|---|---|
xcp_central_ha_coordinator_leader_election_loops_total | N/A | sum by(instance) (increase(xcp_central_ha_coordinator_leader_election_loops_total[5m])) |
XCP Central Primary Relay Streams Total
This panel represents how many streams are open in the XCP Central Primary relay server.
As the leader's switch, the instance name will change.
| Metric Name | Labels | PromQL Expression |
|---|---|---|
xcp_central_ha_primary_relay_server_streams_total | N/A | sum by(instance) (xcp_central_ha_primary_relay_server_streams_total) |
Number of currently open relay streams at the H/A Primary (Relay Server)
This panel represents the currently open relay stream at the Primary relay server in the XCP Central instances.
| Metric Name | Labels | PromQL Expression |
|---|---|---|
xcp_central_ha_primary_relay_server_streams_open_count_total | N/A | sum by(instance) (xcp_central_ha_primary_relay_server_streams_open_count_total) |
Relay streams rejected by primary relay server
Total number of relay streams rejected by the H/A Primary (Relay Server) because the current XCP Central instance is not the H/A Leader
| Metric Name | Labels | PromQL Expression |
|---|---|---|
xcp_central_ha_primary_relay_server_streams_rejected_total | N/A | sum by(instance) (increase(xcp_central_ha_primary_relay_server_streams_rejected_total[5m])) |
Number of relay streams discontinued by primary relay server
Total number of relay streams closed forcibly by the H/A Primary (Relay Server) because current XCP Central instance stopped being the H/A Leader
| Metric Name | Labels | PromQL Expression |
|---|---|---|
xcp_central_ha_primary_relay_server_streams_discontinued_total | N/A | xcp_central_ha_primary_relay_server_streams_discontinued_total |
Total cluster states sent by primary relay server(Leader->Follower)[5m]
Total number of Cluster state updates pushed by the H/A Primary (Relay Server) to H/A Secondary(s) (Relay Client(s))
| Metric Name | Labels | PromQL Expression |
|---|---|---|
xcp_central_ha_primary_relay_server_cluster_states_sent_total | N/A | sum by(instance) (increase(xcp_central_ha_primary_relay_server_cluster_states_sent_total[5m])) |
Cluster States received by primary relay server(Follower->Leader)[5m]
Total number of Cluster state updates received by the H/A Primary (Relay Server) from H/A Secondary(s) (Relay Client(s))
| Metric Name | Labels | PromQL Expression |
|---|---|---|
xcp_central_ha_primary_relay_server_cluster_states_received_total | N/A | sum by(instance) (increase(xcp_central_ha_primary_relay_server_cluster_states_received_total[5m])) |
Number of cluster state is sent by primary to Secondary for Different CPs[5m]
Total number of times a Cluster state has been pushed by the H/A Primary (Relay Server) to H/A Secondary(s) (Relay Client(s))
| Metric Name | Labels | PromQL Expression |
|---|---|---|
xcp_central_ha_primary_relay_server_cluster_state_sent_total | N/A | sum by(cluster) (increase(xcp_central_ha_primary_relay_server_cluster_state_sent_total[5m])) |
Number of cluster states received by primary from secondaries for different CP[5m]
Total number of times a Cluster state has been received by the H/A Primary (Relay Server) from H/A Secondary(s) (Relay Client(s))
| Metric Name | Labels | PromQL Expression |
|---|---|---|
xcp_central_ha_primary_relay_server_cluster_state_received_total | N/A | sum by(cluster) (increase(xcp_central_ha_primary_relay_server_cluster_state_received_total[5m])) |
Secondary relay client running
Flag indicating whether H/A Secondary (Relay Client) is running
| Metric Name | Labels | PromQL Expression |
|---|---|---|
xcp_central_ha_secondary_relay_client_up | N/A | avg by(instance) (xcp_central_ha_secondary_relay_client_up) |
Total number of Second relay client stream
Total number of relay streams opened by the H/A Secondary (Relay Client)
| Metric Name | Labels | PromQL Expression |
|---|---|---|
xcp_central_ha_secondary_relay_client_streams_total | N/A | avg by(instance) (xcp_central_ha_secondary_relay_client_streams_total) |
Number of open relay stream by secondary relay client
Number of currently open relay streams by the H/A Secondary (Relay Client)
| Metric Name | Labels | PromQL Expression |
|---|---|---|
xcp_central_ha_secondary_relay_client_streams_open_count_total | N/A | sum by(instance) (xcp_central_ha_secondary_relay_client_streams_open_count_total) |
Number of cluster state updates recvd by secondary relay client from Primary[5m]
Total number of Cluster state updates received by the H/A Secondary (Relay Client) from the H/A Primary (Relay Server)
| Metric Name | Labels | PromQL Expression |
|---|---|---|
xcp_central_ha_secondary_relay_client_cluster_states_received_total | N/A | sum by(instance) (increase(xcp_central_ha_secondary_relay_client_cluster_states_received_total[5m])) |
Number of cluster states sent by secondary relay client to primary[5m]
Total number of Cluster state updates pushed by the H/A Secondary (Relay Client) to the H/A Primary (Relay Server)
| Metric Name | Labels | PromQL Expression |
|---|---|---|
xcp_central_ha_secondary_relay_client_cluster_states_sent_total | N/A | sum by(instance) (increase(xcp_central_ha_secondary_relay_client_cluster_states_sent_total[5m])) |
Number of cluster state updates recvd by secondary client from primary for different CPs[5m]
Total number of times a Cluster state has been received by the H/A Secondary (Relay Client) from the H/A Primary (Relay Server)
| Metric Name | Labels | PromQL Expression |
|---|---|---|
xcp_central_ha_secondary_relay_client_cluster_state_received_total | N/A | sum by(cluster) (increase(xcp_central_ha_secondary_relay_client_cluster_state_received_total[5m])) |
Number of cluster state updates sent by secondary relay to primary relay for different CPs[5m]
Total number of times a Cluster state has been pushed by the H/A Secondary (Relay Client) to the H/A Primary (Relay Server)
| Metric Name | Labels | PromQL Expression |
|---|---|---|
xcp_central_ha_secondary_relay_client_cluster_state_sent_total | N/A | sum by(cluster) (increase(xcp_central_ha_secondary_relay_client_cluster_state_sent_total[5m])) |
XCP Central Cross Partition enabled
Flag indicating whether support for Cross-Partition H/A is enabled
| Metric Name | Labels | PromQL Expression |
|---|---|---|
xcp_central_ha_cross_partition_enabled | N/A | avg(xcp_central_ha_cross_partition_enabled) |
Total number of relay streams by H/A Cross-Paritition Requestor
Total number of relay streams opened by the H/A Cross-Partition Requestor (Relay Client)
| Metric Name | Labels | PromQL Expression |
|---|---|---|
xcp_central_ha_cross_partition_requestor_relay_client_streams_total | N/A | avg by(instance) (xcp_central_ha_cross_partition_requestor_relay_client_streams_total) |
Number of open streams by Cross-partition requestor
Number of currently open relay streams by the H/A Cross-Partition Requestor (Relay Client)
| Metric Name | Labels | PromQL Expression |
|---|---|---|
xcp_central_ha_cross_partition_requestor_relay_client_streams_open_count | N/A | sum by(instance) (xcp_central_ha_cross_partition_requestor_relay_client_streams_open_count) |
Number of cluster state updates recvd by H/A Cross-partition requestor[5m]
Total number of Cluster state updates received by the H/A Cross-Partition Requestor (Relay Client) from the H/A Cross-Partition Responder (Relay Server)
| Metric Name | Labels | PromQL Expression |
|---|---|---|
xcp_central_ha_cross_partition_requestor_relay_client_cluster_states_received_total | N/A | sum by(instance) (increase(xcp_central_ha_cross_partition_requestor_relay_client_cluster_states_received_total[5m])) |
Number of cluster state updates recvd by H/A Cross partition requestor for different CPs[5m]
Total number of times a Cluster state has been received by the H/A Cross-Partition Requestor (Relay Client) from the H/A Cross-Partition Responder (Relay Server)
| Metric Name | Labels | PromQL Expression |
|---|---|---|
xcp_central_ha_cross_partition_requestor_relay_client_cluster_state_received_total | N/A | sum by(cluster) (increase(xcp_central_ha_cross_partition_requestor_relay_client_cluster_state_received_total[5m])) |
Total number of relay streams by H/A Cross-Paritition Responder
Total number of relay streams opened by the H/A Cross-Partition Responder (Relay Client)
| Metric Name | Labels | PromQL Expression |
|---|---|---|
xcp_central_ha_cross_partition_responder_relay_server_streams_total | N/A | avg by(instance) (xcp_central_ha_cross_partition_responder_relay_server_streams_total) |
Number of open streams by Cross-partition responder
Number of currently open relay streams at the H/A Cross-Partition Responder (Relay Server)
| Metric Name | Labels | PromQL Expression |
|---|---|---|
xcp_central_ha_cross_partition_requestor_relay_client_streams_open_count | N/A | sum by(instance) (xcp_central_ha_cross_partition_requestor_relay_client_streams_open_count) |
Number of cluster state updates sent by H/A Cross-partition responder[5m]
Total number of Cluster state updates sent by the H/A Cross-Partition Responder (Relay Client) to the H/A Cross-Partition Requestor (Relay Server)
| Metric Name | Labels | PromQL Expression |
|---|---|---|
xcp_central_ha_cross_partition_responder_relay_server_cluster_states_sent_total | N/A | sum by(instance) (increase(xcp_central_ha_cross_partition_responder_relay_server_cluster_states_sent_total[5m])) |
Number of cluster state updates sent by H/A Cross partition responder for different CPs[5m]
Total number of times a Cluster state has been sent by the H/A Cross-Partition Responder (Relay Client) to the H/A Cross-Partition Requestor (Relay Server)
| Metric Name | Labels | PromQL Expression |
|---|---|---|
xcp_central_ha_cross_partition_responder_relay_server_cluster_state_sent_total | N/A | sum by(cluster) (increase(xcp_central_ha_cross_partition_responder_relay_server_cluster_state_sent_total[5m])) |
XCP Edge status
| Metric Name | Labels | PromQL Expression |
|---|---|---|
process_start_time_seconds | cluster_name component | time() - process_start_time_seconds{cluster_name="$cluster",component="xcp"} |
XCP Edge Version
| Metric Name | Labels | PromQL Expression |
|---|---|---|
xcp_edge_istio_versions | cluster_name | label_replace(xcp_edge_istio_versions{cluster_name="$cluster"}, "istio_versions", "$1", "version", "(.*)") |
xcp_edge_version | cluster_name | label_replace(xcp_edge_version{cluster_name="$cluster"}, "xcp_version", "$1", "version", "(.*)") |
Number of gatewayHost exposed
| Metric Name | Labels | PromQL Expression |
|---|---|---|
xcp_edge_gateway_hosts_count | cluster_name | xcp_edge_gateway_hosts_count{cluster_name="$cluster"} |
Active connections to central
Current peer connections this edge holds against remote edges.
| Metric Name | Labels | PromQL Expression |
|---|---|---|
xcp_edge_stream_connect_count_total | cluster_name statusLabel | xcp_edge_stream_connect_count_total{statusLabel="ok", cluster_name="$cluster"} - ignoring(statusLabel) xcp_edge_stream_connect_count_total{statusLabel="close", cluster_name="$cluster"} OR on() xcp_edge_stream_connect_count_total{statusLabel="ok", cluster_name="$cluster"} |
Time since any message sent to central on config stream (seconds)
Time since any of the following messages is sent by edge to central:
- Periodic(per minute) config resync request
- Ack of last config received
- Cluster state Because regular periodic resync requests would be going out periodically, a high value than the resync period, 60 sec default, is not normal.
| Metric Name | Labels | PromQL Expression |
|---|---|---|
xcp_edge_last_config_resync_to_central_timestamp_ms | cluster_name | time() - xcp_edge_last_config_resync_to_central_timestamp_ms{cluster_name="$cluster"} / 1000 |
xcp_edge_last_push_to_central_timestamp_ms | cluster_name | time() - xcp_edge_last_push_to_central_timestamp_ms{cluster_name="$cluster"} / 1000 |
cluster-state build time percentiles(in secs)
Time (in ms) taken to build the local cluster state. This build time is subset of cluster-update-propagation time
| Metric Name | Labels | PromQL Expression |
|---|---|---|
xcp_edge_cluster_state_build_time_secs_bucket | cluster_name | histogram_quantile(0.5,sum(xcp_edge_cluster_state_build_time_secs_bucket{cluster_name="$cluster"}) by (le)) |
xcp_edge_cluster_state_build_time_secs_bucket | cluster_name | histogram_quantile(0.9,sum(xcp_edge_cluster_state_build_time_secs_bucket{cluster_name="$cluster"}) by (le)) |
xcp_edge_cluster_state_build_time_secs_bucket | cluster_name | histogram_quantile(0.95,sum(xcp_edge_cluster_state_build_time_secs_bucket{cluster_name="$cluster"}) by (le)) |
xcp_edge_cluster_state_build_time_secs_bucket | cluster_name | histogram_quantile(0.99,sum(xcp_edge_cluster_state_build_time_secs_bucket{cluster_name="$cluster"}) by (le)) |
xcp_edge_cluster_state_build_time_secs_bucket | cluster_name | histogram_quantile(1,sum(xcp_edge_cluster_state_build_time_secs_bucket{cluster_name="$cluster"}) by (le)) |
Number of times cluster states sent to central
| Metric Name | Labels | PromQL Expression |
|---|---|---|
xcp_edge_local_cluster_update_propagation_time_secs_count | cluster_name | sum(xcp_edge_local_cluster_update_propagation_time_secs_count{cluster_name="$cluster"}) by (trigger_reason) |
cluster-state propagation delay percentiles(in secs)
Time (in ms) taken to propagate a change in the local cluster state to remote central
| Metric Name | Labels | PromQL Expression |
|---|---|---|
xcp_edge_local_cluster_update_propagation_time_secs_bucket | cluster_name | histogram_quantile(0.5,sum(xcp_edge_local_cluster_update_propagation_time_secs_bucket{cluster_name="$cluster"}) by (le)) |
xcp_edge_local_cluster_update_propagation_time_secs_bucket | cluster_name | histogram_quantile(0.9,sum(xcp_edge_local_cluster_update_propagation_time_secs_bucket{cluster_name="$cluster"}) by (le)) |
xcp_edge_local_cluster_update_propagation_time_secs_bucket | cluster_name | histogram_quantile(0.95,sum(xcp_edge_local_cluster_update_propagation_time_secs_bucket{cluster_name="$cluster"}) by (le)) |
xcp_edge_local_cluster_update_propagation_time_secs_bucket | cluster_name | histogram_quantile(0.99,sum(xcp_edge_local_cluster_update_propagation_time_secs_bucket{cluster_name="$cluster"}) by (le)) |
xcp_edge_local_cluster_update_propagation_time_secs_bucket | cluster_name | histogram_quantile(1,sum(xcp_edge_local_cluster_update_propagation_time_secs_bucket{cluster_name="$cluster"}) by (le)) |
propagated to central in 0-1.5 secs
Time (in ms) taken to propagate a change in the local cluster state to remote central
| Metric Name | Labels | PromQL Expression |
|---|---|---|
xcp_edge_local_cluster_update_propagation_time_secs_bucket | cluster_name le | sum(xcp_edge_local_cluster_update_propagation_time_secs_bucket{cluster_name="$cluster", le="1.5"}) by (trigger_reason) |
xcp_edge_local_cluster_update_propagation_time_secs_bucket | cluster_name le | xcp_edge_local_cluster_update_propagation_time_secs_bucket{cluster_name="$cluster", le="4"} - ignoring(le) xcp_edge_local_cluster_update_propagation_time_secs_bucket{cluster_name="$cluster", le="2"} |
Number of times config status sent by edge to central in last 5 min
Number of times config statuses are sent by edge to central, with respective objects' Kind.
Messages received by central from any edge are of three types:
- Periodic(per minute by default) config resync request
- cluster state
- Header message to ack the config received
This number is combined count of all three in the last 5 min.
| Metric Name | Labels | PromQL Expression |
|---|---|---|
xcp_edge_config_status_updates_sent_gvk_total | cluster_name | increase(xcp_edge_config_status_updates_sent_gvk_total{cluster_name="$cluster"}[5m]) |
propagated to central in 1.5-2.5 secs
Time (in ms) taken to propagate a change in the local cluster state to remote central
| Metric Name | Labels | PromQL Expression |
|---|---|---|
xcp_edge_local_cluster_update_propagation_time_secs_bucket | cluster_name le | sum(xcp_edge_local_cluster_update_propagation_time_secs_bucket{cluster_name="$cluster", le="2.5"} - ignoring(le,cluster_name) xcp_edge_local_cluster_update_propagation_time_secs_bucket{cluster_name="$cluster", le="1.5"}) by (trigger_reason) |
propagated to central in 2.5-4 secs
Time (in ms) taken to propagate a change in the local cluster state to remote central
| Metric Name | Labels | PromQL Expression |
|---|---|---|
xcp_edge_local_cluster_update_propagation_time_secs_bucket | cluster_name le | sum(xcp_edge_local_cluster_update_propagation_time_secs_bucket{cluster_name="$cluster", le="4"} - ignoring(le,cluster_name) xcp_edge_local_cluster_update_propagation_time_secs_bucket{cluster_name="$cluster", le="2.5"}) by (trigger_reason) |
Length of cluster state event queue
Length of the cluster state events queue at the current moment. This metric is useful to track the cluster state events currently in the queue and ready to be dequeued and sent to central. A high value of this metric means that events are getting enqueued but dequeuing is blocked because of some bottleneck at sending to the central part.
| Metric Name | Labels | PromQL Expression |
|---|---|---|
xcp_edge_current_state_state_events_queue_len | cluster_name | xcp_edge_current_state_state_events_queue_len{cluster_name="$cluster"} |
propagated to central in 4-7 secs
Time (in ms) taken to propagate a change in the local cluster state to remote central
| Metric Name | Labels | PromQL Expression |
|---|---|---|
xcp_edge_local_cluster_update_propagation_time_secs_bucket | cluster_name le | sum(xcp_edge_local_cluster_update_propagation_time_secs_bucket{cluster_name="$cluster", le="7"} - ignoring(le) xcp_edge_local_cluster_update_propagation_time_secs_bucket{cluster_name="$cluster", le="4"}) by (trigger_reason) |
propagated to central in 11-15 secs
Time (in ms) taken to propagate a change in the local cluster state to remote central
| Metric Name | Labels | PromQL Expression |
|---|---|---|
xcp_edge_local_cluster_update_propagation_time_secs_bucket | cluster_name le | sum(xcp_edge_local_cluster_update_propagation_time_secs_bucket{cluster_name="$cluster", le="15"} - ignoring(le) xcp_edge_local_cluster_update_propagation_time_secs_bucket{cluster_name="$cluster", le="11"}) by (trigger_reason) |
propagated to central in 7-11 secs
Time (in ms) taken to propagate a change in the local cluster state to remote central
| Metric Name | Labels | PromQL Expression |
|---|---|---|
xcp_edge_local_cluster_update_propagation_time_secs_bucket | cluster_name le | sum(xcp_edge_local_cluster_update_propagation_time_secs_bucket{cluster_name="$cluster", le="11"} - ignoring(le) xcp_edge_local_cluster_update_propagation_time_secs_bucket{cluster_name="$cluster", le="7"}) by (trigger_reason) |
propagated to central in 15-20 secs
Time (in ms) taken to propagate a change in the local cluster state to remote central
| Metric Name | Labels | PromQL Expression |
|---|---|---|
xcp_edge_local_cluster_update_propagation_time_secs_bucket | cluster_name le | sum(xcp_edge_local_cluster_update_propagation_time_secs_bucket{cluster_name="$cluster", le="20"} - ignoring(le) xcp_edge_local_cluster_update_propagation_time_secs_bucket{cluster_name="$cluster", le="15"}) by (trigger_reason) |
propagated to central in 20-30 secs
Time (in ms) taken to propagate a change in the local cluster state to remote central
| Metric Name | Labels | PromQL Expression |
|---|---|---|
xcp_edge_local_cluster_update_propagation_time_secs_bucket | cluster_name le | sum(xcp_edge_local_cluster_update_propagation_time_secs_bucket{cluster_name="$cluster", le="30"} - ignoring(le) xcp_edge_local_cluster_update_propagation_time_secs_bucket{cluster_name="$cluster", le="20"}) by (trigger_reason) |
propagated to central in 30-40 secs
Time (in secs) taken to propagate a change in the local cluster state to remote central
| Metric Name | Labels | PromQL Expression |
|---|---|---|
xcp_edge_local_cluster_update_propagation_time_secs_bucket | cluster_name le | sum(xcp_edge_local_cluster_update_propagation_time_secs_bucket{cluster_name="$cluster", le="40"} - ignoring(le) xcp_edge_local_cluster_update_propagation_time_secs_bucket{cluster_name="$cluster", le="30"}) by (trigger_reason) |
propagated to central in more than 40 secs
Time (in ms) taken to propagate a change in the local cluster state to remote central
| Metric Name | Labels | PromQL Expression |
|---|---|---|
xcp_edge_local_cluster_update_propagation_time_secs_bucket | cluster_name le | sum(xcp_edge_local_cluster_update_propagation_time_secs_count{cluster_name="$cluster"} - ignoring(le) xcp_edge_local_cluster_update_propagation_time_secs_bucket{cluster_name="$cluster", le="40"}) by (trigger_reason) |
xcp_edge_local_cluster_update_propagation_time_secs_count | cluster_name | sum(xcp_edge_local_cluster_update_propagation_time_secs_count{cluster_name="$cluster"} - ignoring(le) xcp_edge_local_cluster_update_propagation_time_secs_bucket{cluster_name="$cluster", le="40"}) by (trigger_reason) |
Number of times cluster states received by edge from central in last 1 min
Number of times cluster states are received by edge from central in the last 1 min.
| Metric Name | Labels | PromQL Expression |
|---|---|---|
xcp_edge_cluster_state_received_from_central_count_total | cluster_name | increase(xcp_edge_cluster_state_received_from_central_count_total{cluster_name="$cluster"}[1m]) |
config translation duration percentiles(in ms)
Total time taken in completing Istio translation for all the app namespaces
| Metric Name | Labels | PromQL Expression |
|---|---|---|
xcp_edge_total_translation_time_in_ms_bucket | cluster_name | histogram_quantile(0.5,sum(xcp_edge_total_translation_time_in_ms_bucket{cluster_name="$cluster"}) by (le)) |
xcp_edge_total_translation_time_in_ms_bucket | cluster_name | histogram_quantile(0.9,sum(xcp_edge_total_translation_time_in_ms_bucket{cluster_name="$cluster"}) by (le)) |
xcp_edge_total_translation_time_in_ms_bucket | cluster_name | histogram_quantile(0.95,sum(xcp_edge_total_translation_time_in_ms_bucket{cluster_name="$cluster"}) by (le)) |
xcp_edge_total_translation_time_in_ms_bucket | cluster_name | histogram_quantile(0.99,sum(xcp_edge_total_translation_time_in_ms_bucket{cluster_name="$cluster"}) by (le)) |
xcp_edge_total_translation_time_in_ms_bucket | cluster_name | histogram_quantile(1,sum(xcp_edge_total_translation_time_in_ms_bucket{cluster_name="$cluster"}) by (le)) |
Number of times config CRs received by edge from central in last 5 min
Number of times cluster states are received by edge from central
| Metric Name | Labels | PromQL Expression |
|---|---|---|
xcp_edge_config_updates_received_count_total | cluster_name | increase(xcp_edge_config_updates_received_count_total{cluster_name="$cluster"}[5m]) |
Translation count per min
Number of Istio config translations in Edge per namespace per min
| Metric Name | Labels | PromQL Expression |
|---|---|---|
xcp_edge_istio_translations_count_total | cluster_name | increase(xcp_edge_istio_translations_count_total{cluster_name="$cluster"}[1m]) |
Number of configs created/updated by edge at k8s apiserver every 5 minutes
Shows the activity of Edge creating objects in K8s API, grouped by object kind.
| Metric Name | Labels | PromQL Expression |
|---|---|---|
xcp_edge_cr_added_total | cluster_name | increase(xcp_edge_cr_added_total{cluster_name="$cluster"}[5m]) OR increase(xcp_edge_cr_updated_total{cluster_name="$cluster"}[5m]) |
xcp_edge_cr_updated_total | cluster_name | increase(xcp_edge_cr_added_total{cluster_name="$cluster"}[5m]) OR increase(xcp_edge_cr_updated_total{cluster_name="$cluster"}[5m]) |
Number of configs deleted by edge from k8s apiserver every 5 minutes
Shows the activity of Edge deleting objects in K8s API, grouped by object kind.
| Metric Name | Labels | PromQL Expression |
|---|---|---|
xcp_edge_cr_deleted_total | cluster_name | increase(xcp_edge_cr_deleted_total{cluster_name="$cluster"}[5m]) |
k8s config apply duration P50 percentiles for each namespace (in ms)
| Metric Name | Labels | PromQL Expression |
|---|---|---|
xcp_edge_k8s_configs_apply_time_secs_bucket | cluster_name | histogram_quantile(0.5,sum(xcp_edge_k8s_configs_apply_time_secs_bucket{cluster_name="$cluster"}) by (le,namespace)) |
xcp_edge_k8s_configs_apply_time_secs_bucket | cluster_name | histogram_quantile(0.9,sum(xcp_edge_k8s_configs_apply_time_secs_bucket{cluster_name="$cluster"}) by (le)) |
xcp_edge_k8s_configs_apply_time_secs_bucket | cluster_name | histogram_quantile(0.95,sum(xcp_edge_k8s_configs_apply_time_secs_bucket{cluster_name="$cluster"}) by (le)) |
xcp_edge_k8s_configs_apply_time_secs_bucket | cluster_name | histogram_quantile(0.99,sum(xcp_edge_k8s_configs_apply_time_secs_bucket{cluster_name="$cluster"}) by (le)) |
xcp_edge_k8s_configs_apply_time_secs_bucket | cluster_name | histogram_quantile(1,sum(xcp_edge_k8s_configs_apply_time_secs_bucket{cluster_name="$cluster"}) by (le)) |
k8s config apply duration P90 percentiles for each namespace (in ms)
| Metric Name | Labels | PromQL Expression |
|---|---|---|
xcp_edge_k8s_configs_apply_time_secs_bucket | cluster_name | histogram_quantile(0.9,sum(xcp_edge_k8s_configs_apply_time_secs_bucket{cluster_name="$cluster"}) by (le,namespace)) |
k8s config apply duration P99 percentiles for each namespace (in ms)
| Metric Name | Labels | PromQL Expression |
|---|---|---|
xcp_edge_k8s_configs_apply_time_secs_bucket | cluster_name | histogram_quantile(0.99,sum(xcp_edge_k8s_configs_apply_time_secs_bucket{cluster_name="$cluster"}) by (le,namespace)) |
xcp_edge_k8s_configs_apply_time_secs_bucket | cluster_name | histogram_quantile(0.9,sum(xcp_edge_k8s_configs_apply_time_secs_bucket{cluster_name="$cluster"}) by (le)) |
xcp_edge_k8s_configs_apply_time_secs_bucket | cluster_name | histogram_quantile(0.95,sum(xcp_edge_k8s_configs_apply_time_secs_bucket{cluster_name="$cluster"}) by (le)) |
xcp_edge_k8s_configs_apply_time_secs_bucket | cluster_name | histogram_quantile(0.99,sum(xcp_edge_k8s_configs_apply_time_secs_bucket{cluster_name="$cluster"}) by (le)) |
xcp_edge_k8s_configs_apply_time_secs_bucket | cluster_name | histogram_quantile(1,sum(xcp_edge_k8s_configs_apply_time_secs_bucket{cluster_name="$cluster"}) by (le)) |
All goroutines
| Metric Name | Labels | PromQL Expression |
|---|---|---|
go_goroutines | cluster_name component | go_goroutines{cluster_name="$cluster", component="xcp"} |
Edge specific gorountines
This shows the number of active goroutines in XCP Edge that are responsible for config translation.
| Metric Name | Labels | PromQL Expression |
|---|---|---|
xcp_edge_go_routine_count_total | cluster_name | increase(xcp_edge_go_routine_count_total{cluster_name="$cluster"}[1m]) |
Edge CPU consumption
| Metric Name | Labels | PromQL Expression |
|---|---|---|
process_cpu_seconds_total | cluster_name job | rate(process_cpu_seconds_total{job="edge-xcp",cluster_name="$cluster"}[1m]) |
Edge memory consumption
| Metric Name | Labels | PromQL Expression |
|---|---|---|
go_memstats_heap_inuse_bytes | cluster_name component | go_memstats_heap_inuse_bytes{component="xcp",cluster_name="$cluster"} |
go_memstats_stack_inuse_bytes | cluster_name component | go_memstats_stack_inuse_bytes{component="xcp",cluster_name="$cluster"} |
Custom Resource events[5m]
This panel represents the increase in custom resource events received by the edge registry controller in the last 5 minutes.
| Metric Name | Labels | PromQL Expression |
|---|---|---|
xcp_edge_registry_kubernetes_custom_resource_events_total | cluster_name | sum by(kind) (increase(xcp_edge_registry_kubernetes_custom_resource_events_total{cluster_name="$cluster"}[5m])) |
EDS Update events[5m]
This Panel represents the increase in EDS update events received by the Edge registry controller in the last 5 minutes.
| Metric Name | Labels | PromQL Expression |
|---|---|---|
xcp_edge_registry_kubernetes_eds_update_events_received_total | cluster_name | sum(rate(xcp_edge_registry_kubernetes_eds_update_events_received_total{cluster_name="$cluster"}[5m])) |
Namespace Events[5m]
This panel represents the increase in namespace events received by the Edge in the last 5-minute interval. Edge responds to the namespace events through its namespace controller.
| Metric Name | Labels | PromQL Expression |
|---|---|---|
xcp_edge_registry_kubernetes_namespace_events_received_total | cluster_name | sum by(event_type) (increase(xcp_edge_registry_kubernetes_namespace_events_received_total{cluster_name="$cluster"}[5m])) |
Node Events received[5m]
This panel represents the increase in node events received by the Edge Kubernetes registry controller in the last 5 minutes.
There are two different sources for node events. Edge responds differently for different node event sources:
- Node Controller: Used for Gateway Hold webhook
- XDS Updater Config Update: Used to update node port service addresses
| Metric Name | Labels | PromQL Expression |
|---|---|---|
xcp_edge_registry_kubernetes_node_events_received_total | cluster_name | sum by(node_event_source) (increase(xcp_edge_registry_kubernetes_node_events_received_total{cluster_name="$cluster"}[5m])) |
SvcUpdate events[5m]
This panel represents the Svc Update events received by the edge Kubernetes registry controller in 5-minute intervals.
| Metric Name | Labels | PromQL Expression |
|---|---|---|
xcp_edge_registry_kubernetes_svc_update_events_received_total | cluster_name | sum(increase(xcp_edge_registry_kubernetes_svc_update_events_received_total{cluster_name="$cluster"}[5m])) |
Service Entry events received[5m]
This Panel represents the increase in Service entry events received by the Edge Kubernetes registry controller in the last 5 minutes.
| Metric Name | Labels | PromQL Expression |
|---|---|---|
xcp_edge_registry_kubernetes_service_entry_events_received_total | cluster_name | sum by(event_type) (increase(xcp_edge_registry_kubernetes_service_entry_events_received_total{cluster_name="$cluster"}[5m])) |