Tetrate Service BridgeVersion: 1.13.x
Identify Underperforming Services
Service performance degradations can be very difficult to understand and isolate:
- There is far too much data to dig through to identify the cause of the performance issue
- The experts in the application's behavior (the dev team) typically do not have access to the running cluster
Tetrate Service Bridge provides a set of tools to:
- Enable the TSB operator to retrieve an archive of service performance data from a running cluster
- Enable application developers to query this data to identify the slowest transactions (or those with errors) and determine the call graph associated with the slow response.
Before you get started, make sure you:
✓ Familiarize yourself with TSB concepts
✓ Install the TSB demo environment
✓ Deploy the Istio Bookinfo sample app
Collecting data
The TSB operator can use tctl to collect the cluster state. This state includes proxy logs from the workloads, Istio controlplane information, node information, istioctl analyze and other runtime information. Data is exported as a tar file.
Usage:
  tctl collect [flags]

Examples:

# Collect without any obfuscation or redaction
tctl collect

# Collect without archiving results (useful for local debugging)
tctl collect --disable-archive

# Collect and redact with user-provided regex
tctl collect --redact-regexes <regex-one>,<regex-two>

# Collect and redact with presets
tctl collect --redact-presets networking
Running tctl collect requires admin permissions. The resulting tar file can be shared with application teams for analysis and interpretation, using tctl troubleshoot.
Analysing Data
Any user can then run tctl troubleshoot to inspect the collected tar file and generate a range of reports on the transactions recorded within the file:
- Dump the cluster information to identify workloads
- Analyse requests to named workloads to identify slowest responses and error responses
- Discriminate between sidecar performance and application performance
- Obtain request IDs, and then generate full traces for these requests (call graph)
Analyzing Cluster data
Usage:
  tctl experimental troubleshoot log-explorer cluster [flags]

Examples:
  tctl experimental troubleshoot log-explorer cluster [tar file]

Flags:
  -h, --help               help for cluster
  -n, --namespace string   List details of only specified namespace
      --workspace string   List details of only specified workspace
troubleshoot log-explorer cluster provides details of all workloads running in the cluster. Users can get a subset of the entire cluster state by applying filters like --workspace or --namespace.
$: tctl experimental troubleshoot log-explorer cluster tctl-debug-1664467971183386000.tar.gz --workspace organizations/tetrate/tenants/payment/workspaces/payment-ws
namespaces:
    payment-channel:
        services:
            details:
                pods:
                - details-v1-7d88846999-wgmSV
            productpage:
                pods:
                - productpage-v1-7795568889-tghhb
            ratings:
                pods:
                - ratings-v1-754f9c4975-x9h86
            tsb-gateway-bookinfo:
                pods:
                - tsb-gateway-bookinfo-6c46758bf6-5q6vw
    payment-offers:
        services:
            reviews:
                pods:
                - reviews-primary-54c7dd49dc-8658t
            reviews-canary:
                pods: []
            reviews-primary:
                pods:
                - reviews-primary-54c7dd49dc-8658t
nodes:
- gke-cp-cluster-1-default-pool-1119254c-w7i
- gke-cp-cluster-1-default-pool-a03a3024-7519
- gke-cp-cluster-1-default-pool-a03a3024-btfs
- gke-cp-cluster-1-default-pool-e090b6ac-trp
workspaces:
- organizations/tetrate/tenants/payment/workspaces/payment-ws
Analyzing Service data
Usage:
  tctl experimental troubleshoot log-explorer service [flags]

Examples:
  tctl experimental log-explorer service [tar file] [service]

Flags:
      --all                Show all requests instead of just the longest ones and those with errors.
      --full-log           Print the full Envoy access log instead of a summary.
  -h, --help               help for service
      --limit int          Number of requests to show (defaults to 10)
  -n, --namespace string   The namespace containing the service.
troubleshoot log-explorer service provides details about the 10 longest requests. It outputs a summary of time elapsed within the envoy sidecar and within the application service.
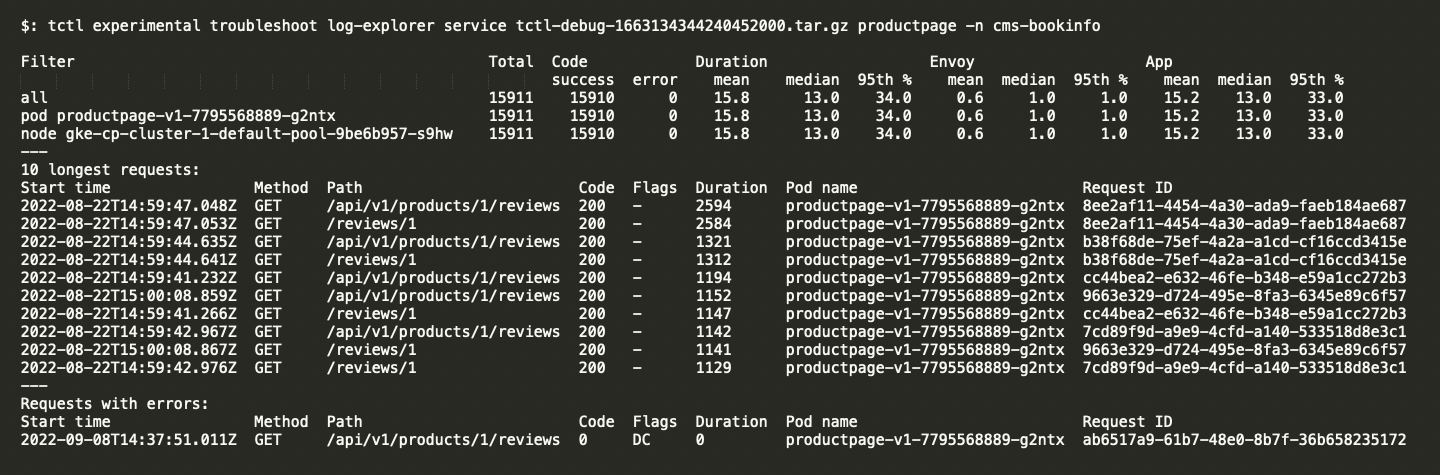
With this report, users can obtain the Request IDs of the longest time consuming requests, for analysis in the next step. The --full-log flag can also be used to access the Envoy request log information.
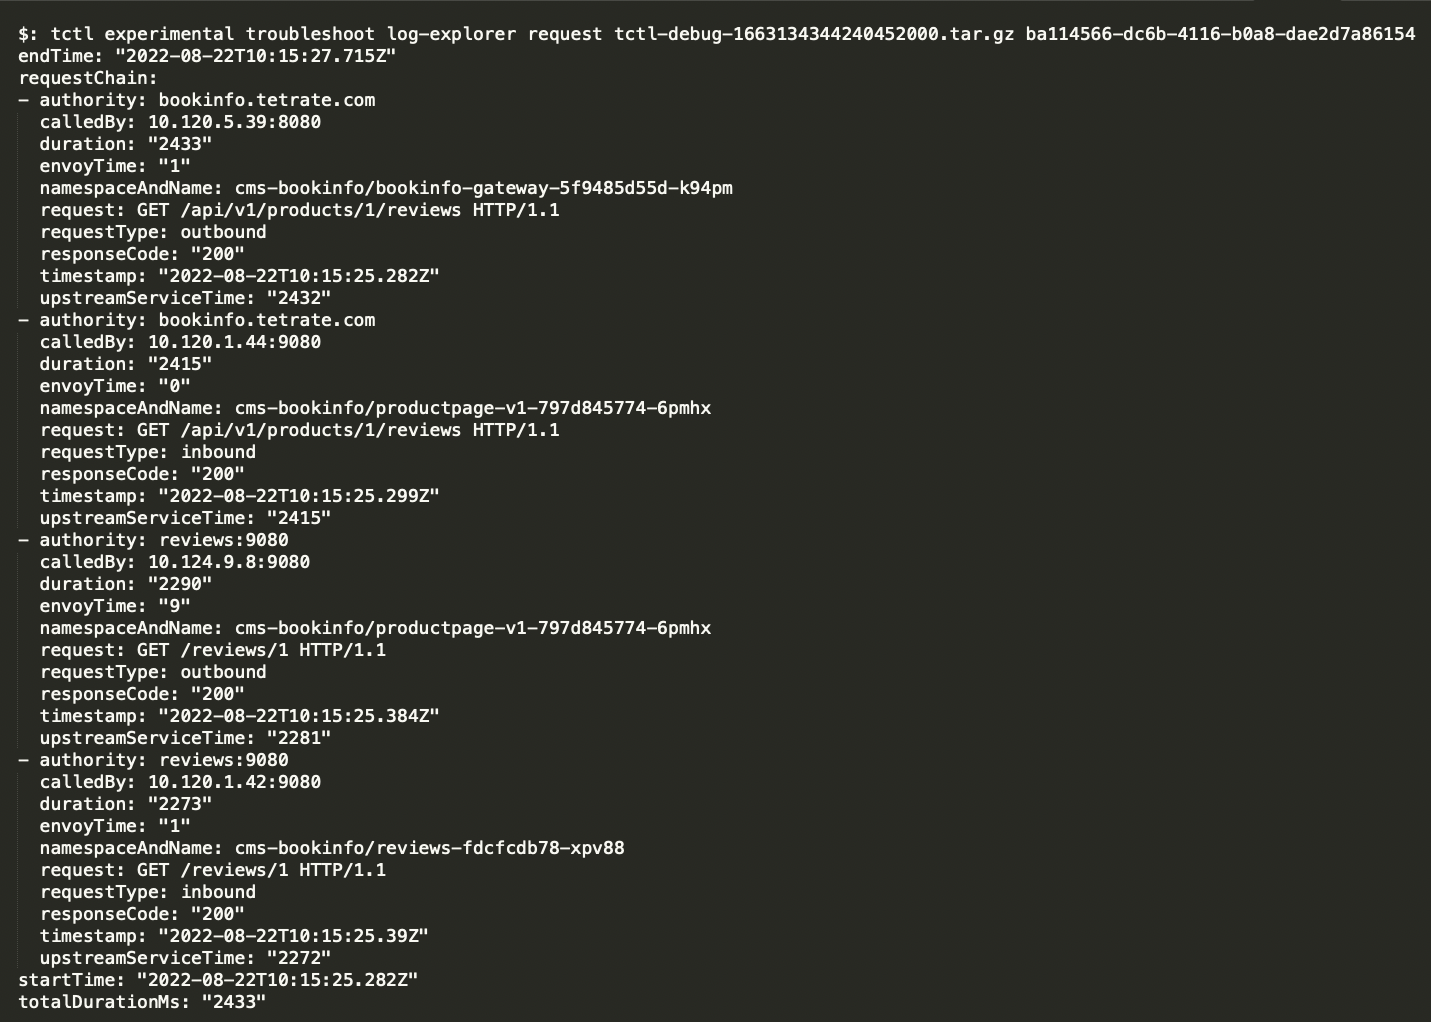
Analyzing Request data
 Usage:
  tctl experimental troubleshoot log-explorer request [flags]

Examples:
  tctl experimental log-explorer request [tar file] [requestID]

Flags:
  -h, --help                 help for request
  -o, --output-type string   Select the output type, available formats json and yaml, default format is yaml (default "yaml")
troubleshoot log-explorer request reports the trace for a single request identified by the provided requestID. It outputs the chain of requests, starting from the IngressGateway Pod IP to the final application workload. The report presents the total time spent by the Envoy sidecar, and the Application services along with details like requestType to indicate whether a request is inbound or outbound, namespace and name of the workload and calledBy IP & Port etc.