 Tetrate Service BridgeVersion: 1.6.x
Basic troubleshooting
This document explains some possible ways to do basic troubleshooting in TSB in order to find misconfiguration issues for a given route or common causes for 50x errors.
System architecture
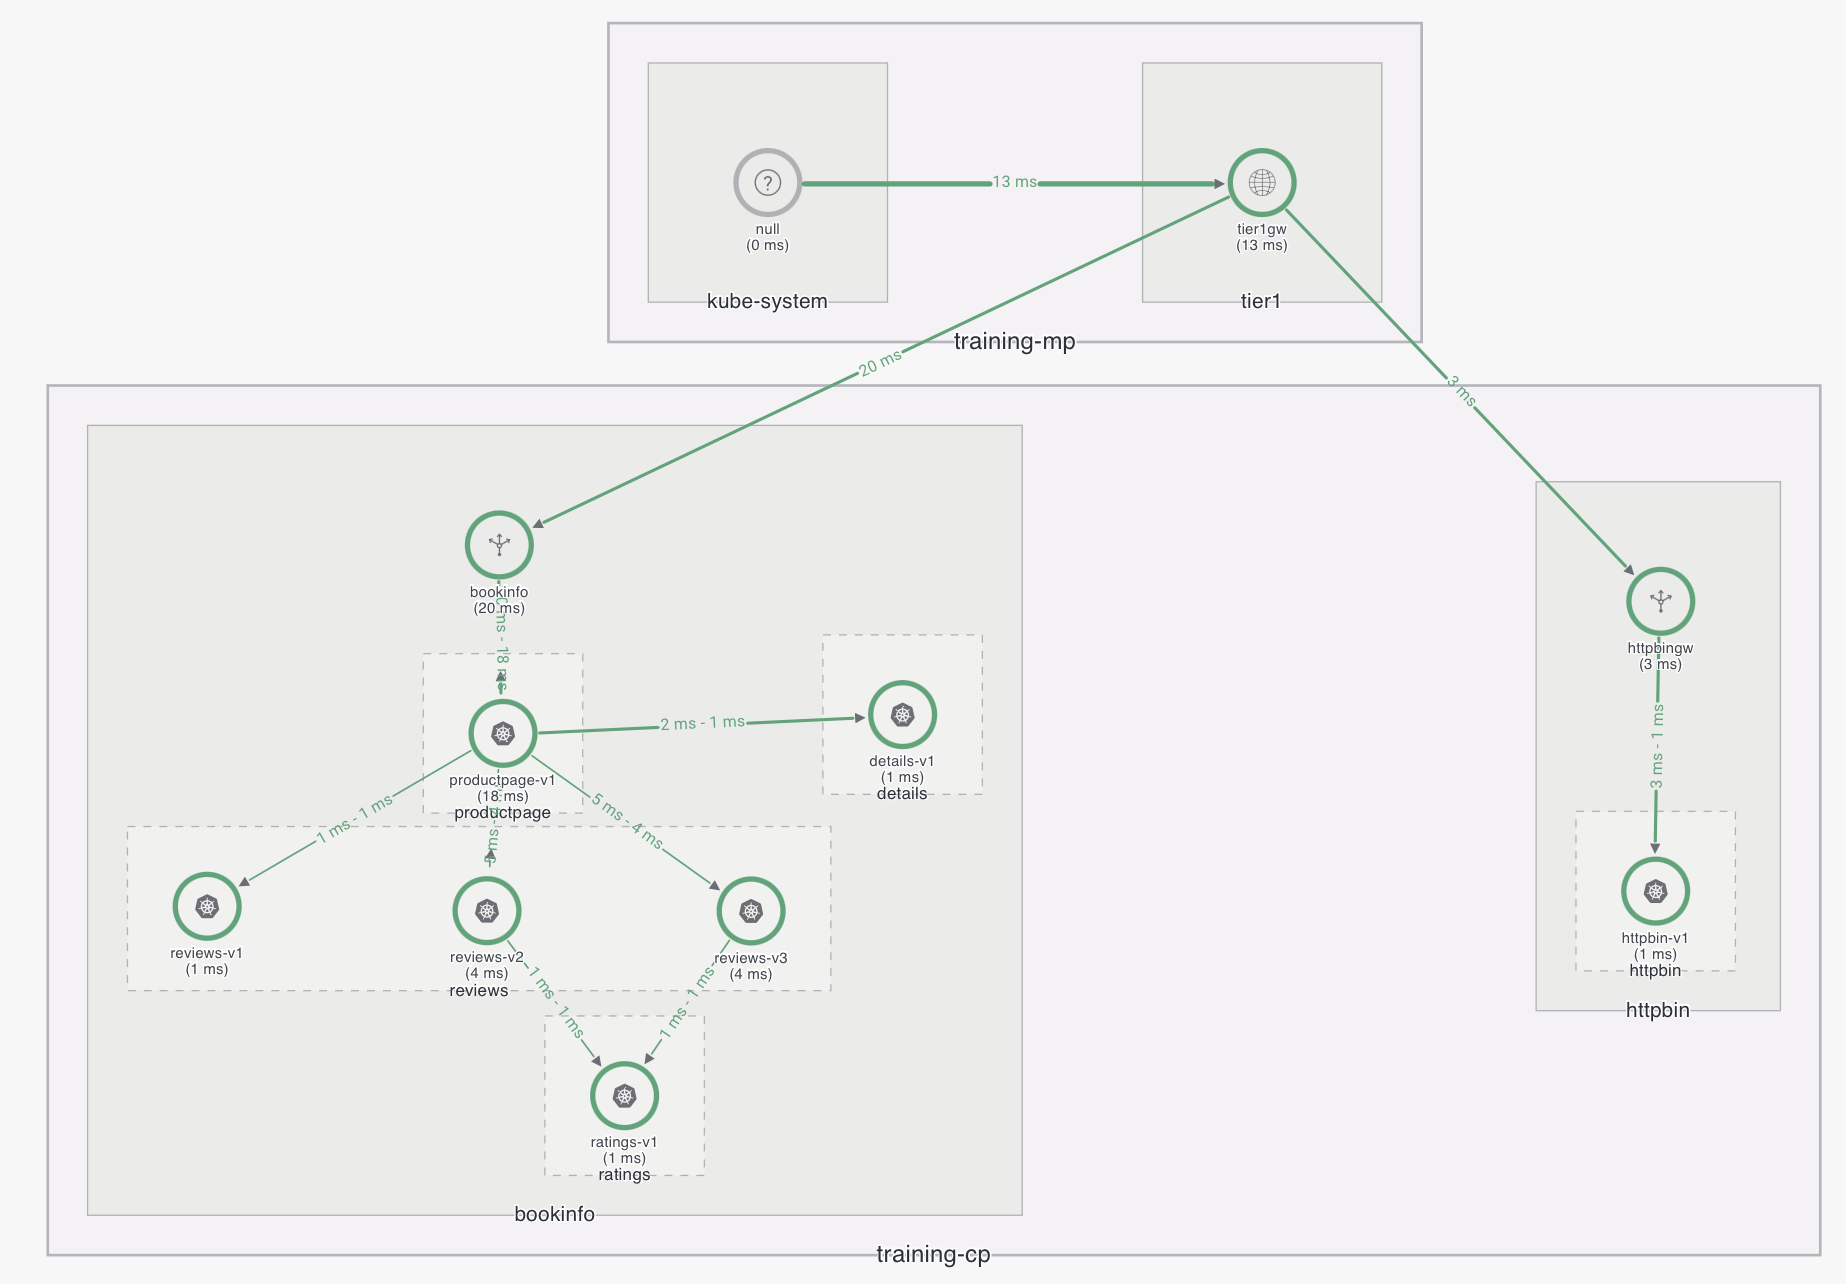
In this document the following system architecture with Tier1-Tier2 setup:
There are two different clusters, training-mp which contains the management plane and a control plane configured as tier1, and training-cp which is configured as tier2 and contains bookinfo and httpbin applications.
Tier1 Gateway troubleshooting
When a 50x error is detected it is important to understand the error message, as it will point us to different sources.
For example, suppose you issued an HTTP request using curl to one of the services
controlled by TSB, and you observe an error like the following:
Failed to connect to <hostname> port <port>: Connection refused
This usually means that there is no listener configured. This in turn would mean that we are either:
- Missing the gateway object
- Accessing the wrong port
- The gateway is not correctly configured, or
- The pod for the Tier1 Gateway is not running.
To check if the listener exists you can use istioctl:
istioctl pc listener <ingressgateway>.<namespace>
If there is no listener or you want to check the current configuration, you need to review your gateway configuration. To fetch the Gateway object, use kubectl:
kubectl get gateway
If the gateway does not exist, you will need to troubleshoot why XCP is not creating the configurations.
In this case, locate the mpc pod in the management plane namespace, and look for webhook errors that could point to the wrong configuration.
If the gateway and virtual service are created, but you are still getting 50x errors in your HTTP request such as the following, you will need to dig further for more information.
HTTP/2 503
In this case look at the ingressgateway logs. Because in this particular case the system is configured in a tier1-tier2 is setup, the first thing that should be checked is the tier1gateway.
Find the logs from the corresponding pod. Depending on the nature of the issue, you may have to enable trace logs for further investigation.
If you find an entry like the following, this means that there is no route to find the tier2 gateway.
HTTP/2" 503 NR
If this is the case, try checking the following:
Make sure nodeSelector annotations have been applied
If using NodePort for your XCP-edge services, remember that you must add the following annotation in both tier1 and tier2:
traffic.istio.io/nodeSelector: {"value":"value"}'
Check the tier1gateway configuration.
Tier1 gateways can be configured to route traffic to a specific cluster name or use a label.
Make sure that the cluster or label names are correct by inspecting spec.externalServers.name[x].clusters
field in the tier1gateway configuration.
You might fetch the tier1gateway object by using the following command:
tctl get t1 -w <workspace> -l <gatewaygroup> <name> -o yaml
  …
  externalServers:
  - clusters:
    - name: training-cp
    hostname: bookinfo
    …
  - clusters:
    - labels:
        tier: tier2
    hostname: httpbin
    …
And compare this with the cluster object:
tctl get cluster <name> -o yaml
…
metadata:
  labels:
    tier: tier2
  name: training-cp
…
Check permissions for communication between networks
If you have a network defined in your cluster object, and the participating clusters do not all share the same network, check if an organization setting exists to allow communication between the different networks.
tctl get os
Once this is fixed, you should see the service created in the namespace xcp-multicluster. This service entry is created for multi-cluster purposes along the destination rule in the application namespace to set mTLS.
If at this point you are still noticing 503 errors from the tier1gateway, check the error code to better understand what might be causing the error.
It's also useful to use istioctl command at this point, as most likely, in tier1 - tier2 scenarios, you will have some issue with the downstream.
First check if your tier1gateway's configuration has been synced by checking the presence of SYNC in the status.
You can verify that the configuration is being properly received from istiod:
istioctl ps
Verify that the route you are trying to access exists:
istioctl pc route <ingressgateway>.<namespace>
If the route does not exist, you have a misconfiguration in the tier1gateway object.
If it does, check the cluster for the service:
istioctl pc cluster <ingressgateway>.<namespace>
You should be able to see the subset and destination rule in the output of the above command. Check that the configuration of the destination rule is correct.
Finally, check the endpoints. Check the configuration to see if the downstream is healthy:
istioctl pc endpoint <ingressgateway>.<namespace>
If all of the above seems correct, then it is likely that you have to look at the tier2gateway.
Check in the tier1gateway logs if you have an error resembling the following:
HTTP/2" 503 LR,URX
This likely means that there is a timeout connecting from tier1gateway to tier2gateway. Check with netcat if you can access tier2gateway. If you are not successful at connecting to tier2gateway, there could be a misconfiguration or there could be a firewall in between blocking communication.
Another hint that you may be able to find is in the ingressgateway logs.
If you find an error message resembling the following, it means that the cacert
secret in istio-system namespace is not signed by the same root (or intermediate)
CA in both clusters.
HTTP/2" 503 UF,URX "-" "TLS error: 268435581:SSL routines:OPENSSL_internal:CERTIFICATE_VERIFY_FAILED"
If you make changes to the certificates, you will either need to restart all sidecars and gateways, or
wait for 30 minutes until the components pull the new certificates from istiod. The interval
between these updates can be configured, but the default value is 30 minutes.
Tier2Gateway troubleshooting
If debugging the tier1gateway was not been enough to fix the problem, you will have to
perform mostly similar exercise as you have done on tier2gateway, and understand
if your problem stems from a misconfiguration or a configuration propagation issue (i.e. XCP)
Check if the gateway has been created in the tier2 namespace with kubectl get gateway.
If the gateways does not exist, check on the XCP side. From the mpc pod in the management plane namespace you can also see if there is any webhook issue.
If the gateway has been created, verify that the listeners are created properly.
istioctl pc listener <ingressgateway>.<namespace>
A listener for port 15443 must also be included in the ingressgateway resource, as traffic from tier1 to tier2 will need to use this port. It is also important to check that port 15443 is specified as the first entry in the list of listeners, as some cloud vendors uses the first port for load balancer health checks.
If your problems still persist after you have checked that the listeners are created properly, you will need to check the tier2gateway logs. If you see 50x errors in these logs, it is likely that there issues with the application itself or there are configuration propagation issues from istiod to tier2gateway.
If further troubleshooting is needed, then you will need to enable trace logs to be able to find the root cause:
kubectl exec <pod> -c istio-proxy -- pilot-agent request POST ‘logging?level=trace'
You can also check if configuration is being received from istiod:
istioctl ps
If the configuration have not been synced properly, check if there are any networking conditions between istiod and the tier2gateway that could block the communication.
Also verify if istiod pod in istio-system namespace is up and running. You might have resource issues that may prevent the configurations from being sent.
In case you want to verify all the configuration in the tier2gateway for a particular hostname, you can get the config dump:
kubectl exec <pod> -c istio-proxy -- pilot-agent request GET config_dump > config_dump.json
XCP troubleshooting
If you notice that XCP is not creating the configurations that you expected,
check the mpc pod logs in the management plane namespace.
You may find validation errors in these logs, indicating problems transforming configurations from TSB to XCP API. For example, you might see long entries that resembles the following:
kubectl logs -n tsb <mpc>
2022-03-02T13:58:26.153872Z error mpc/config failed to convert TSB config into its XCP equivalent: no gateway object found for reference "httpbin/httpbin-gw" in "organizations/<org>/tenants/<tenant>/workspaces/<ws>/gatewaygroups/<gg>/virtualservices/<vs>"
If there are no webhook errors in mpc then check the logs for edge pod in the control plane namespace of the cluster where the configuration should be created.
If things are working, you should be able to see all the configurations applied to the istio-system namespace:
kubectl logs -n istio-system <edge>
2022-03-09T11:17:25.492365Z debug configapply ===BEGIN: Apply request for <n> objects in istio-system namespace
If the object that you are looking for does not appear in this list, it could be an issue in either XCP edge or XCP central.
To enable debug logs for XCP edge you can modify the deployment as follows (this will restart the pod):
kubectl edit deployment edge -n istio-system
Depending on what you want to troubleshoot, you may have to configure the loggers in more detail. For example, if you want to configure each loggers to a different logging level, you could use command like the following:
- --log_output_level
default:info,transform:info,discovery-server:info,configapply:debug,translator:debug,model:debug,istiod-discovery:error,cluster-gen:error,stream:debug
Or you could set the log level for all loggers at once:
- --log_output_level
- default:debug
If you want permanently change the logging configuration for all future XCP edge components, you can create an overlay for the control plane operator:
          overlays:
          - apiVersion: install.xcp.tetrate.io/v1alpha1
            kind: EdgeXcp
            name: edge-xcp
            patches:
            - path: spec.logLevels
              value: default:info,transform:info,discovery-server:info,configapply:debug,translator:debug,model:debug,istiod-discovery:error,cluster-gen:error,stream:debug
With XCP edge in debug mode, you should be able to see the error and determine if the root cause is in the cluster. If it is not in the cluster, you will have to perform the same exercise for XCP cetnral, located in the management plane namespace.