Enable Ambient Mode in TSB
In this guide, you will walk through the complete process of enabling Ambient mode in TSB - starting from preparing the Management Plane and Control Plane, to activating Ambient for workloads, and validating that the dataplane is functioning correctly. Once Ambient is enabled in your clusters, you can either:
- Deploy new applications directly into an Ambient enabled environment ( greenfield ) or
- Migrate existing sidecar-based applications incrementally to Ambient mode ( brownfield )
Prerequisites
Before enabling Ambient mode, ensure you have:
- Management Plane Setup: Configured with Ambient support as described in the Management Plane
- Control Plane Setup: Configured with Ambient support as described in the Control Plane
- Istio CNI: Enabled in the control plane clusters as described in the Istio CNI
- SPM Agent: Enabled in the control plane clusters as described in the requirement to enable the SPM agent
Ambient mode requires specific Management Plane and Control Plane configurations. Ensure you have followed the installation procedures with Ambient support enabled before proceeding.
Enable Ambient at Management Plane
For control plane clusters without Istio or operating in Ambient mode, ensure that the Management Plane is configured to accept SPM agent data. This can be enabled by including the following configuration under the OAP component.
components:
  oap:
    spmAgentReceiverEnabled: true
Enable Ambient at Control Plane
Configure the ControlPlane CR with Ambient enabled, Istio CNI enabled and the SPM agent activated as describe below. For clusters that do not run Istio, only the SPM Agent configuration is required.
Certain Kubernetes environments depending on the cloud provider that you use, require you to set various Istio configurations to have support for running Istio in Ambient mode.
Please refer Ambient Platform-Specific Prerequisites for more details.
components:
  istio:
    ambient:
      enable: true
    kubeSpec:
      CNI:
        binaryDirectory: /opt/cni/bin
        chained: true
        configurationDirectory: /etc/cni/net.d
  spmAgent:
    enabled: true
  xcp:
  .
  .
    overlays:
    - apiVersion: install.xcp.tetrate.io/v1alpha1
      kind: EdgeXcp
      name: edge-xcp
      patches:
      - path: spec.components.edgeServer.kubeSpec.deployment.env[-1]
          value:
          name: ENABLE_DNS_RESOLUTION_AT_EDGE
          value: "true"
Verify Ambient Components
Verify that ambient mode components are successfully installed and running.
Check ztunnel Daemonset
# status of ztunnel daemonset
kubectl get daemonset -n istio-system ztunnel
NAME      DESIRED   CURRENT   READY   UP-TO-DATE   AVAILABLE   NODE SELECTOR            AGE
ztunnel   2         2         2       2            2           kubernetes.io/os=linux   26h

# status of ztunnel daemonset pods
kubectl get pods -n istio-system -l app=ztunnel
NAME            READY   STATUS    RESTARTS   AGE
ztunnel-fnq2g   1/1     Running   0          26h
ztunnel-m4rsv   1/1     Running   0          26h
Check CNI plugin
#status of istio-cni-node daemonset
kubectl get daemonset -n istio-system istio-cni-node
NAME             DESIRED   CURRENT   READY   UP-TO-DATE   AVAILABLE   NODE SELECTOR            AGE
istio-cni-node   2         2         2       2            2           kubernetes.io/os=linux   26h

# status of istio-cni-node daemonset pods
kubectl get pods -n istio-system -l k8s-app=istio-cni-node
NAME                   READY   STATUS    RESTARTS   AGE
istio-cni-node-l8gfr   1/1     Running   0          25h
istio-cni-node-mlqc5   1/1     Running   0          25h
Enabling Ambient for Workloads
Once the control plane is configured, you can enable Ambient mode at different granularity levels.
Namespace-Level Enablement
To enable ambient mode for all workloads in a namespace, add the istio.io/dataplane-mode=ambient label:
kubectl label namespace <namespace-name> istio.io/dataplane-mode=ambient
Example:
kubectl label namespace client istio.io/dataplane-mode=ambient
kubectl label namespace server istio.io/dataplane-mode=ambient
Workload-Level Enablement
For more fine-graned control, you can enable ambient mode for specific workloads:
# For a specific deployment
kubectl label deployment <deployment-name> istio.io/dataplane-mode=ambient -n <namespace>

# For a specific pod
kubectl label pod <pod-name> istio.io/dataplane-mode=ambient -n <namespace>
Example:
kubectl label deployment payment-service istio.io/dataplane-mode=ambient -n payment
Verify Ambient Mode is Active
After enabling ambient mode, verify that your workloads are part of the ambient mesh by doing:
kubectl get pods -n <namespace> --show-labels
Verify that ztunnel is handling traffic for your pods
kubectl logs -l app=ztunnel -n istio-system
Ambient Migration Scenarios
This section demonstrates two common scenarios for adopting ambient mode:
- Greenfield: Deploying new applications directly with ambient mode
- Brownfield: Migrating existing sidecar-based applications to ambient mode
Greenfield Deployment
In a greenfield scenario, you are deploying new applications directly into ambient mode from the start.
Step 1: Deploy Applications
For this demo:
- We will deploy
sleepas a client service in theclientnamespace. - We will deploy
httpbinas the server in thehttpbinnamespace.
Deploy sleep service
kubectl create namespace client
kubectl label namespace client istio.io/dataplane-mode=ambient
kubectl apply -n client -f https://raw.githubusercontent.com/istio/istio/release-1.22/samples/sleep/sleep.yaml
Deploy httpbin service
kubectl create namespace httpbin
kubectl label namespace httpbin istio.io/dataplane-mode=ambient
kubectl apply -n httpbin -f https://raw.githubusercontent.com/istio/istio/release-1.22/samples/httpbin/httpbin.yaml
Step 2: Onboard Applications into TSB
Create TSB configurations for Tenant, Workspace & Group to onboard the services under client and httpbin namespaces into TSB.
Resources configured in DIRECT mode are not supported by TSB for automatic translation. These resources will not be automatically converted to work in Ambient mode.
To migrate them, you must manually update the policies to use targetRef and bind them to the appropriate waypoint Gateway.
Create TSB Configuration
Create TSB configurations for the Tenant & Workspace
- tctl
- kubectl (GitOps)
apiVersion: v1
kind: List
items:
  - apiVersion: api.tsb.tetrate.io/v2
    kind: Tenant
    metadata:
      name: my-tenant
      organization: my-organization
    spec:
      displayName: my-tenant
  - apiVersion: api.tsb.tetrate.io/v2
    kind: TenantSetting
    metadata:
      name: tenant-settings
      organization: my-organization
      tenant: my-tenant
    spec:
      defaultSecuritySetting:
        authenticationSettings:
          trafficMode: REQUIRED
  - apiVersion: api.tsb.tetrate.io/v2
    kind: Workspace
    metadata:
      name: client-ws
      organization: my-organization
      tenant: my-tenant
    spec:
      namespaceSelector:
        names:
          - "*/client"
      displayName: client-ws
  - apiVersion: api.tsb.tetrate.io/v2
    kind: Workspace
    metadata:
      name: httpbin-ws
      organization: tetrate
      tenant: my-tenant
    spec:
      namespaceSelector:
        names:
          - "*/httpbin"
      displayName: httpbin-ws
tctl apply -f tsb-config.yaml
apiVersion: v1
kind: List
items:
  - apiVersion: tsb.tetrate.io/v2
    kind: Tenant
    metadata:
      name: my-tenant
      annotations:
        tsb.tetrate.io/organization: my-organization
    spec:
      displayName: my-tenant
  - apiVersion: tsb.tetrate.io/v2
    kind: TenantSetting
    metadata:
      name: tenant-settings
      annotations:
        tsb.tetrate.io/organization: my-organization
        tsb.tetrate.io/tenant: my-tenant
    spec:
      defaultSecuritySetting:
        authenticationSettings:
          trafficMode: REQUIRED
  - apiVersion: tsb.tetrate.io/v2
    kind: Workspace
    metadata:
      name: client-ws
      annotations:
        tsb.tetrate.io/organization: my-organization
        tsb.tetrate.io/tenant: my-tenant
    spec:
      namespaceSelector:
        names:
          - "*/client"
      displayName: client-ws
  - apiVersion: tsb.tetrate.io/v2
    kind: Workspace
    metadata:
      name: httpbin-ws
      annotations:
        tsb.tetrate.io/organization: tetrate
        tsb.tetrate.io/tenant: my-tenant
    spec:
      namespaceSelector:
        names:
          - "*/httpbin"
      displayName: httpbin-ws
kubectl apply -f tsb-config -n payment
Step 3: Validate Application Deployments
TSB automates the installation and lifecycle management of waypoints. Waypoints can be customized at either the namespace or cluster scope. By default, when Ambient mode is enabled in a namespace, TSB automatically deploys the corresponding waypoint.
kubectl get pods -n client
NAME                        READY   STATUS    RESTARTS   AGE
sleep-6c6f68dd6-ckhwr       2/2     Running   0          11m
waypoint-7956b87b55-clp7m   1/1     Running   0          11m

kubectl get pods -n httpbin
NAME                        READY   STATUS    RESTARTS   AGE
httpbin-64f6b7b54f-xz9pb    2/2     Running   0          11m
waypoint-5dc464564c-2fprl   1/1     Running   0          11m
Verify waypoint proxies i.e automatically instantiated per namespace where ambient deployment exists.
kubectl get gateways -n client
NAME       CLASS            ADDRESS          PROGRAMMED   AGE
waypoint   istio-waypoint   172.25.186.180   True         13m
Verify ztunnel configuration
istioctl ztunnel-config service  -n istio-system | grep waypoint

NAMESPACE     SERVICE NAME               SERVICE VIP      WAYPOINT  ENDPOINTS
httpbin       httpbin                    172.25.185.152   waypoint  1/1
httpbin       waypoint                   172.25.181.144   None      1/1
client        sleep                      172.25.150.178   waypoint  1/1
client        waypoint                   172.25.131.12    None      1/1
istioctl ztunnel-config workload  -n istio-system | grep HBONE

NAMESPACE       POD NAME                                                 ADDRESS      NODE                                                WAYPOINT PROTOCOL
httpbin         httpbin-64f6b7b54f-xz9pb                                 172.25.64.40 cluster-1--d66fb5ad-pljs                            waypoint HBONE
client          sleep-6c6f68dd6-ckhwr                                    172.25.64.39 cluster-1--d66fb5ad-pljs                            waypoint HBONE
Step 4: Validate the Traffic Flow and Logs
Generate some traffic so that the service topology can be rendered in the TSB UI.
Verify
kubectl exec -n client deploy/sleep -- curl -s httpbin.httpbin.svc.cluster.local:8000/get
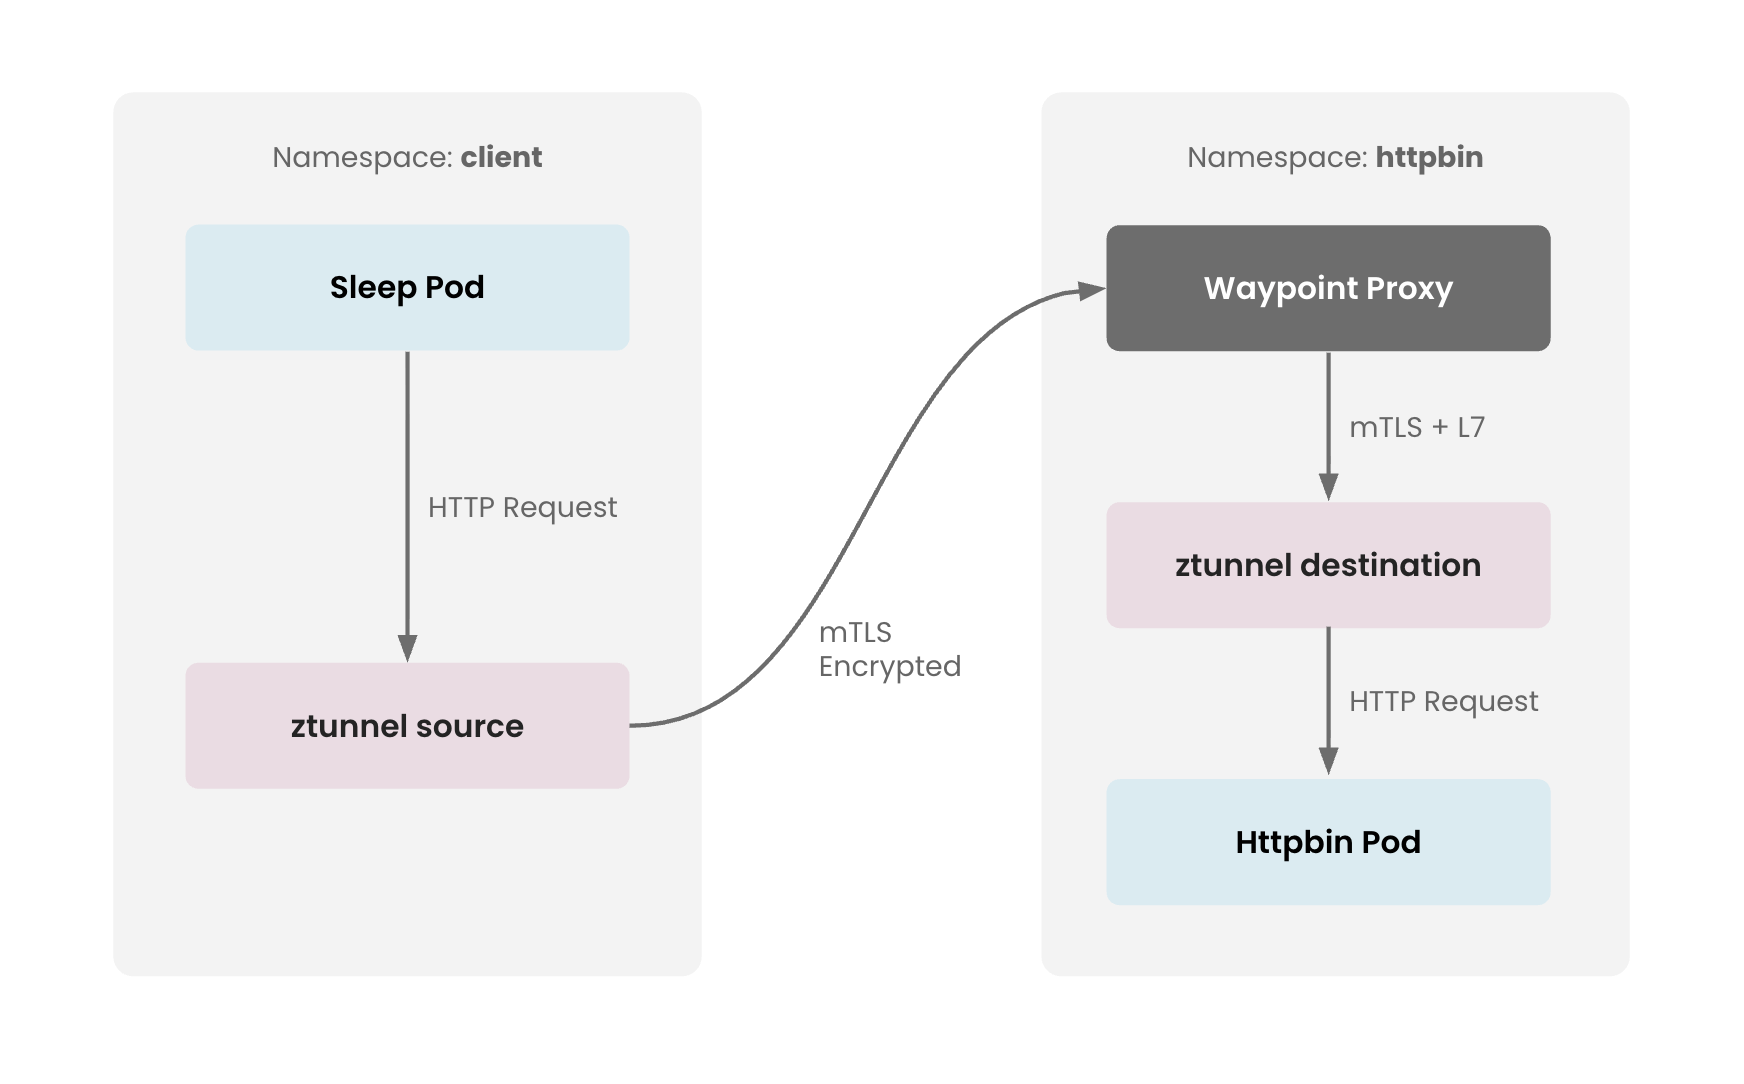
The following diagram illustrates how the traffic flows through the Ambient mode architecture in this demo setup
 Ambient Traffic Flow Ambient Traffic Flow |
|---|
Check the ztunnel logs to see how the traffic passes through source node's ztunnel where it is encrypted with mTLS
kubectl logs -f -l app=ztunnel -n istio-system

2025-12-04T05:09:21.293793Z	info	access	connection complete	src.addr=172.25.64.48:58318 src.identity="spiffe://cp-cluster-1.tsb.local/ns/httpbin/sa/waypoint" dst.addr=172.25.64.49:15008 dst.hbone_addr=172.25.64.49:80 dst.service="httpbin.httpbin.svc.cluster.local" dst.workload="httpbin-747b56fd5-pgsjk" dst.namespace="httpbin" dst.identity="spiffe://cp-cluster-1.tsb.local/ns/httpbin/sa/httpbin" direction="inbound" bytes_sent=596 bytes_recv=280 duration="2004ms"
2025-12-04T05:09:23.830352Z	info	access	connection complete	src.addr=172.25.64.47:36488 src.workload="sleep-868c754c4b-dnj2g" src.namespace="client" src.identity="spiffe://cp-cluster-1.tsb.local/ns/client/sa/sleep" dst.addr=172.25.64.48:15008 dst.hbone_addr=172.25.168.124:8000 dst.service="httpbin.httpbin.svc.cluster.local" dst.workload="waypoint-665d7967cd-t4xls" dst.namespace="httpbin" dst.identity="spiffe://cp-cluster-1.tsb.local/ns/httpbin/sa/waypoint" direction="outbound" bytes_sent=107 bytes_recv=675 duration="13ms"
Check the waypoint logs for inbound traffic received on httpbin
kubectl logs -f -l gateway.networking.k8s.io/gateway-name=waypoint -n httpbin | grep httpbin

[2025-12-02T15:17:33.135Z] "GET /get HTTP/1.1" 200 - via_upstream - "-" 0 1023 4 4 "-" "curl/8.17.0" "cd3b2ae8-6b6a-4c55-a186-897328c84e00" "httpbin.httpbin.svc.cluster.local:8000" "envoy://connect_originate/172.25.64.40:80" inbound-vip|8000|http|httpbin.httpbin.svc.cluster.local; envoy://internal_client_address/ 172.25.185.152:8000 172.25.64.39:58468 - default
[2025-12-02T15:17:38.134Z] "GET /get HTTP/1.1" 200 - via_upstream - "-" 0 1023 3 3 "-" "curl/8.17.0" "eb3a01a5-ed28-4e43-8a6c-7a51607cb569" "httpbin.httpbin.svc.cluster.local:8000" "envoy://connect_originate/172.25.64.40:80" inbound-vip|8000|http|httpbin.httpbin.svc.cluster.local; envoy://internal_client_address/ 172.25.185.152:8000 172.25.64.39:52006 - default
[2025-12-02T15:17:43.221Z] "GET /get HTTP/1.1" 200 - via_upstream - "-" 0 1023 4 3 "-" "curl/8.17.0" "71608852-3a2f-4646-bb60-9c1888fca29b" "httpbin.httpbin.svc.cluster.local:8000" "envoy://connect_originate/172.25.64.40:80" inbound-vip|8000|http|httpbin.httpbin.svc.cluster.local; envoy://internal_client_address/ 172.25.185.152:8000 172.25.64.39:58468 - default
Step 5: View the Topology in the UI
After generating traffic, you can view the service topology in the TSB UI. For detailed steps on navigating the topology view, see the TSB Topology and Metrics guide.
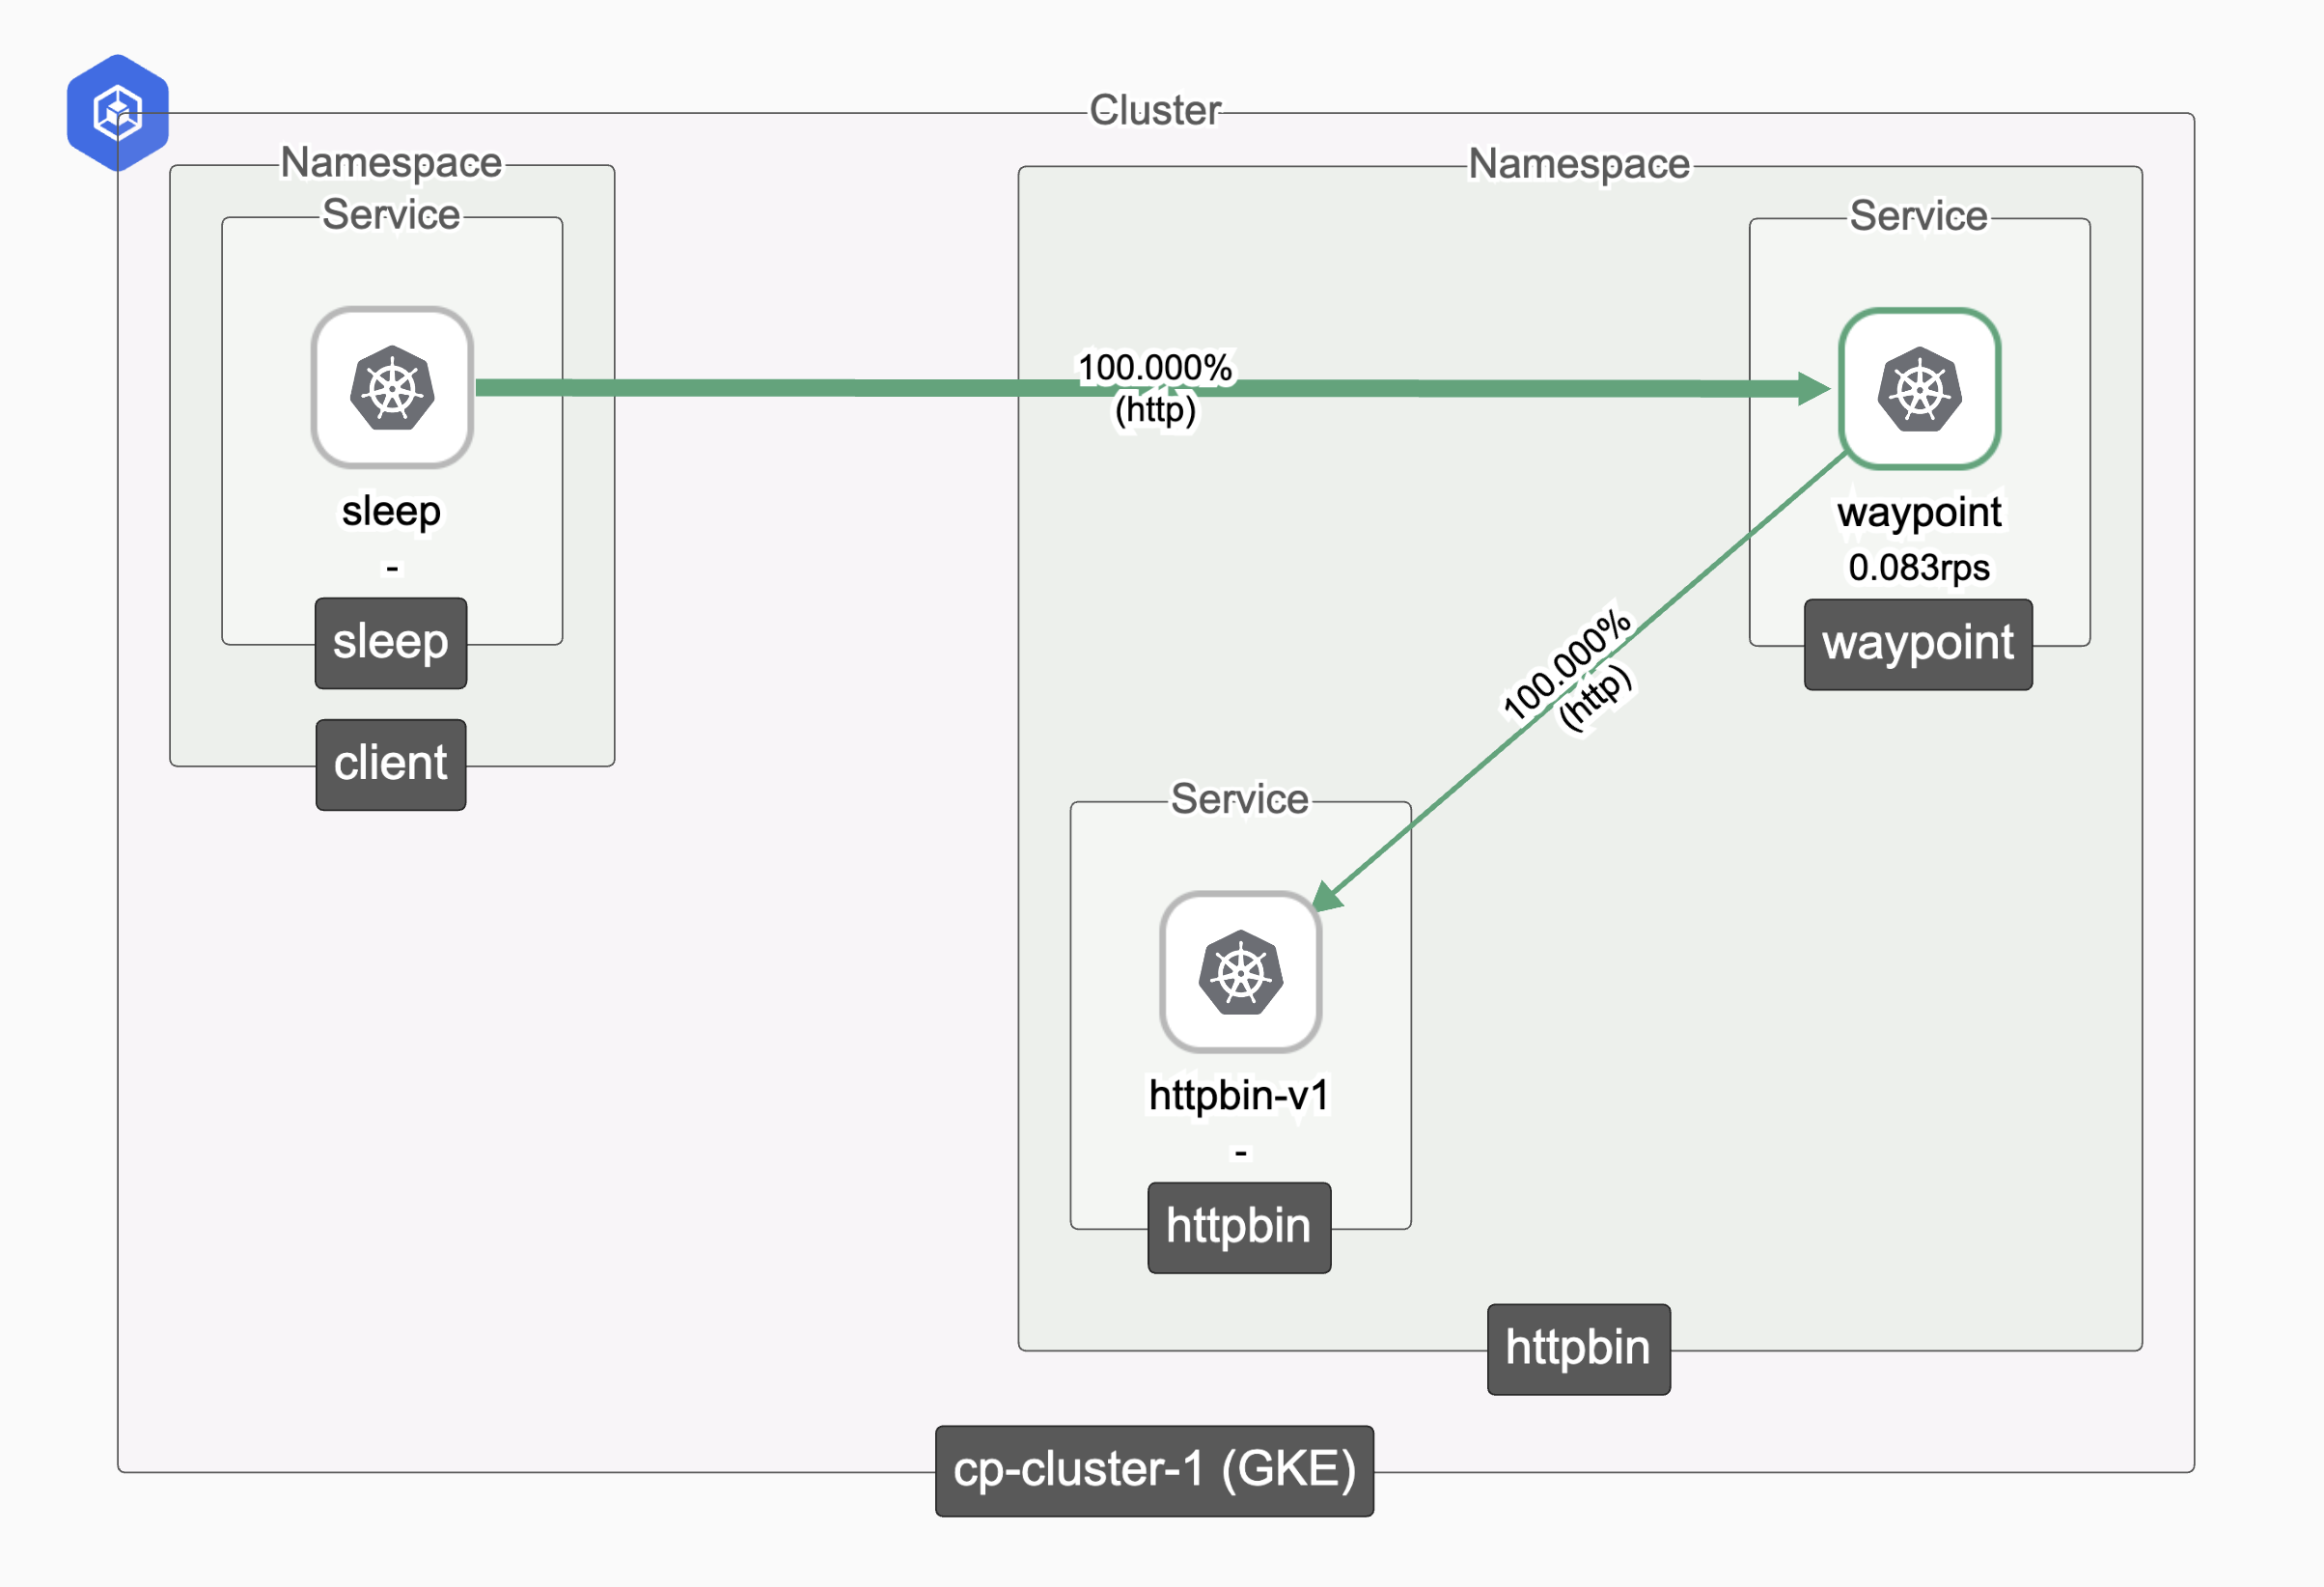
The topology view will show your ambient-enabled services with automatic mTLS encryption as shown below.
 Ambient Traffic Topology Ambient Traffic Topology |
|---|
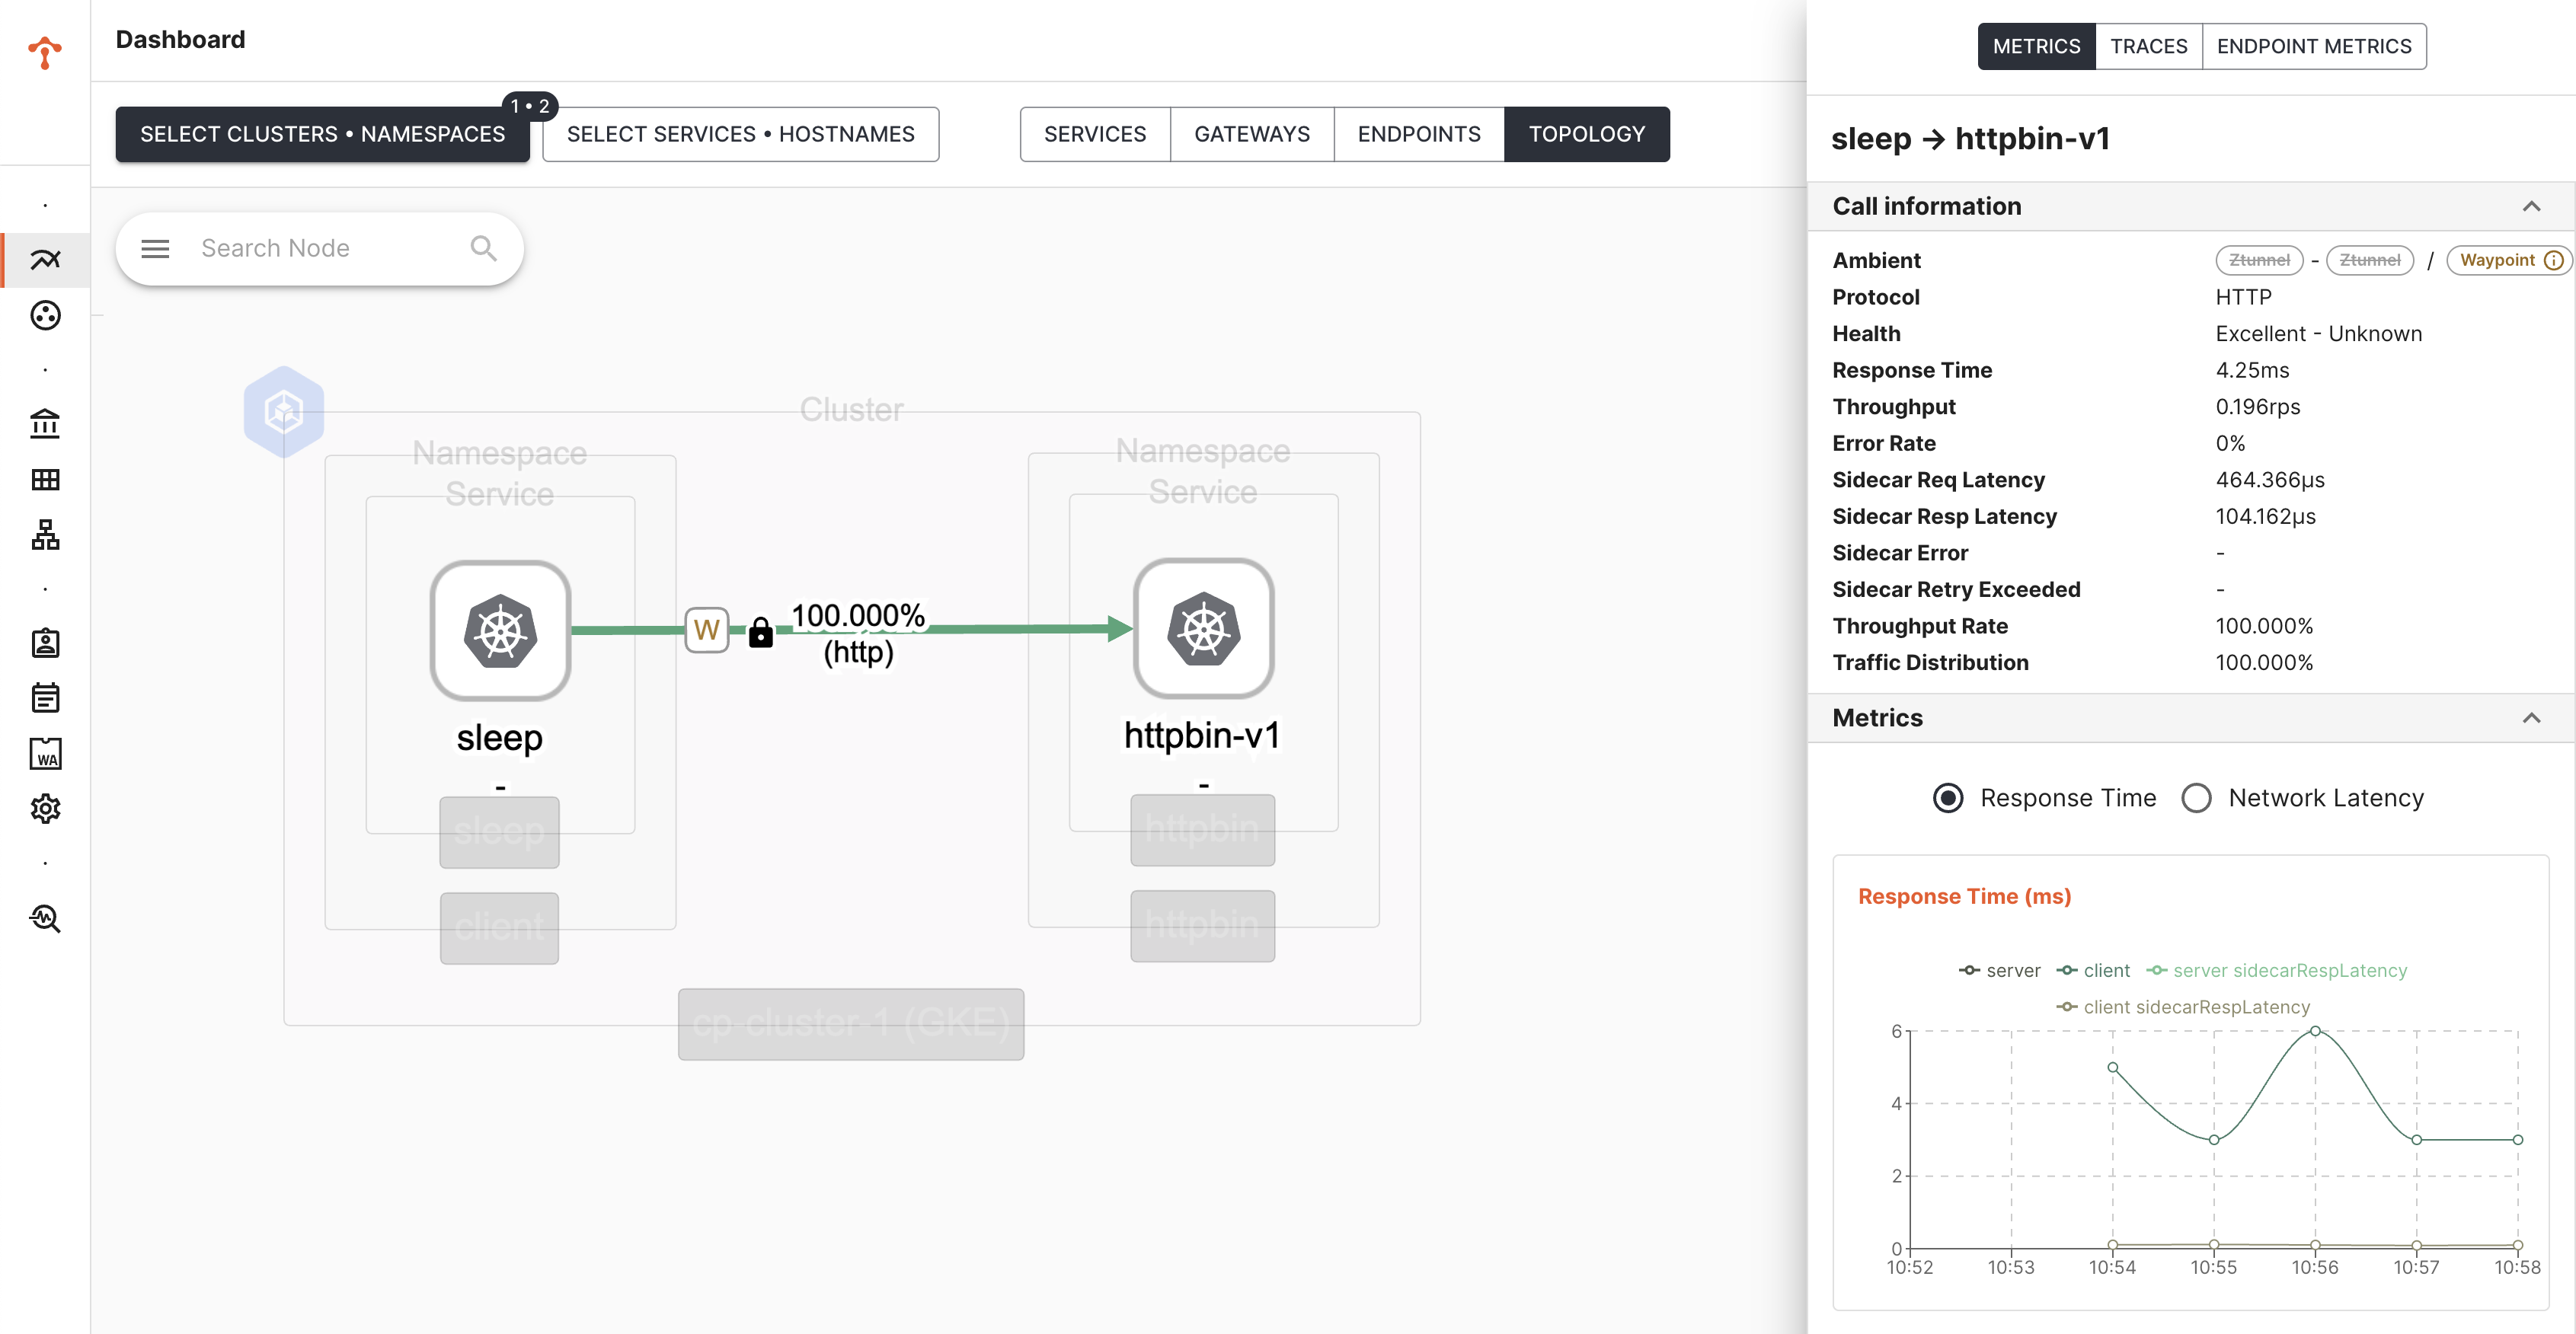
When you select Service Subset (Ambient) as a filter for Topology view, it also shows waypoint traffic and the metrics
 Ambient Metrics Ambient Metrics |
|---|
Brownfield Deployment
In a brownfield scenario, you are migrating existing application from sidecar mode to ambient mode. We will be facilitating incremental migration by doing one namespace at a time.
Pre-migration Setup
Assume we have the same application setup sleep and httpbin as we did in the greenfield deployment.
In addition to that, we also deploy bookinfo app and we configure L4 security policies and access restrictions as follows -
clientcan accessproductpageinbookinfonamespaceclientcannot accesshttpbininhttpbinnamespace
Step 1: Deploy Applications
For this demo:
- We will deploy
sleepas a client service in theclientnamespace. - We will deploy
httpbinservice inhttpbinnamespace - We will deploy
bookinfoapps inbookinfonamespace
Deploy sleep service
kubectl create namespace client
kubectl label namespace client istio-injection=enabled
kubectl apply -n client -f https://raw.githubusercontent.com/istio/istio/release-1.22/samples/sleep/sleep.yaml
Deploy httpbin service
kubectl create namespace httpbin
kubectl label namespace httpbin istio-injection=enabled
kubectl apply -n httpbin -f https://raw.githubusercontent.com/istio/istio/release-1.22/samples/httpbin/httpbin.yaml
Deploy bookinfo service
kubectl create namespace bookinfo
kubectl label namespace bookinfo istio-injection=enabled
kubectl apply -n bookinfo -f https://raw.githubusercontent.com/istio/istio/refs/heads/release-1.22/samples/bookinfo/platform/kube/bookinfo.yaml
Step 2: Onboard Applications into TSB
Create TSB configurations for Tenant, Workspace & Group to onboard the services under client, httpbin and bookinfo namespaces into TSB.
Resources configured in DIRECT mode are not supported by TSB for automatic translation. These resources will not be automatically converted to work in Ambient mode.
To migrate them, you must manually update the policies to use targetRef and bind them to the appropriate waypoint Gateway.
Create TSB Configuration
Update the prev TSB configuration by adding the following config for bookinfo and enabling istio security policies.
- tctl
- kubectl (GitOps)
apiVersion: v1
kind: List
items:
  - apiVersion: tsb.tetrate.io/v2
    kind: Workspace
    metadata:
      name: bookinfo-ws
      annotations:
        tsb.tetrate.io/organization: tetrate
        tsb.tetrate.io/tenant: my-tenant
    spec:
      namespaceSelector:
        names:
          - "cp-cluster-1/bookinfo"
      displayName: bookinfo-ws
  - apiVersion: tsb.tetrate.io/v2
    kind: TenantSetting
    metadata:
      name: tenant-settings
      annotations:
        tsb.tetrate.io/organization: tetrate
        tsb.tetrate.io/tenant: my-tenant
    spec:
      defaultSecuritySetting:
        authenticationSettings:
          trafficMode: REQUIRED
        authorization:
            mode: RULES
            rules:
              allow:
              - from:
                    fqn: organizations/tetrate/tenants/my-tenant/workspaces/client-ws
                to:
                    fqn: organizations/tetrate/tenants/my-tenant/workspaces/bookinfo-ws
              # below rules are required to allow everything within the app namespace
              - from:
                    fqn: organizations/tetrate/tenants/my-tenant/workspaces/bookinfo-ws
                to:
                    fqn: organizations/tetrate/tenants/my-tenant/workspaces/bookinfo-ws
              - from:
                    fqn: organizations/tetrate/tenants/my-tenant/workspaces/client-ws
                to:
                    fqn: organizations/tetrate/tenants/my-tenant/workspaces/client-ws
              - from:
                    fqn: organizations/tetrate/tenants/my-tenant/workspaces/httpbin-ws
                to:
                    fqn: organizations/tetrate/tenants/my-tenant/workspaces/httpbin-ws
              deny:
              - from:
                    fqn: organizations/tetrate/tenants/my-tenant/workspaces/client-ws
                to:
                    fqn: organizations/tetrate/tenants/my-tenant/workspaces/httpbin-ws
tctl apply -f tsb-config.yaml
apiVersion: v1
kind: List
items:
  - apiVersion: api.tsb.tetrate.io/v2
    kind: Workspace
    metadata:
      name: bookinfo-ws
      organization: tetrate
      tenant: my-tenant
    spec:
      namespaceSelector:
        names:
          - "cp-cluster-1/bookinfo"
      displayName: bookinfo-ws
  - apiVersion: api.tsb.tetrate.io/v2
    kind: TenantSetting
    metadata:
      name: tenant-settings
      organization: tetrate
      tenant: my-tenant
    spec:
      defaultSecuritySetting:
        authenticationSettings:
          trafficMode: REQUIRED
        authorization:
            mode: RULES
            rules:
              allow:
              - from:
                    fqn: organizations/tetrate/tenants/my-tenant/workspaces/client-ws
                to:
                    fqn: organizations/tetrate/tenants/my-tenant/workspaces/bookinfo-ws
              # below rules are required to allow everything within the app namespace
              - from:
                    fqn: organizations/tetrate/tenants/my-tenant/workspaces/bookinfo-ws
                to:
                    fqn: organizations/tetrate/tenants/my-tenant/workspaces/bookinfo-ws
              - from:
                    fqn: organizations/tetrate/tenants/my-tenant/workspaces/client-ws
                to:
                    fqn: organizations/tetrate/tenants/my-tenant/workspaces/client-ws
              - from:
                    fqn: organizations/tetrate/tenants/my-tenant/workspaces/httpbin-ws
                to:
                    fqn: organizations/tetrate/tenants/my-tenant/workspaces/httpbin-ws
              deny:
              - from:
                    fqn: organizations/tetrate/tenants/my-tenant/workspaces/client-ws
                to:
                    fqn: organizations/tetrate/tenants/my-tenant/workspaces/httpbin-ws
kubectl apply -f tsb-config
Step 3: Verify Traffic and Access restrictions
Verify requests from client app to httpbin are denied
kubectl exec -n client deploy/sleep -- curl -s httpbin.httpbin.svc.cluster.local:8000/get

RBAC: access denied
Verify requests from client app to bookinfo app are allowed
kubectl exec -n client deploy/sleep -- curl -s productpage.bookinfo.svc.cluster.local:9080/api/v1/products/1/reviews -v

SUCCESS
Step 4: Migrate client Namespace
Overwrite the namespace labels to disable sidecar injection and enable ambient mode
kubectl label --overwrite namespace client istio-injection- istio.io/dataplane-mode=ambient
Step 4-A: Restart Pods
Restart application deployments in client namespace to remove the sidecars
kubectl rollout restart deployment -n client
Step 4-B: Verify Application Deployments
TSB automates the installation and lifecycle management of waypoints. Waypoints can be customized at either the namespace or cluster scope. By default, when Ambient mode is enabled in a namespace, TSB automatically deploys the corresponding waypoint.
kubectl get pods -n client
NAME                        READY   STATUS    RESTARTS   AGE
sleep-6c6f68dd6-ckhwr       2/2     Running   0          1m
waypoint-7956b87b55-clp7m   1/1     Running   0          1m
Verify waypoint proxies i.e automatically instantiated per namespace where ambient deployment exists.
kubectl get gateways -n client
NAME       CLASS            ADDRESS          PROGRAMMED   AGE
waypoint   istio-waypoint   172.25.186.180   True         13m
Verify ztunnel configuration
istioctl ztunnel-config service  -n istio-system | grep waypoint

NAMESPACE     SERVICE NAME               SERVICE VIP      WAYPOINT  ENDPOINTS
client        sleep                      172.25.133.197   waypoint  1/1
client        waypoint                   172.25.186.180   None      1/1
Step 4-C: Verify Ambient->Sidecar Connectivity
Verify cross-mode (ambient->sidecar ) traffic i.e sleep service running in ambient mode can still call httpbin and bookinfo running in sidecar mode
kubectl exec -n client deploy/sleep -- curl -s httpbin.httpbin.svc.cluster.local:8000/get

RBAC: access denied
kubectl exec -n client deploy/sleep -- curl -s productpage.bookinfo.svc.cluster.local:9080/api/v1/products/1/reviews -v

SUCCESS
Check ztunnel logs indicating only the outbound connection from sleep as the destination service is still running in sidecar mode.
kubectl logs -f -l app=ztunnel -n istio-system

2025-12-08T10:05:55.537773Z	info	access	connection complete	src.addr=172.25.66.34:48420 src.workload="sleep-6d8b7d685d-tpwsd" src.namespace="client" src.identity="spiffe://cp-cluster-1.tsb.local/ns/client/sa/sleep" dst.addr=172.25.66.32:15008 dst.hbone_addr=172.25.66.32:80 dst.service="httpbin.httpbin.svc.cluster.local" dst.workload="httpbin-747b56fd5-tdqvx" dst.namespace="httpbin" dst.identity="spiffe://cp-cluster-1.tsb.local/ns/httpbin/sa/httpbin" direction="outbound" bytes_sent=105 bytes_recv=220 duration="13ms"
2025-12-08T10:07:24.719923Z	info	access	connection complete	src.addr=172.25.66.34:58600 src.workload="sleep-6d8b7d685d-tpwsd" src.namespace="client" src.identity="spiffe://cp-cluster-1.tsb.local/ns/client/sa/sleep" dst.addr=172.25.64.30:15008 dst.hbone_addr=172.25.64.30:9080 dst.service="productpage.bookinfo.svc.cluster.local" dst.workload="productpage-v1-b96964b8f-lgzr4" dst.namespace="bookinfo" dst.identity="spiffe://cp-cluster-1.tsb.local/ns/bookinfo/sa/bookinfo-productpage" direction="outbound" bytes_sent=132 bytes_recv=677 duration="52ms"
Step 4-D: Verify client Migration
Check the application pods no longer have sidecars:
kubectl get pods -n client -o jsonpath='{range .items[*]}{.metadata.name}{"\t"}{.spec.containers[*].name}{"\n"}{end}'
sleep-5c5ffcd76d-lb2n7	sleep
You should see only application container without istio-proxy container attached.
Step 5: Migrate httpbin Namespace
Overwrite the namespace labels to disable sidecar injection and enable ambient mode
kubectl label --overwrite namespace httpbin istio-injection- istio.io/dataplane-mode=ambient
Step 5-A: Restart Pods
Restart application deployments in httpbin namespace to remove the sidecars
kubectl rollout restart deployment -n httpbin
Step 5-B: Verify Application Deployments
Verify application pod in httpbin namespace after restart. As you can see, when Ambient mode is enabled in a namespace, TSB automatically deploys the corresponding waypoint.
kubectl get pods -n httpbin
NAME                        READY   STATUS    RESTARTS   AGE
httpbin-9c78fd77f-dh2t4     1/1     Running   0          39s
waypoint-68cd89d4d6-c25mb   1/1     Running   0          38s
Verify waypoint proxies i.e automatically instantiated per namespace where ambient deployment exists.
kubectl get gateways -n httpbin
NAME       CLASS            ADDRESS          PROGRAMMED   AGE
waypoint   istio-waypoint   172.25.166.151   True         72s
Verify ztunnel configuration
istioctl ztunnel-config service  -n istio-system | grep waypoint

NAMESPACE     SERVICE NAME               SERVICE VIP      WAYPOINT  ENDPOINTS
client        sleep                      172.25.185.31    waypoint  1/1
client        waypoint                   172.25.163.52    None      1/1
httpbin       httpbin                    172.25.167.176   waypoint  1/1
httpbin       waypoint                   172.25.166.151   None      1/1
Step 5-C: Verify Ambient->Ambient Connectivity
In this scenario TSB security settings continue to work, but now they target Ambient infrastructure.
TSB automatically:
- Applies L4 policies to ztunnel
- Applied L7 policies to waypoint
- Maintains policy enforcement during migration
Verify request from client to httpbin, all requests should be denied.
kubectl exec -n client deploy/sleep -- curl -s httpbin.httpbin.svc.cluster.local:8000/get

RBAC: access denied
Verify ztunnel logs
kubectl logs -f -l app=ztunnel -n istio-system

2025-12-12T06:47:32.631224Z	info	access	connection complete	src.addr=172.24.66.53:47830 src.workload="sleep-868c754c4b-7kn9x" src.namespace="client" src.identity="spiffe://cp-cluster-1.tsb.local/ns/client/sa/sleep" dst.addr=172.24.65.33:15008 dst.hbone_addr=172.24.165.149:8000 dst.service="httpbin.httpbin.svc.cluster.local" dst.workload="waypoint-64874dd676-tvjnr" dst.namespace="httpbin" dst.identity="spiffe://cp-cluster-1.tsb.local/ns/httpbin/sa/waypoint" direction="outbound" bytes_sent=105 bytes_recv=220 duration="4ms"
Verify waypoint logs
kubectl logs -f -l gateway.networking.k8s.io/gateway-name=waypoint -n httpbin | grep httpbin

[2025-12-12T06:43:03.200Z] "GET /get HTTP/1.1" 403 - rbac_access_denied_matched_policy[ns[httpbin]-policy[waypoint-deny-rules]-rule[0]] - "-" 0 19 0 - "-" "curl/8.17.0" "89095ac4-810f-4655-81e3-06fb33368652" "httpbin.httpbin.svc.cluster.local:8000" "-" inbound-vip|8000|http|httpbin.httpbin.svc.cluster.local; - 172.24.165.149:8000 172.24.66.53:49362 - default
as you can see rbac_access_denied_matched_policy[ns[httpbin]-policy[waypoint-deny-rules]-rule[0]] is being thrown after L7 policy check.
Verify translated authZ policies
kubectl get authorizationpolicies -A

NAMESPACE   NAME                    ACTION   AGE
client      allow                            11s
client      allow-gateway-ambient            11s
client      allow-waypoint                   11s
httpbin     allow                            11s
httpbin     allow-gateway-ambient            11s
httpbin     allow-waypoint                   11s
httpbin     deny-rules              DENY     11s
httpbin     gateway-deny-rules      DENY     11s
httpbin     waypoint-deny-rules     DENY     11s
verify waypoint-deny-rules deny policy that is matched
kubectl get authorizationpolicies waypoint-deny-rules -n httpbin -o yaml

apiVersion: security.istio.io/v1
kind: AuthorizationPolicy
metadata:
  name: waypoint-deny-rules
  namespace: httpbin
spec:
  action: DENY
  rules:
  - from:
    - source:
        principals:
        - cp-cluster-1.tsb.local/ns/client/*
  targetRef:
    group: gateway.networking.k8s.io
    kind: Gateway
    name: waypoint
status:
  conditions:
  - lastTransitionTime: "2025-12-12T06:42:12.183326921Z"
    message: bound to httpbin/waypoint
    observedGeneration: "1"
    reason: Accepted
    status: "True"
    type: WaypointAccepted
as you can see targetRef points to a Waypoint Gateway and the policies bound to a waypoint are evaluated at L7
Step 6: Migrate bookinfo namespace
Overwrite the namespace labels to disable sidecar injection and enable ambient mode
kubectl label --overwrite namespace bookinfo istio-injection- istio.io/dataplane-mode=ambient
Step 6-A: Restart Pods
Restart application deployments in bookinfo namespace to remove the sidecars
kubectl rollout restart deployment -n bookinfo
Step 6-B: Verify Application Deployments
Verify application pod in bookinfo namespace after restart. As you can see, when Ambient mode is enabled in a namespace, TSB automatically deploys the corresponding waypoint.
kubectl get pods -n bookinfo

NAME                              READY   STATUS    RESTARTS   AGE
details-v1-68f77f55bd-6ks25       1/1     Running   0          37s
productpage-v1-556ccdc7cb-9lqtc   1/1     Running   0          37s
ratings-v1-6f66597bc6-q6fhv       1/1     Running   0          37s
reviews-v1-6495fcb574-fv7np       1/1     Running   0          37s
reviews-v2-f5c866f76-fdrjj        1/1     Running   0          37s
reviews-v3-547b6d9fd6-pt7xk       1/1     Running   0          37s
waypoint-b47c8cc5c-7hs4g          1/1     Running   0          37s
Verify waypoint proxies i.e automatically instantiated per namespace where ambient deployment exists.
kubectl get gateways -n bookinfo
NAME       CLASS            ADDRESS          PROGRAMMED   AGE
waypoint   istio-waypoint   172.25.155.128   True         72s
Verify ztunnel configuration
istioctl ztunnel-config service  -n istio-system | grep waypoint

NAMESPACE     SERVICE NAME               SERVICE VIP      WAYPOINT  ENDPOINTS
bookinfo      details                    172.25.147.12  waypoint 1/1
bookinfo      productpage                172.25.181.20  waypoint 1/1
bookinfo      ratings                    172.25.190.28  waypoint 1/1
bookinfo      reviews                    172.25.166.177 waypoint 3/3
bookinfo      waypoint                   172.25.155.128 None     1/1
client        sleep                      172.25.185.31  waypoint 1/1
client        waypoint                   172.25.163.52  None     1/1
httpbin       httpbin                    172.25.167.176 waypoint 1/1
httpbin       waypoint                   172.25.166.151 None     1/1
Step 6-C: Verify Ambient->Ambient Connectivity
Verify request from client to productpage, it should allow the request.
kubectl exec -n client deploy/sleep -- curl -s productpage.bookinfo.svc.cluster.local:9080/api/v1/products/1/reviews -v

SUCCESS
Verify ztunnel logs for both inbound and outbound requests
kubectl logs -f -l app=ztunnel -n istio-system

2025-12-08T11:00:42.951606Z	info	access	connection complete	src.addr=172.25.66.34:51472 src.workload="sleep-6d8b7d685d-tpwsd" src.namespace="client" src.identity="spiffe://cp-cluster-1.tsb.local/ns/client/sa/sleep" dst.addr=172.25.64.36:15008 dst.hbone_addr=172.25.181.20:9080 dst.service="productpage.bookinfo.svc.cluster.local" dst.workload="waypoint-b47c8cc5c-7hs4g" dst.namespace="bookinfo" dst.identity="spiffe://cp-cluster-1.tsb.local/ns/bookinfo/sa/waypoint" direction="outbound" bytes_sent=132 bytes_recv=678 duration="815ms"
2025-12-08T11:00:47.905530Z	info	access	connection complete	src.addr=172.25.64.36:60934 src.identity="spiffe://cp-cluster-1.tsb.local/ns/bookinfo/sa/waypoint" dst.addr=172.25.66.41:15008 dst.hbone_addr=172.25.66.41:9080 dst.service="ratings.bookinfo.svc.cluster.local" dst.workload="ratings-v1-6f66597bc6-q6fhv" dst.namespace="bookinfo" dst.identity="spiffe://gke-sreehari-us-east1-1.tsb.local/ns/bookinfo/sa/bookinfo-ratings" direction="inbound" bytes_sent=222 bytes_recv=351 duration="5009ms"
verify waypoint logs
kubectl logs -f -l gateway.networking.k8s.io/gateway-name=waypoint -n bookinfo | grep productpage

[2025-12-08T11:00:29.397Z] "GET /api/v1/products/1/reviews HTTP/1.1" 200 - via_upstream - "-" 0 439 1192 1190 "-" "curl/8.17.0" "b03a57d6-a142-45b0-8b25-69d7f6f82c17" "productpage.bookinfo.svc.cluster.local:9080" "envoy://connect_originate/172.25.66.40:9080" inbound-vip|9080|http|productpage.bookinfo.svc.cluster.local; envoy://internal_client_address/ 172.25.181.20:9080 172.25.66.34:60936 - default
[2025-12-08T11:00:42.137Z] "GET /api/v1/products/1/reviews HTTP/1.1" 200 - via_upstream - "-" 0 436 811 811 "-" "curl/8.17.0" "268457b6-ab0a-4420-b416-a01d258498b0" "productpage.bookinfo.svc.cluster.local:9080" "envoy://connect_originate/172.25.66.40:9080" inbound-vip|9080|http|productpage.bookinfo.svc.cluster.local; envoy://internal_client_address/ 172.25.181.20:9080 172.25.66.34:60936 - default
Step 7: Validate Complete Migration
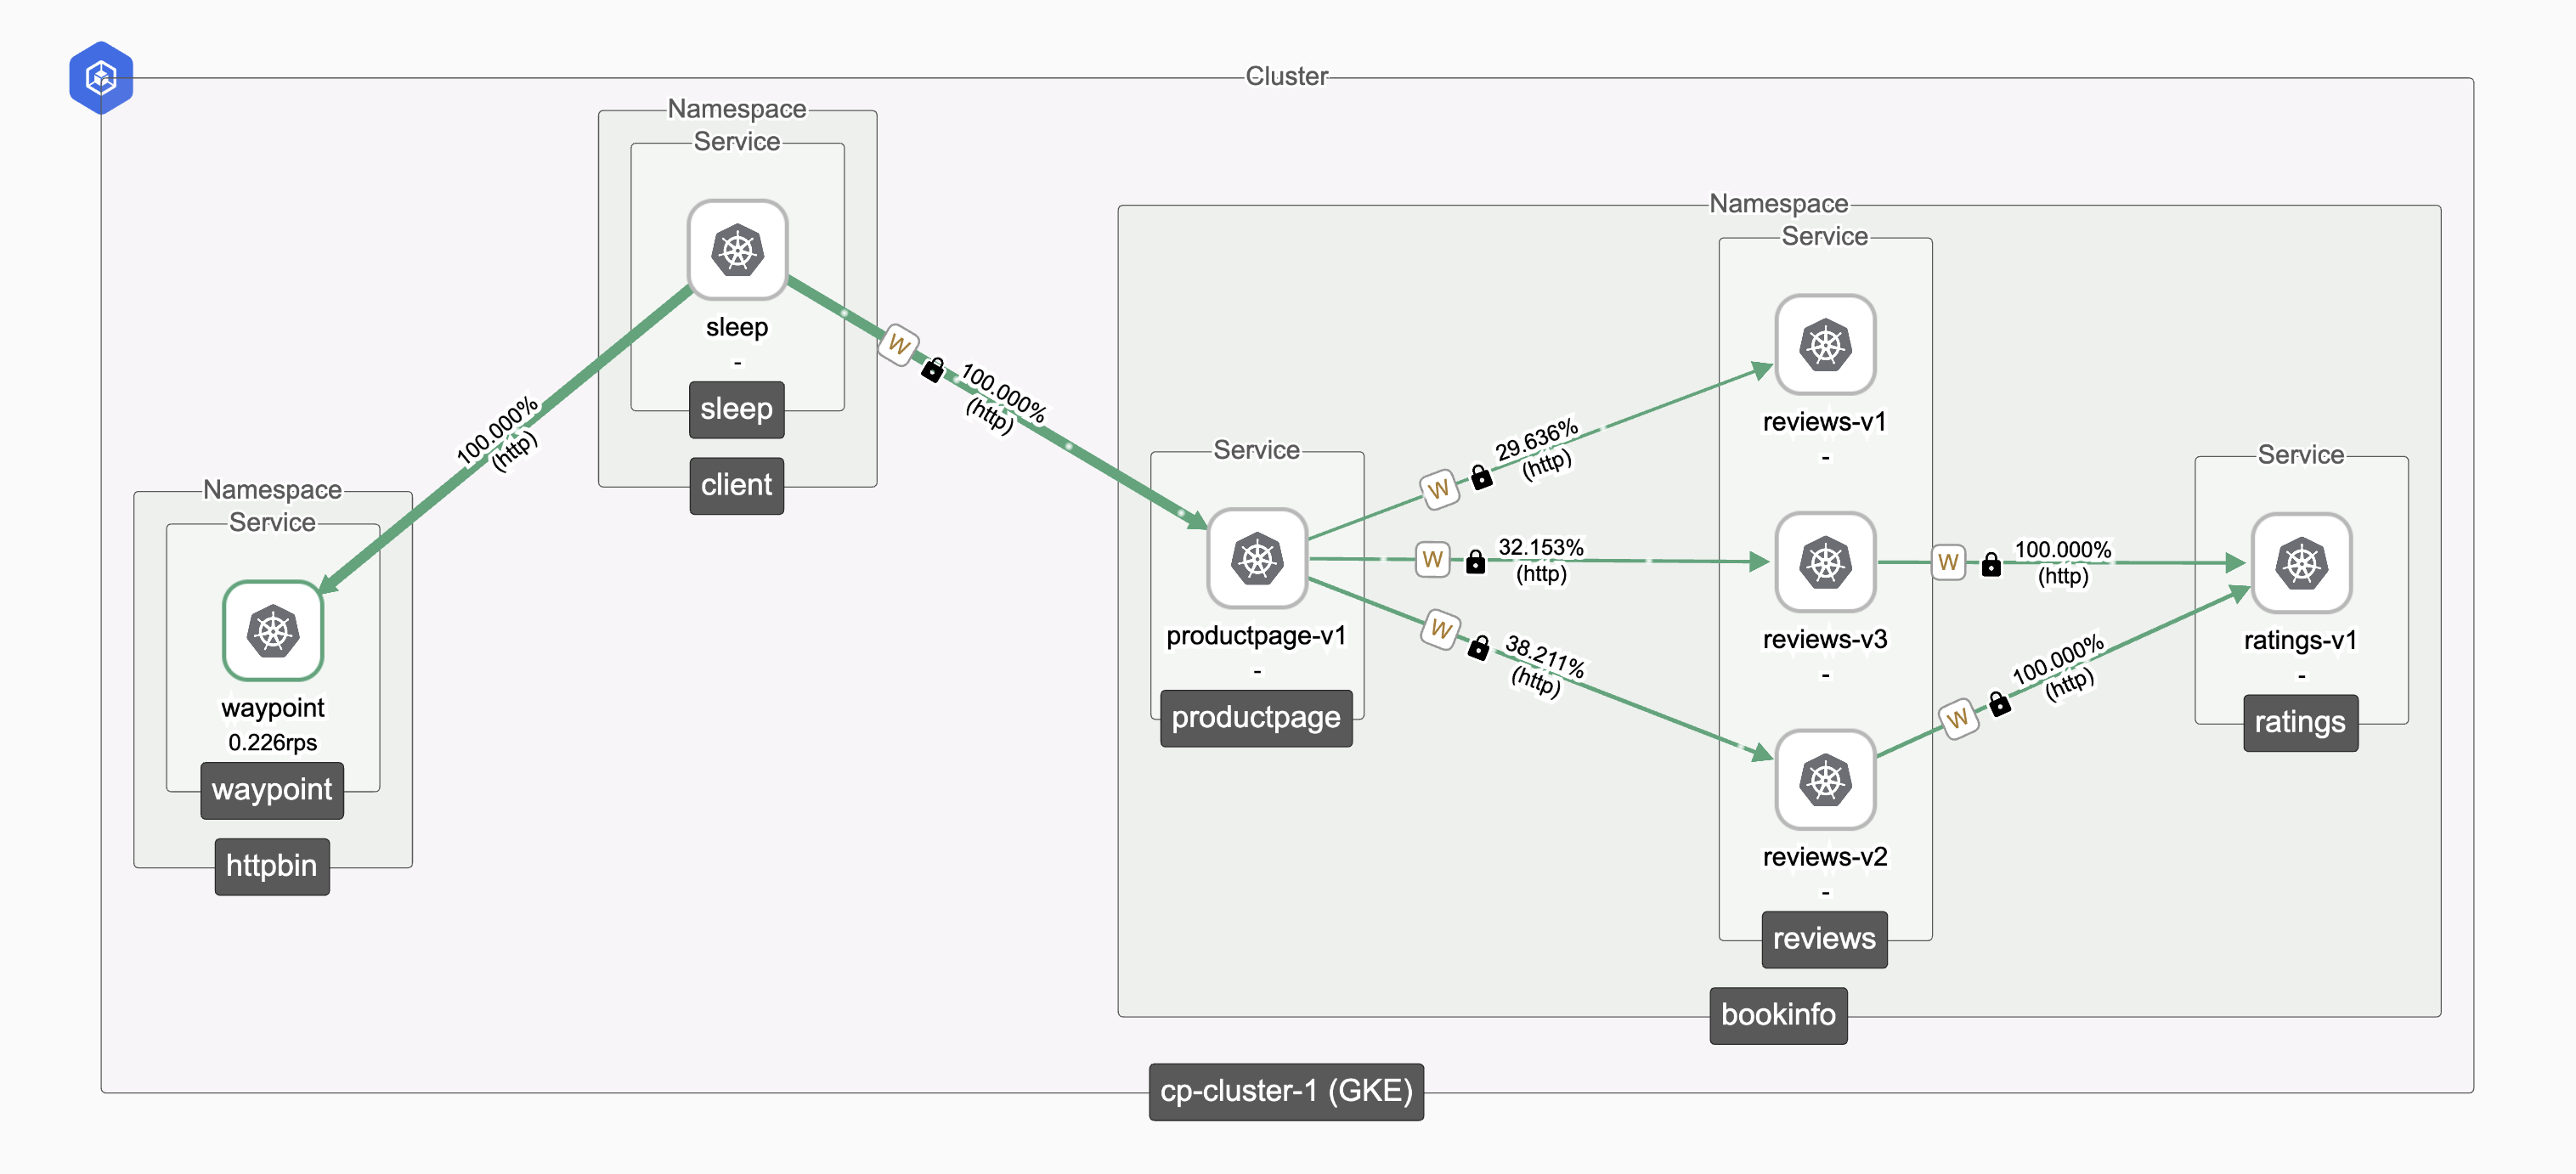
Login to TSB UI to verify ambient traffic from the topology tab
 Ambient Traffic Topology Ambient Traffic Topology |
|---|