 Tetrate Service BridgeVersion: next
Monitor Tetrate Metrics
The Tetrate Management Plane collects metrics and traces from each onboarded workload platform, and from other workloads with the appropriate OAP clients enabled. These metrics are stored in an ElasticSearch database and are available via dashboards in the Tetrate UI:
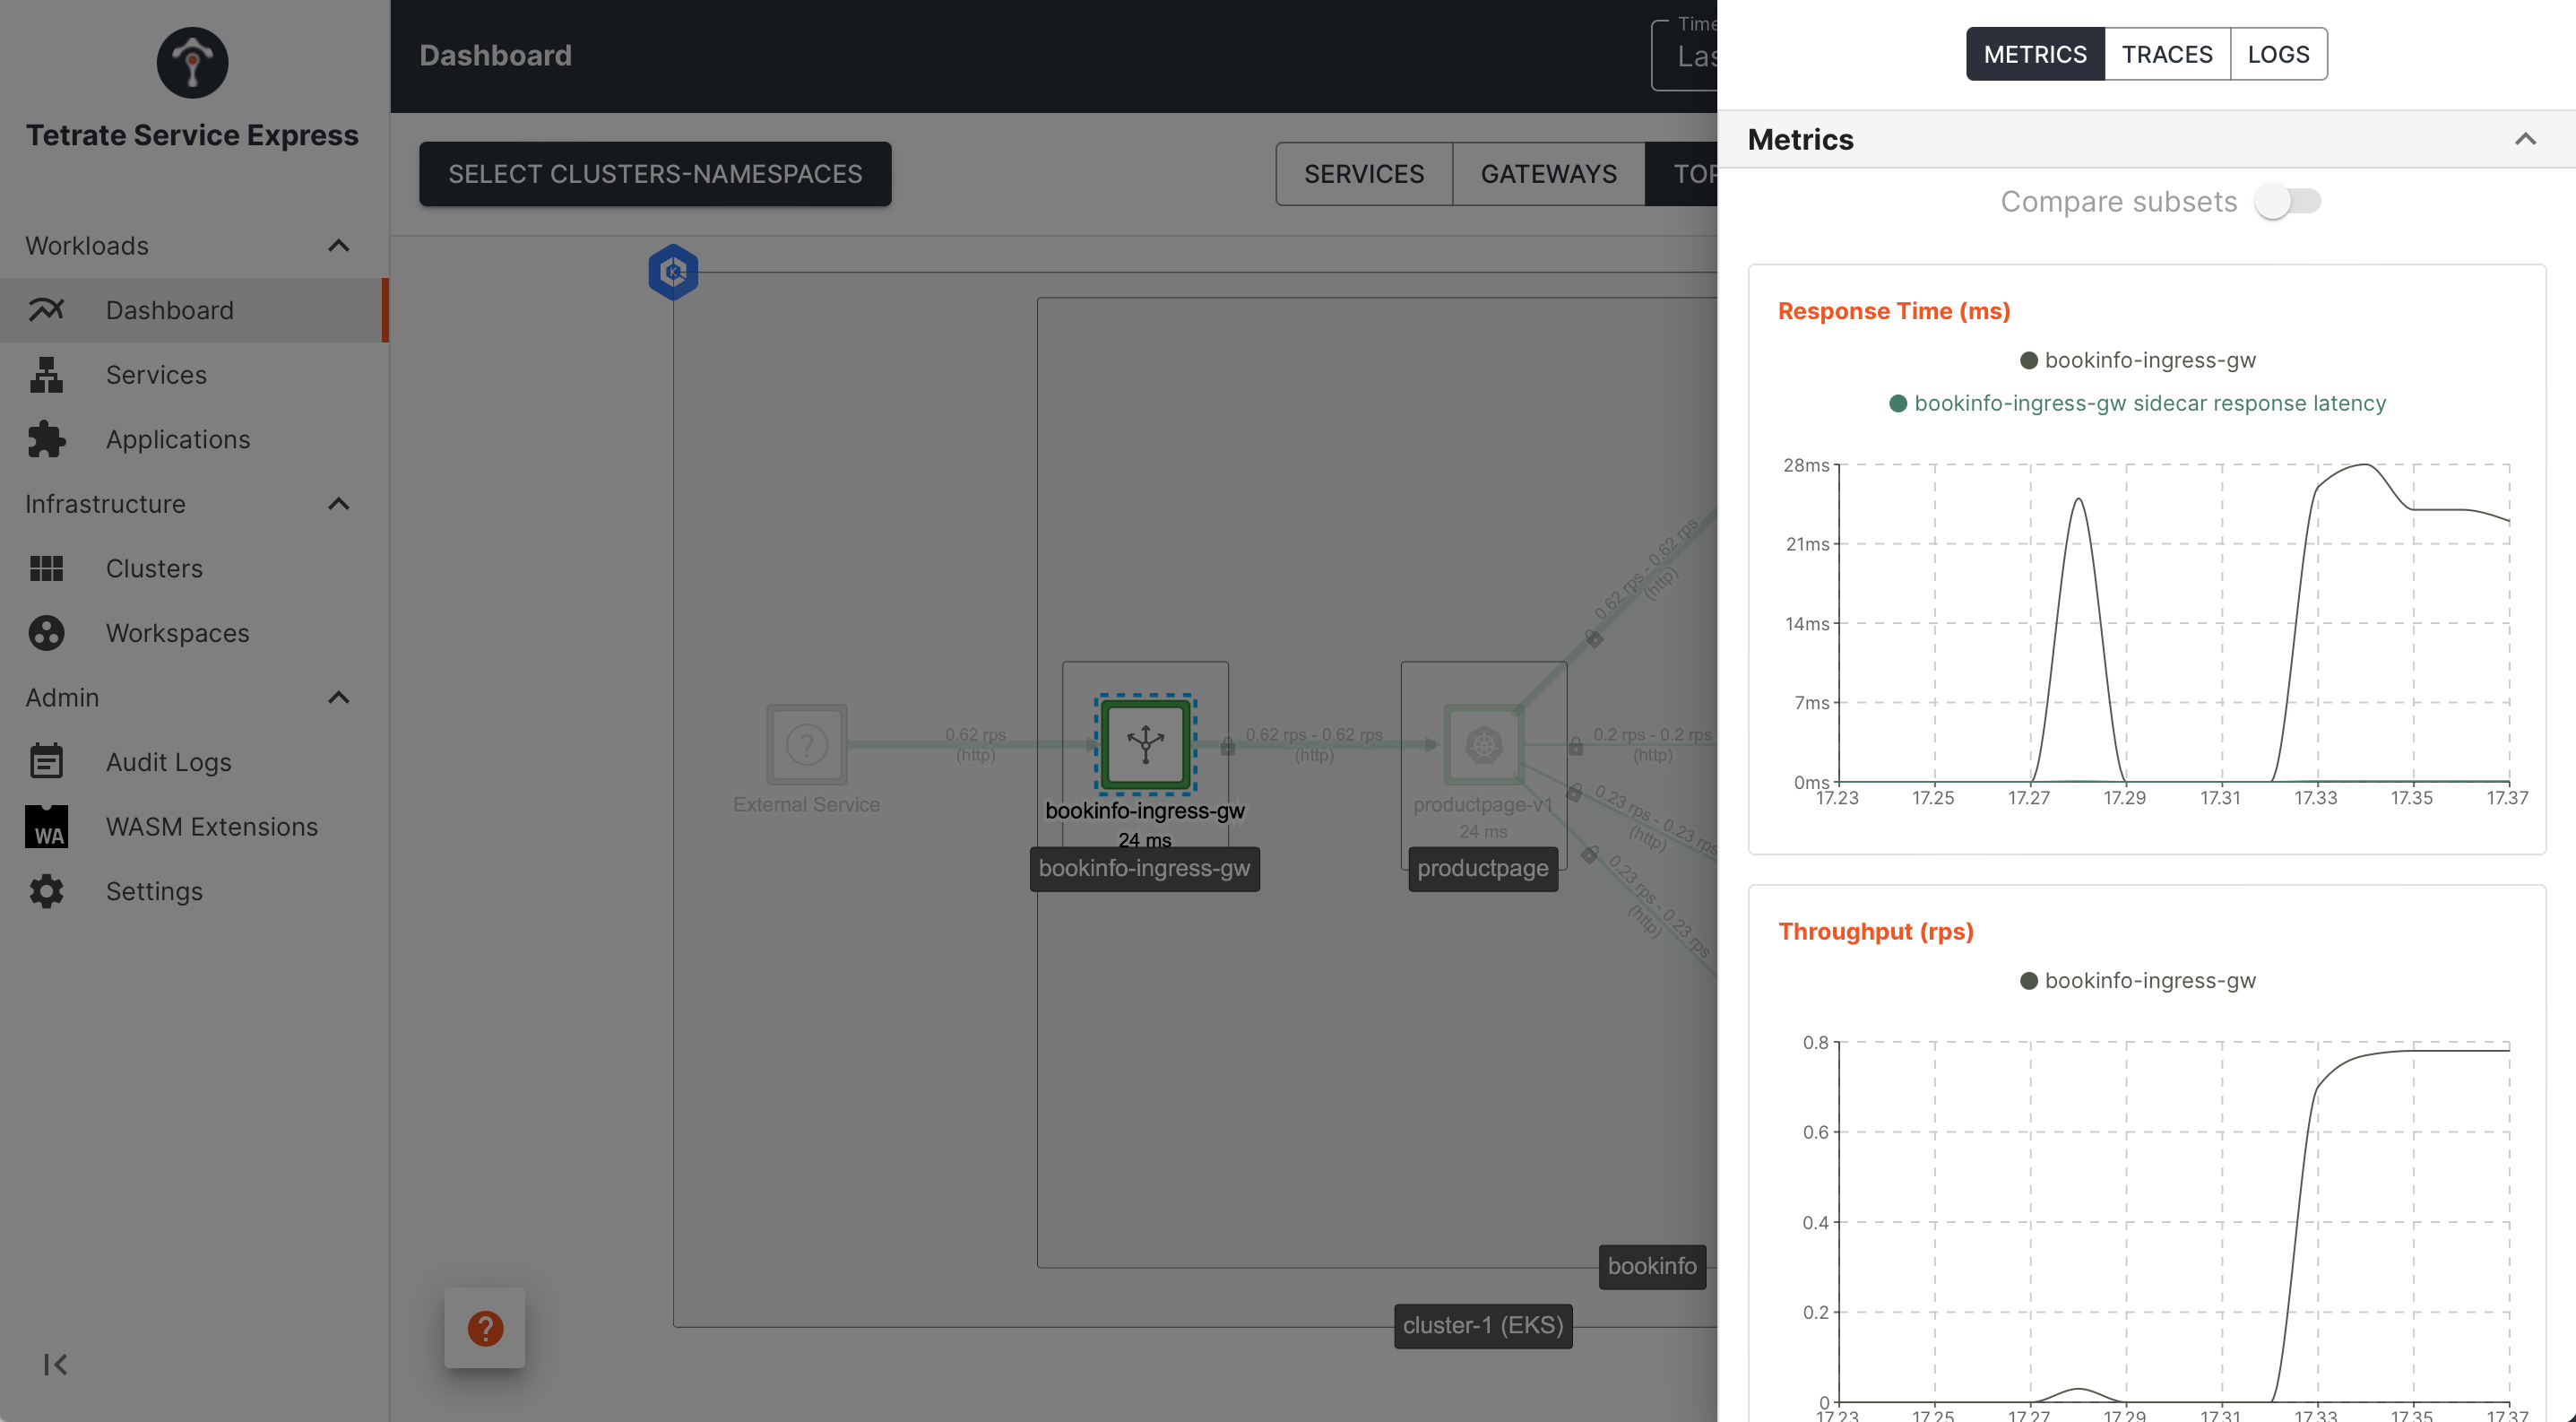 Dashboard UI: service instance metrics Dashboard UI: service instance metrics |
|---|
A user requires access to the Tetrate UI in order to view these metrics. This may be possible in simple, single-team deployments and with TSB it may be possible at very large scale with role-based access for Application Owners, but in many cases, it's not possible or appropriate to grant access for your Application Owner teams.
The alternative is to export the Tetrate-gathered metrics to a third-party dashboard such as Grafana. This is often the most appropriate way to give a large number of users access to the Tetrate metrics, particularly if you already have an established Enterprise dashboard solution.
Exposing Tetrate Metrics in Third-party Dashboards
You need to expose your TSE metrics and arrange that a dashboard collector can scrape and label them. The following resources may help:
- Understanding Tetrate Metrics Architecture
- The TSE AWS Managed Grafana integration guide
- The TSB Prometheus PromQL guide
- The TSB New Relic Integration
Obtaining Tetrate Traces
The Tetrate-managed platform samples traces from transactions on workload clusters and stores these on the management cluster. Tetrate provide functionality in the tctl command line tool to (a) copy the cluster and trace data offline, and (b) inspect this data.
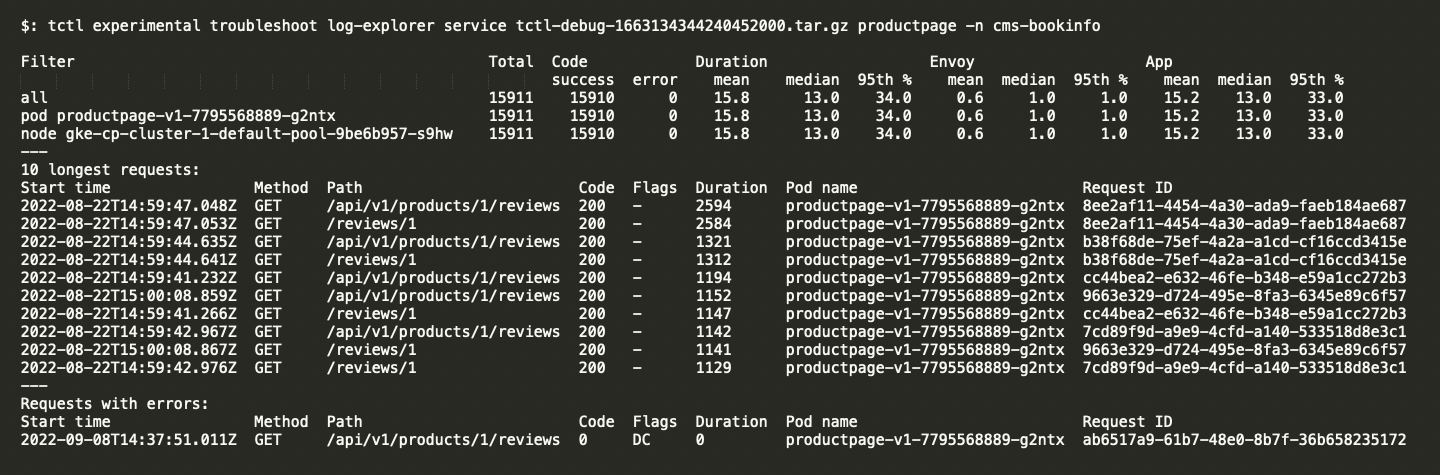 tctl tooling to inspect performance data tctl tooling to inspect performance data |
|---|
This capability can be used so that a Platform Owner can take a privileged dump of activity data and provide that to Application Owner teams for analysis.
For more details, refer to the documentation on How to Identify and Troubleshoot Underperforming Services