 Tetrate Service BridgeVersion: next
Monitor the Tetrate Management Plane
How to monitor the Tetrate Management Plane, identifying various failure conditions.
This document explains how you can monitor an active Tetrate Management Plane to detect possible failures. In the case that the Tetrate Management Plane fails, you can follow the [troubleshooting steps. If it proves impossible to recover the failed Management Plane, you can then start the failover process. You may wish to refer to Tetrate Technical Support for assistance with this procedure.
If your Management Plane appears to be functioning correctly, but one or more of your Workload clusters cannot connect, check out the Control Plane Troubleshooting guide.
Monitoring the Management Plane
The Tetrate Management Plane is exposed through a front-envoy service; the detailed flow describes the components that are proxied behind this service. You can health-check the Tetrate API and Metrics services through this endpoint, and you can export internal Prometheus metrics to generate a health dashboard for the Management Plane.
Health Check Requests
The simplest way to monitor the health of the TSB Management Plane is to query either the API service or the OAP service using simple HTTPS requests:
curl -D - -k -u USER:PASS https://TSB-FQDN/v2/organizations/MYORG/statuswill query the TSB API service tsb for the status of the organization MYORG, and return 200 OKcurl -D - -k -u USER:PASS https://TSB-FQDN/promql/api/v1/labelswill query the metrics service oap and return 200 OK
These health checks exercise the front-envoy and iam services, plus the relevant back-end service in the TSB Management Plane.
Management Plane Health Dashboards
You can monitor the correct operation of the Management Plane using the published Prometheus metrics. The
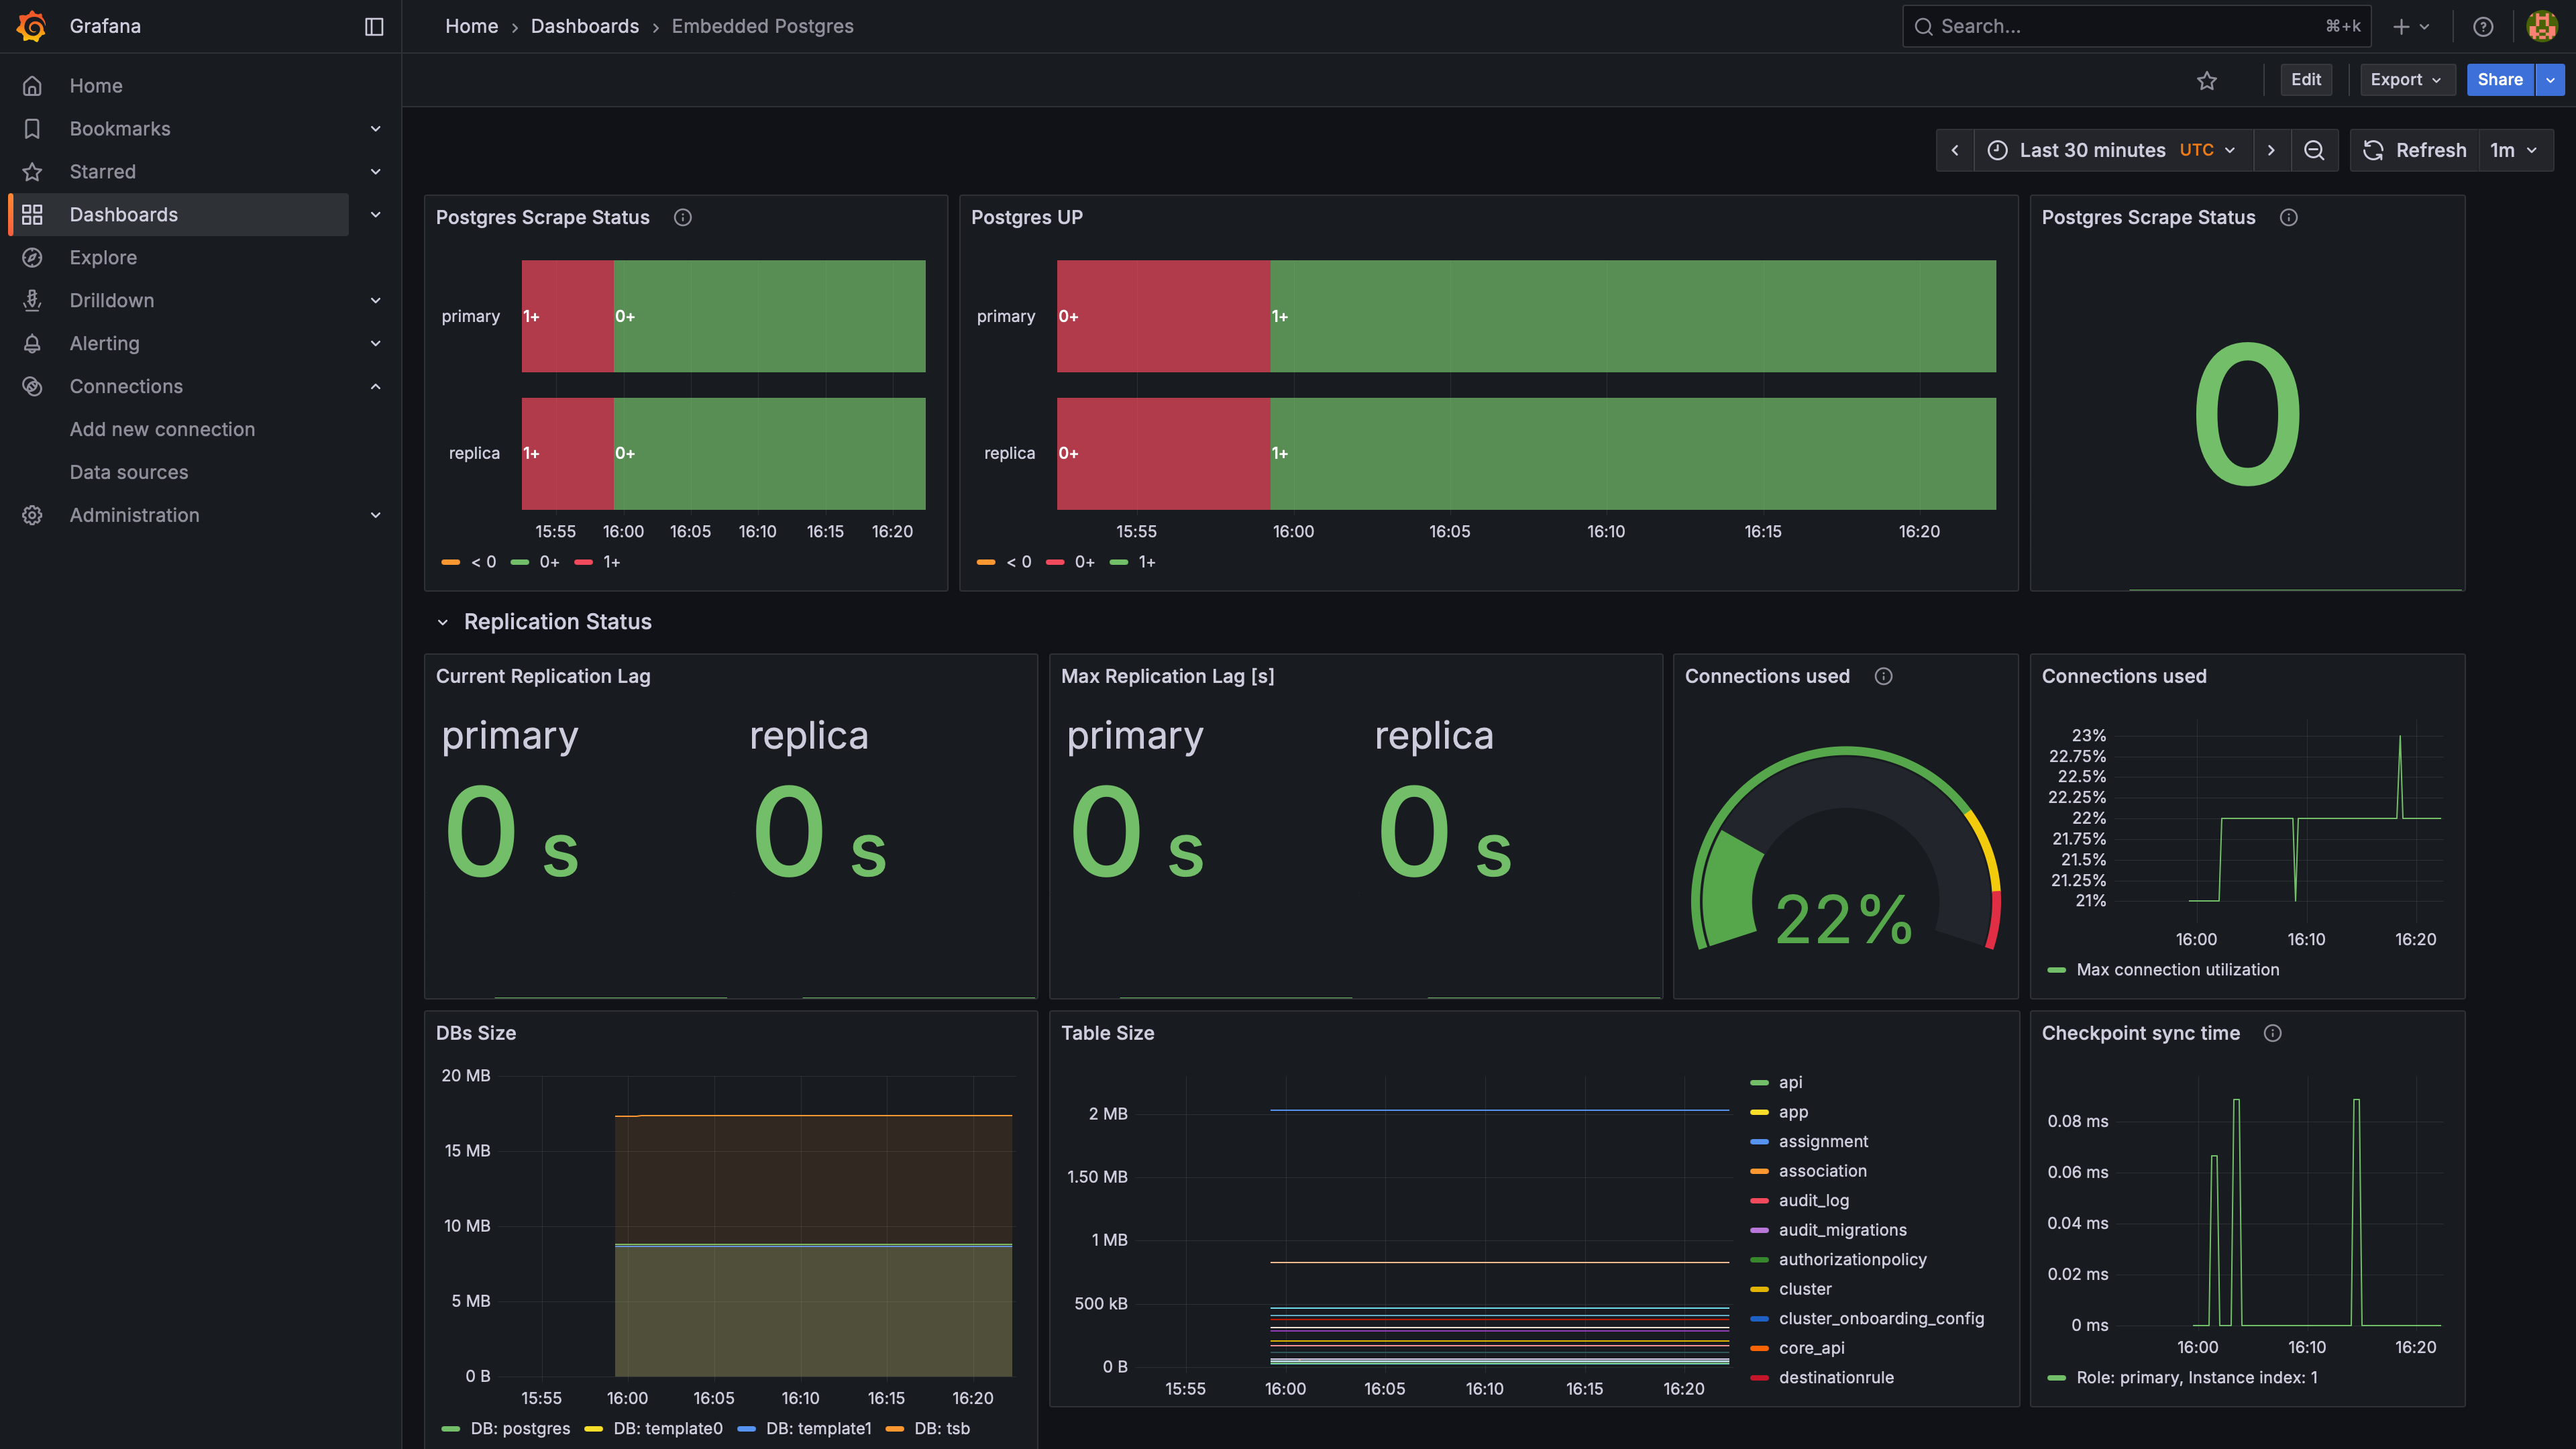
tctltool can quickly create a Grafana Dashboard to display the key TSB metrics:tctl experimental grafana dashboard: TSB Dashboard "Embedded Postgres"
Refer to the documentation for Key Metrics and Architecture / Getting Started to understand how to monitor these internal Management Plane metrics.
Next Steps
If a management plane component appears to have failed, you can: