 Tetrate Service BridgeVersion: next
Observe Traffic
In this exercise, you will send a constant stream of traffic to the application, through the gateway, and check the observability tools provided by TSB:
- Send traffic, using
wrkor another means - View the topology of the application
- Check key metrics and traces for a service
- View the logs for a service
- View the service dashboard
In TSB, Observability is near-real-time. Data (metrics and traces) is accumulated on each workload cluster and sent to the Management Plane every few seconds, where it is stored and indexed. The observability tools in the TSB UI inspect the stored data over the desired timescale and provide charts and traces.
You can use the time-range controls in each dashboard to control what time range you wish to view, making it easy to move backwards and forwards in time to isolate faults and investigate performance regressions.
Send Traffic to the Gateway
Useful observability data is gathered from real traffic. You can generate traffic in several ways:
-
Using the
wrktool. Following the instructions in the previous exercise, usewrkto send 30-second bursts of traffic, pausing for 5 seconds each time:while true ; do
wrk -c 10 -t 5 -d 30 -H "Host: bookinfo.tetrate.io" -H 'X-B3-Sampled: 1' http://${GW}/productpage
sleep 5
done -
Using
curl. This sends smaller volumes of traffic, as follows:while true ; do
curl -s -H "Host: bookinfo.tetrate.io" -H 'X-B3-Sampled: 1' http://${GW}/productpage
sleep 5
done
By default, TSB samples a small percentage of requests to generate trace information. If the X-B3-Sampled header is present, with a value of 1, all requests are sampled and traces are generated.
This is useful in a demo or lab environment, but this should be used with great care in a production scenario because of the great volume of data that is generated and submitted to the Tetrate Management Plane.
Observe the traffic
View the topology
In the TSB UI, navigate to the dashboard, and Select Clusters-Namespaces. Select the clusters and namespaces you wish to observe:
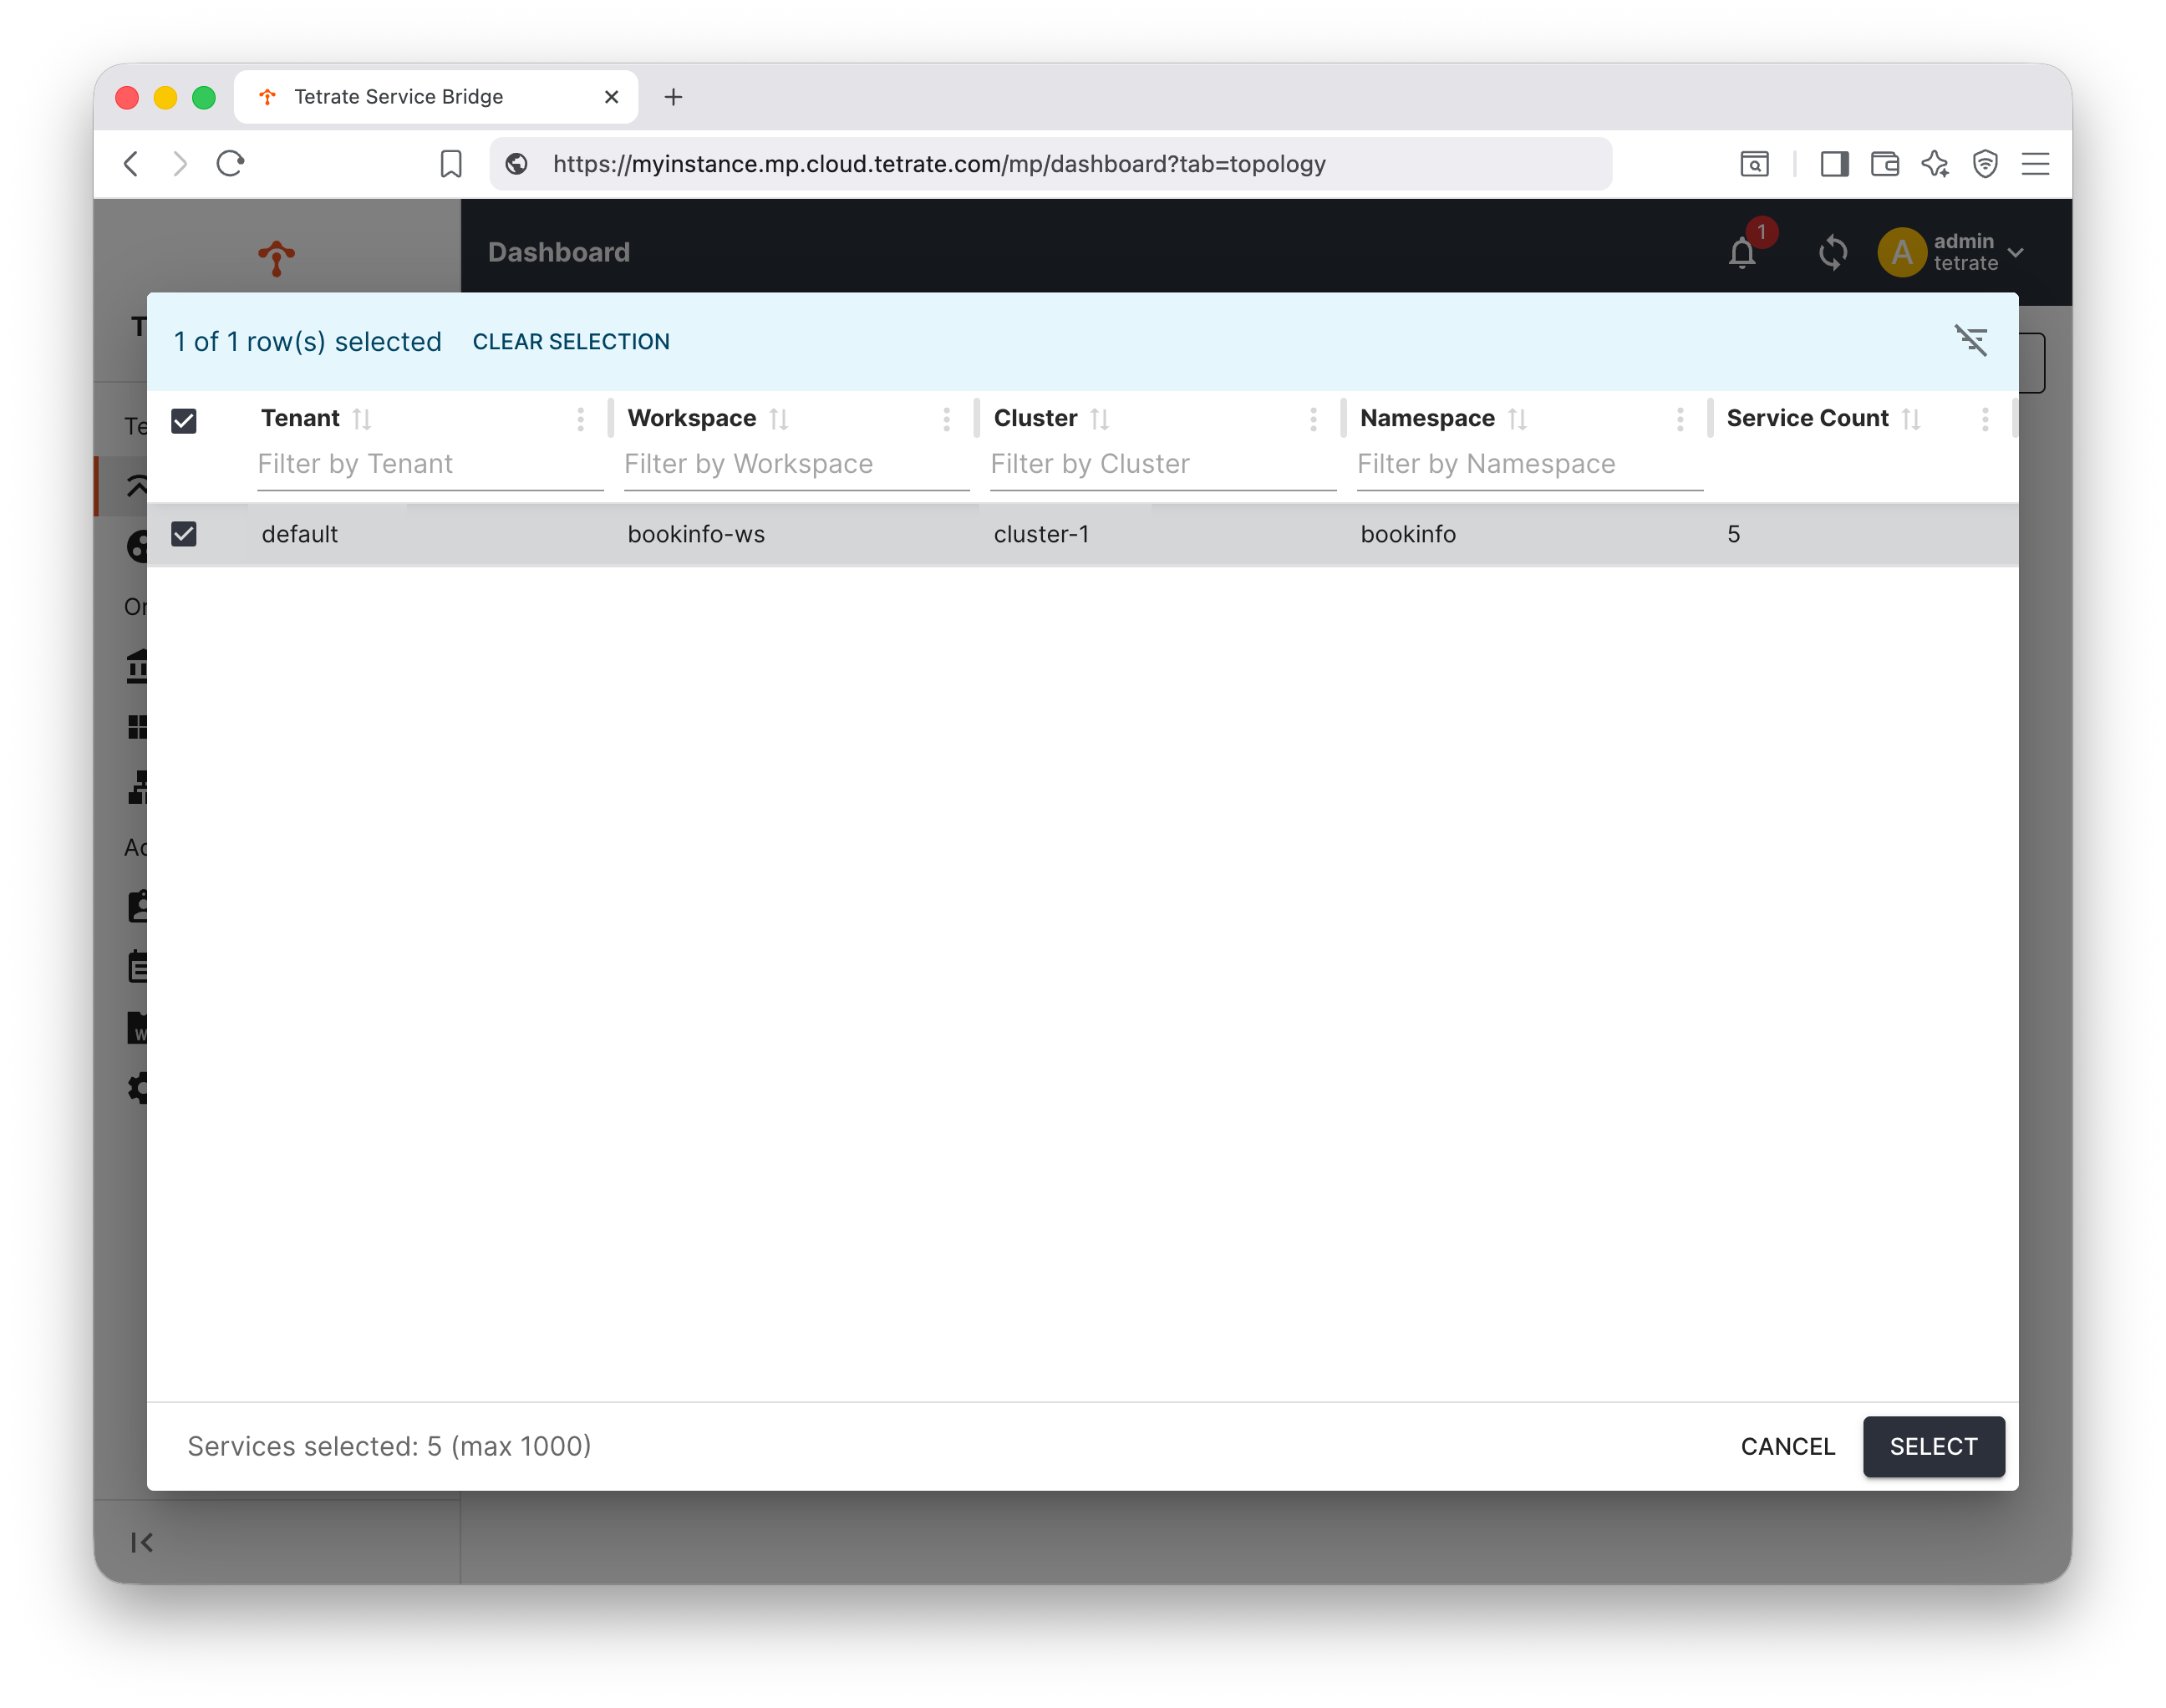
Select a recent time-range, and hit the 'Topology' display:
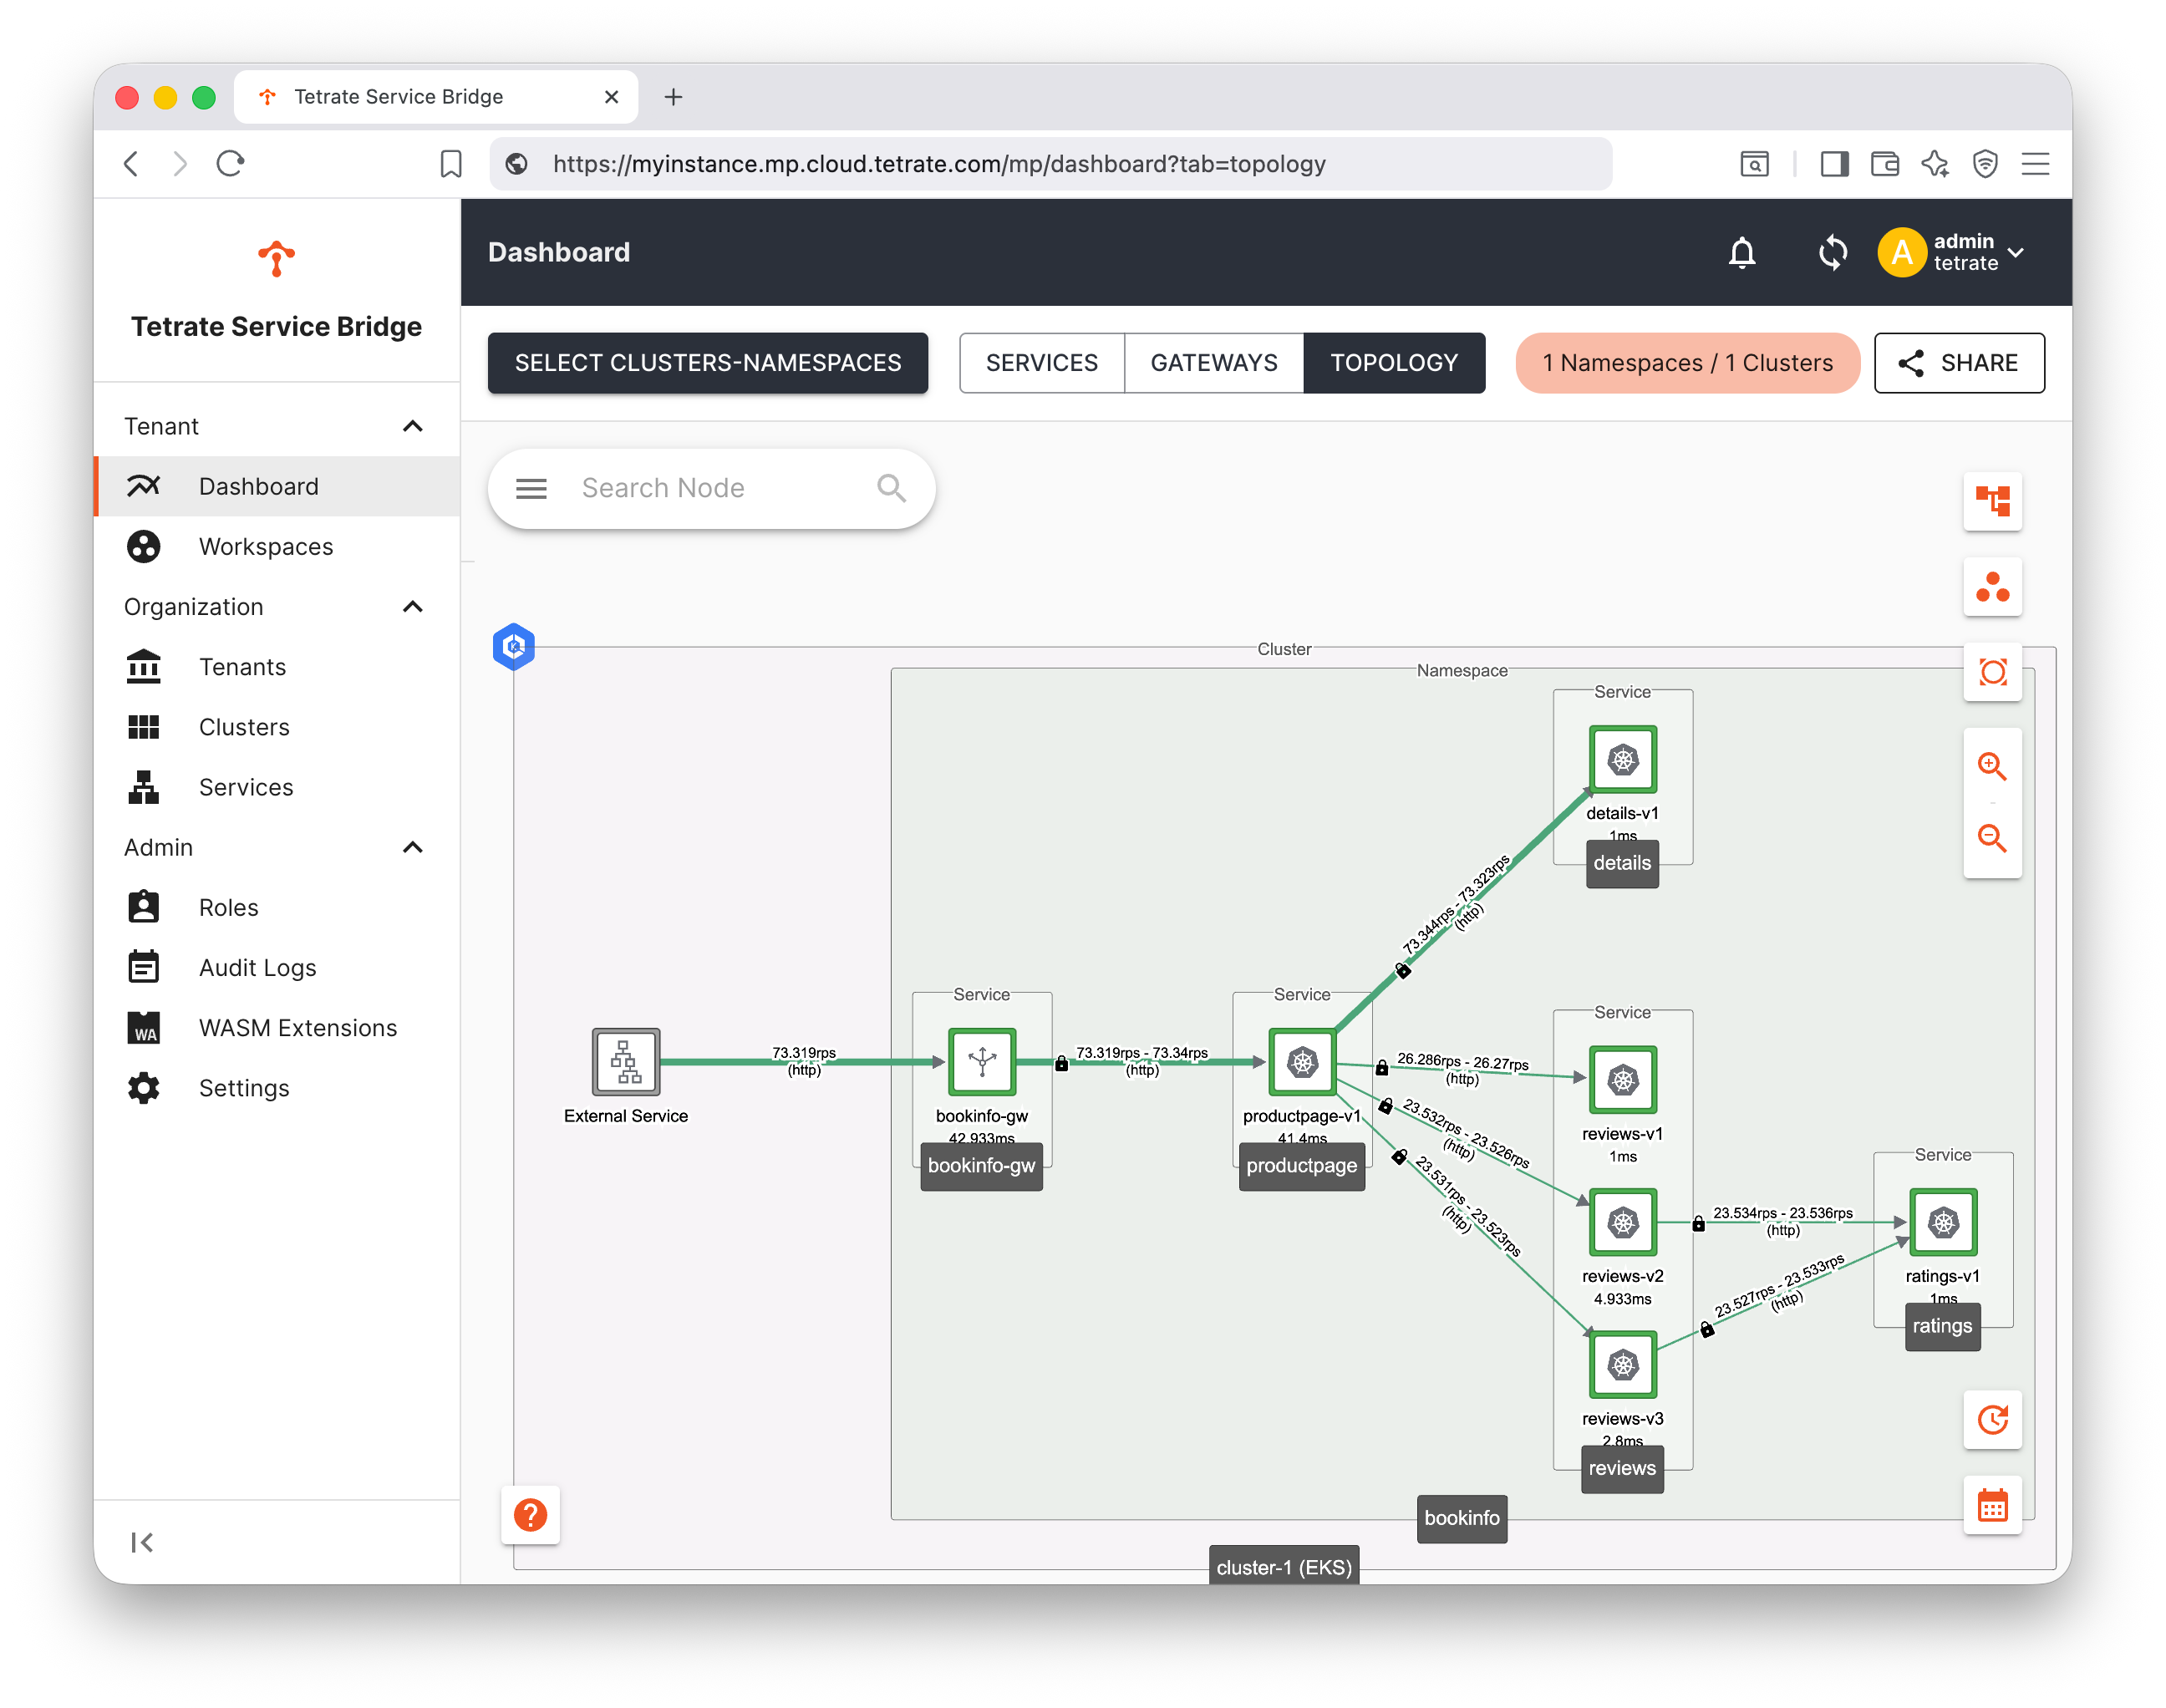
Explore the topology graph of the services in your clusters and namespaces, and look at the metrics relating to traffic volumes, latency and error rates. Experiment with the time-slider and refresh controls.
Metrics
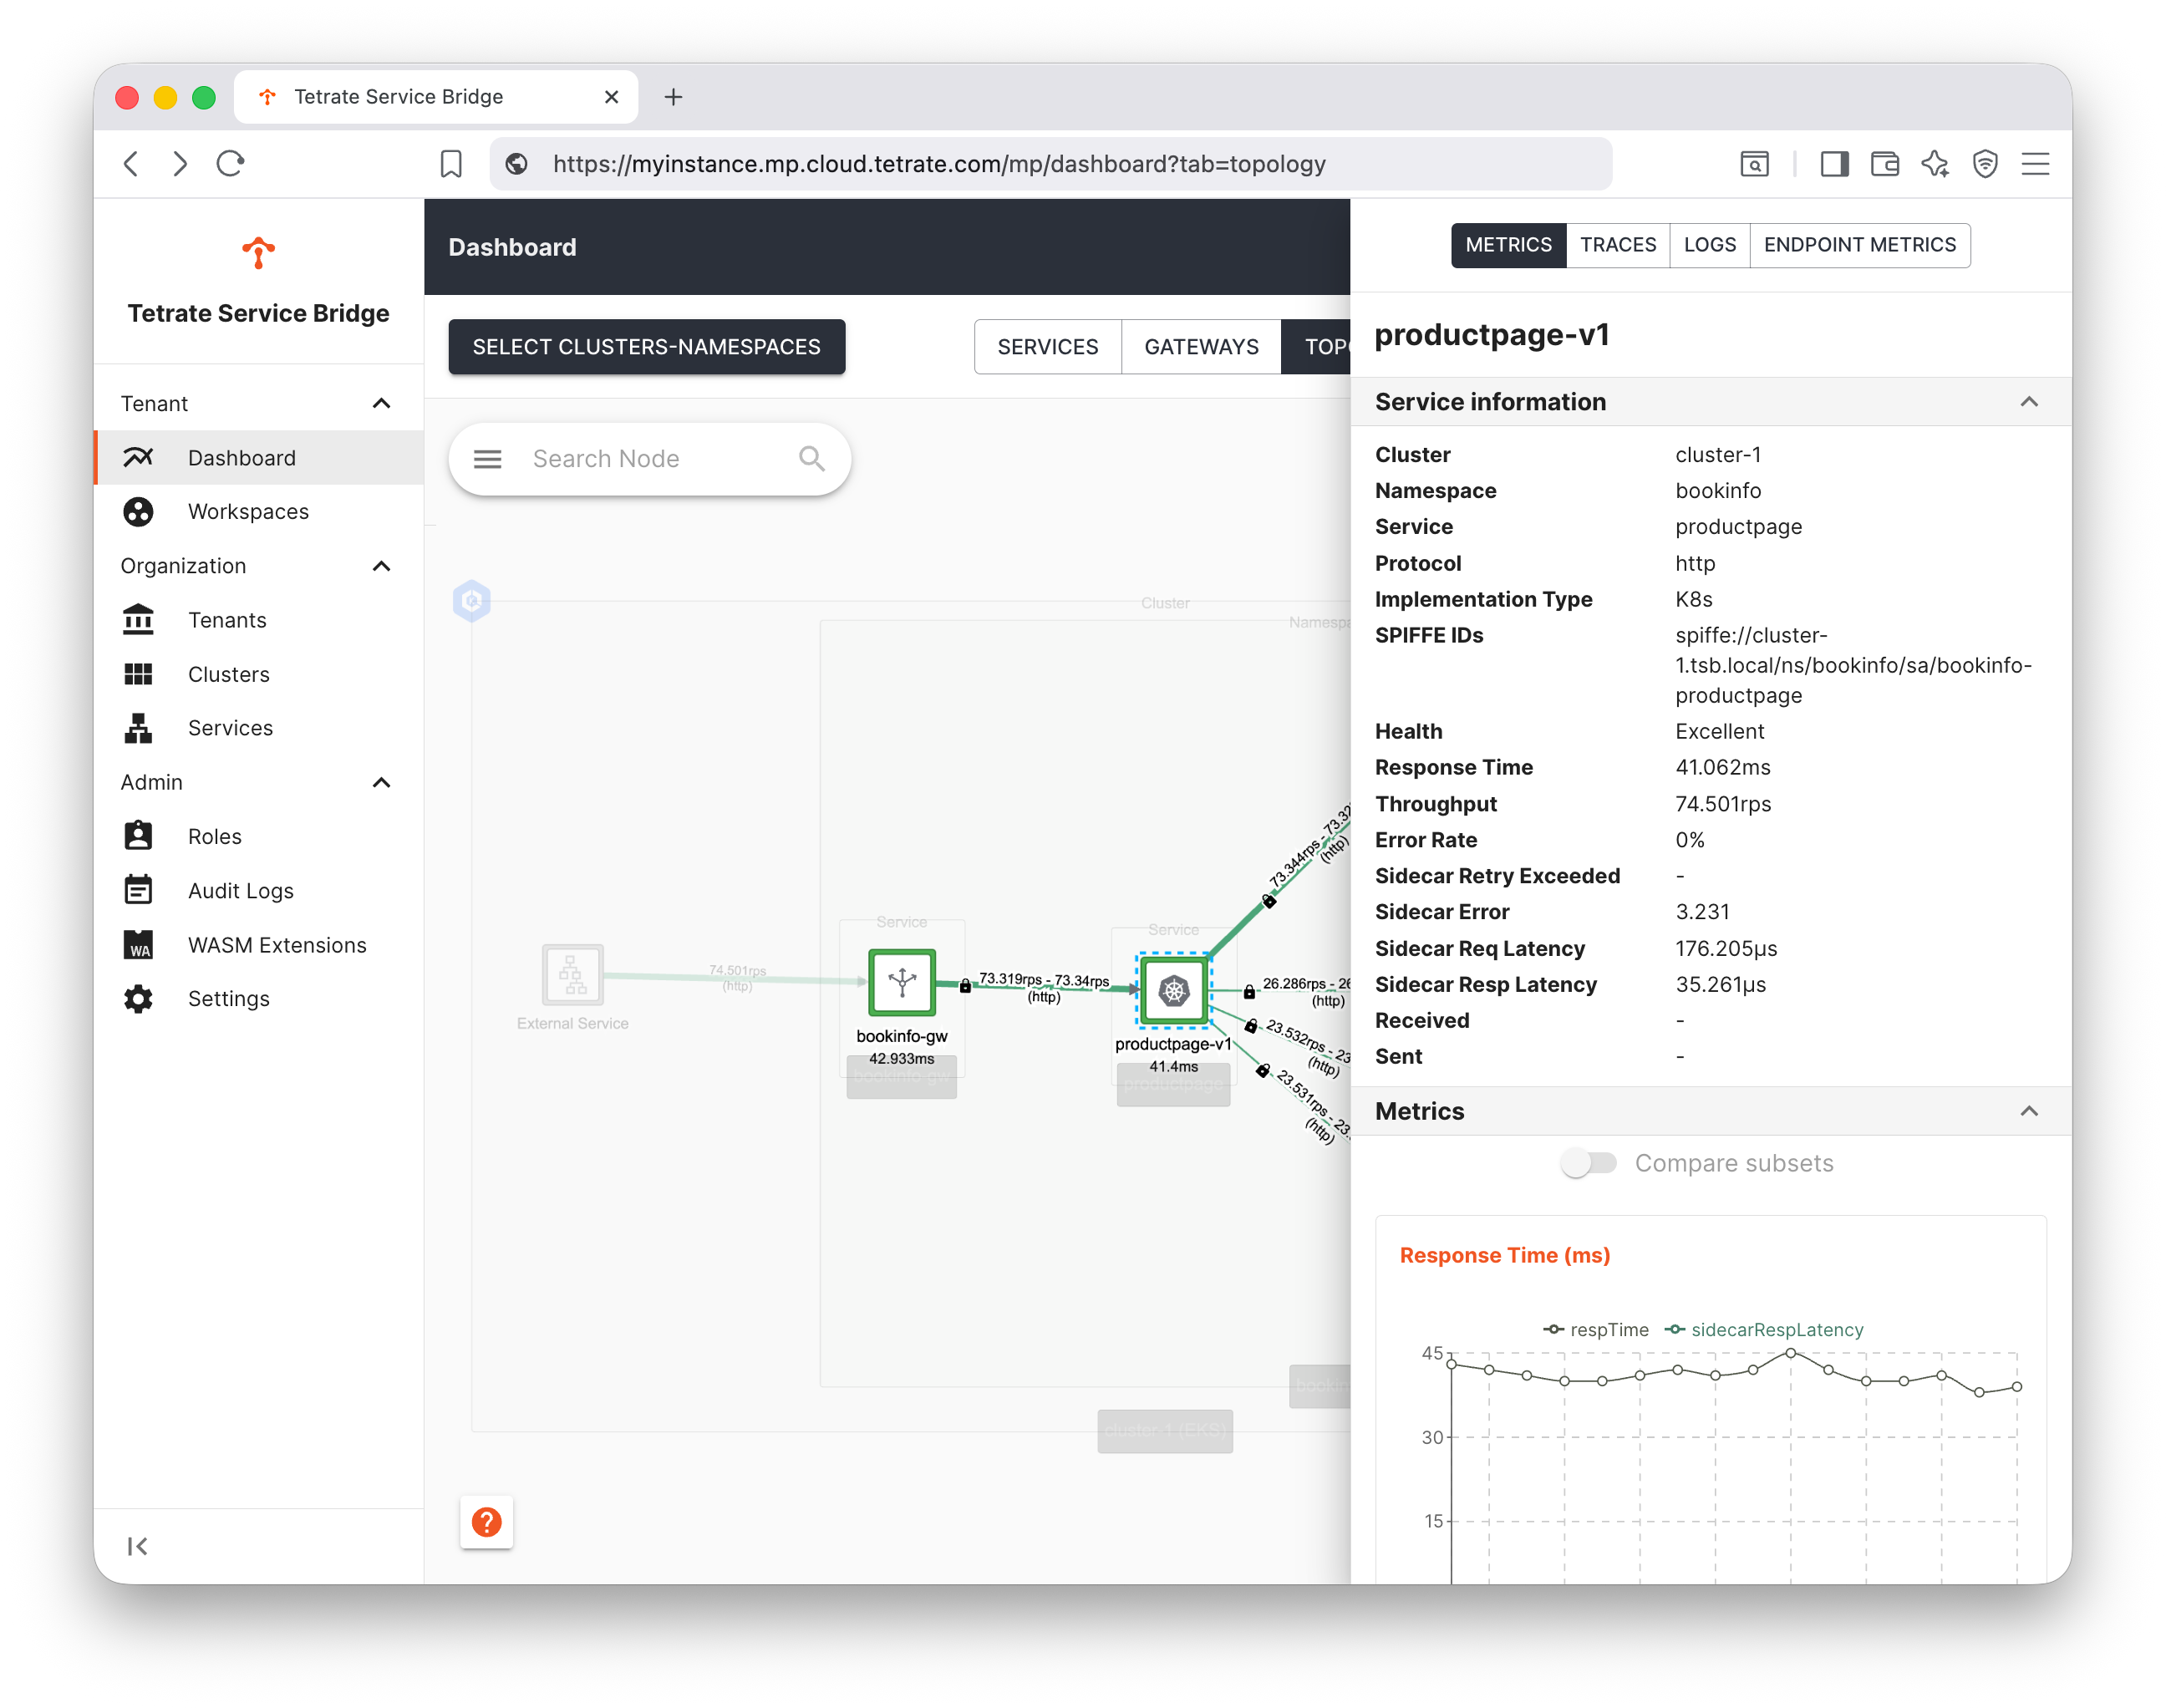
You can hover over an individual service instance to get more detailed metrics, or click for a fuller breakdown:
Traces
The TSB platform automatically samples requests and gathers trace data for a subset of requests (note the comment about X-B3-Sampled above).
Select one of the services, and click Trace to list the recent traces captured through that service. You can then explore the full trace, and identify traffic flows, timings and error events:
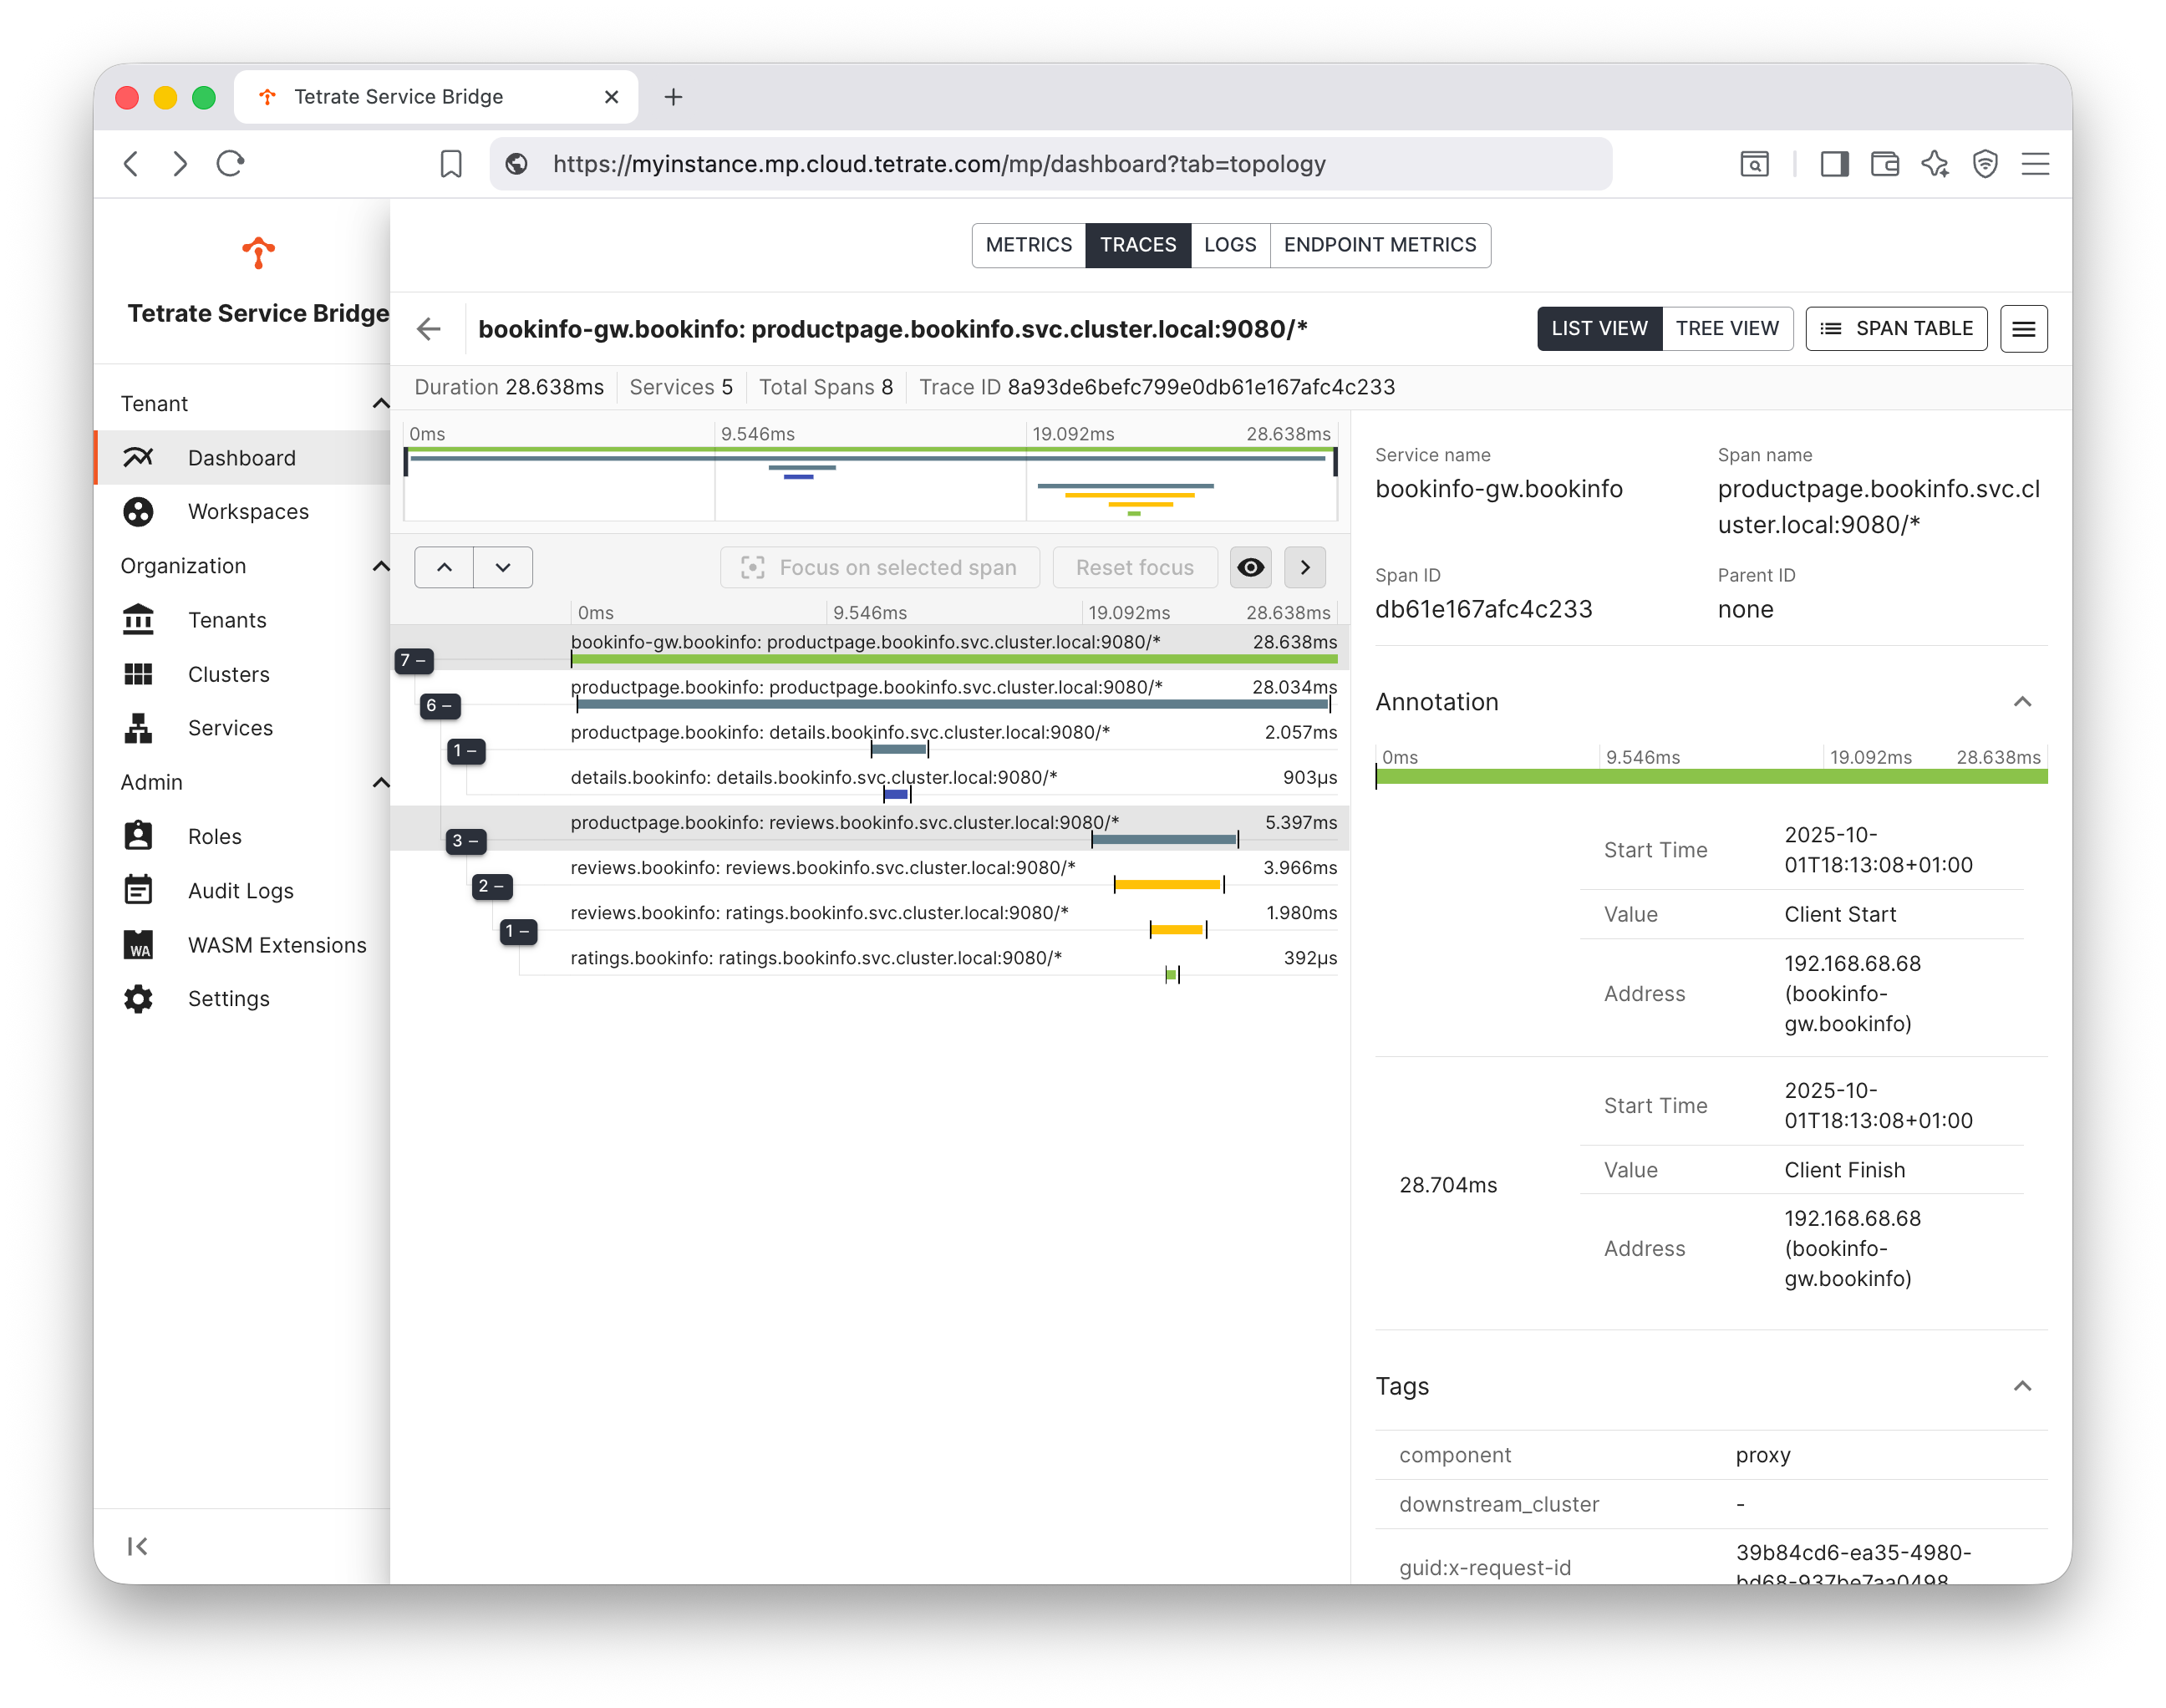
We can interpret this trace, understanding that:
- bookinfo-ingress-gw.bookinfo calls productpage.bookinfo.svc.cluster.local:9080, invoking service productpage in namespace bookinfo
- productpage.bookinfo first calls details.bookinfo.svc.cluster.local:9080, invoking details in namespace bookinfo
- productpage.bookinfo later calls reviews.bookinfo.svc.cluster.local:9080, invoking reviews in namespace bookinfo
- reviews.bookinfo calls ratings.bookinfo.svc.cluster.local:9080, invoking ratings in namespace bookinfo
We can see the deltas in time between the caller making the calls, and the callee reading and responding. The deltas correspond to the (typically small) latency of the network call and the mesh sidecar proxies.
For more complex call graphs, you can start from an internal service, thereby filtering out the front-end gateway and other front-end services.
- bookinfo-ingress-gw.bookinfo calls productpage.bookinfo.svc.cluster.local:9080, invoking service productpage in namespace bookinfo
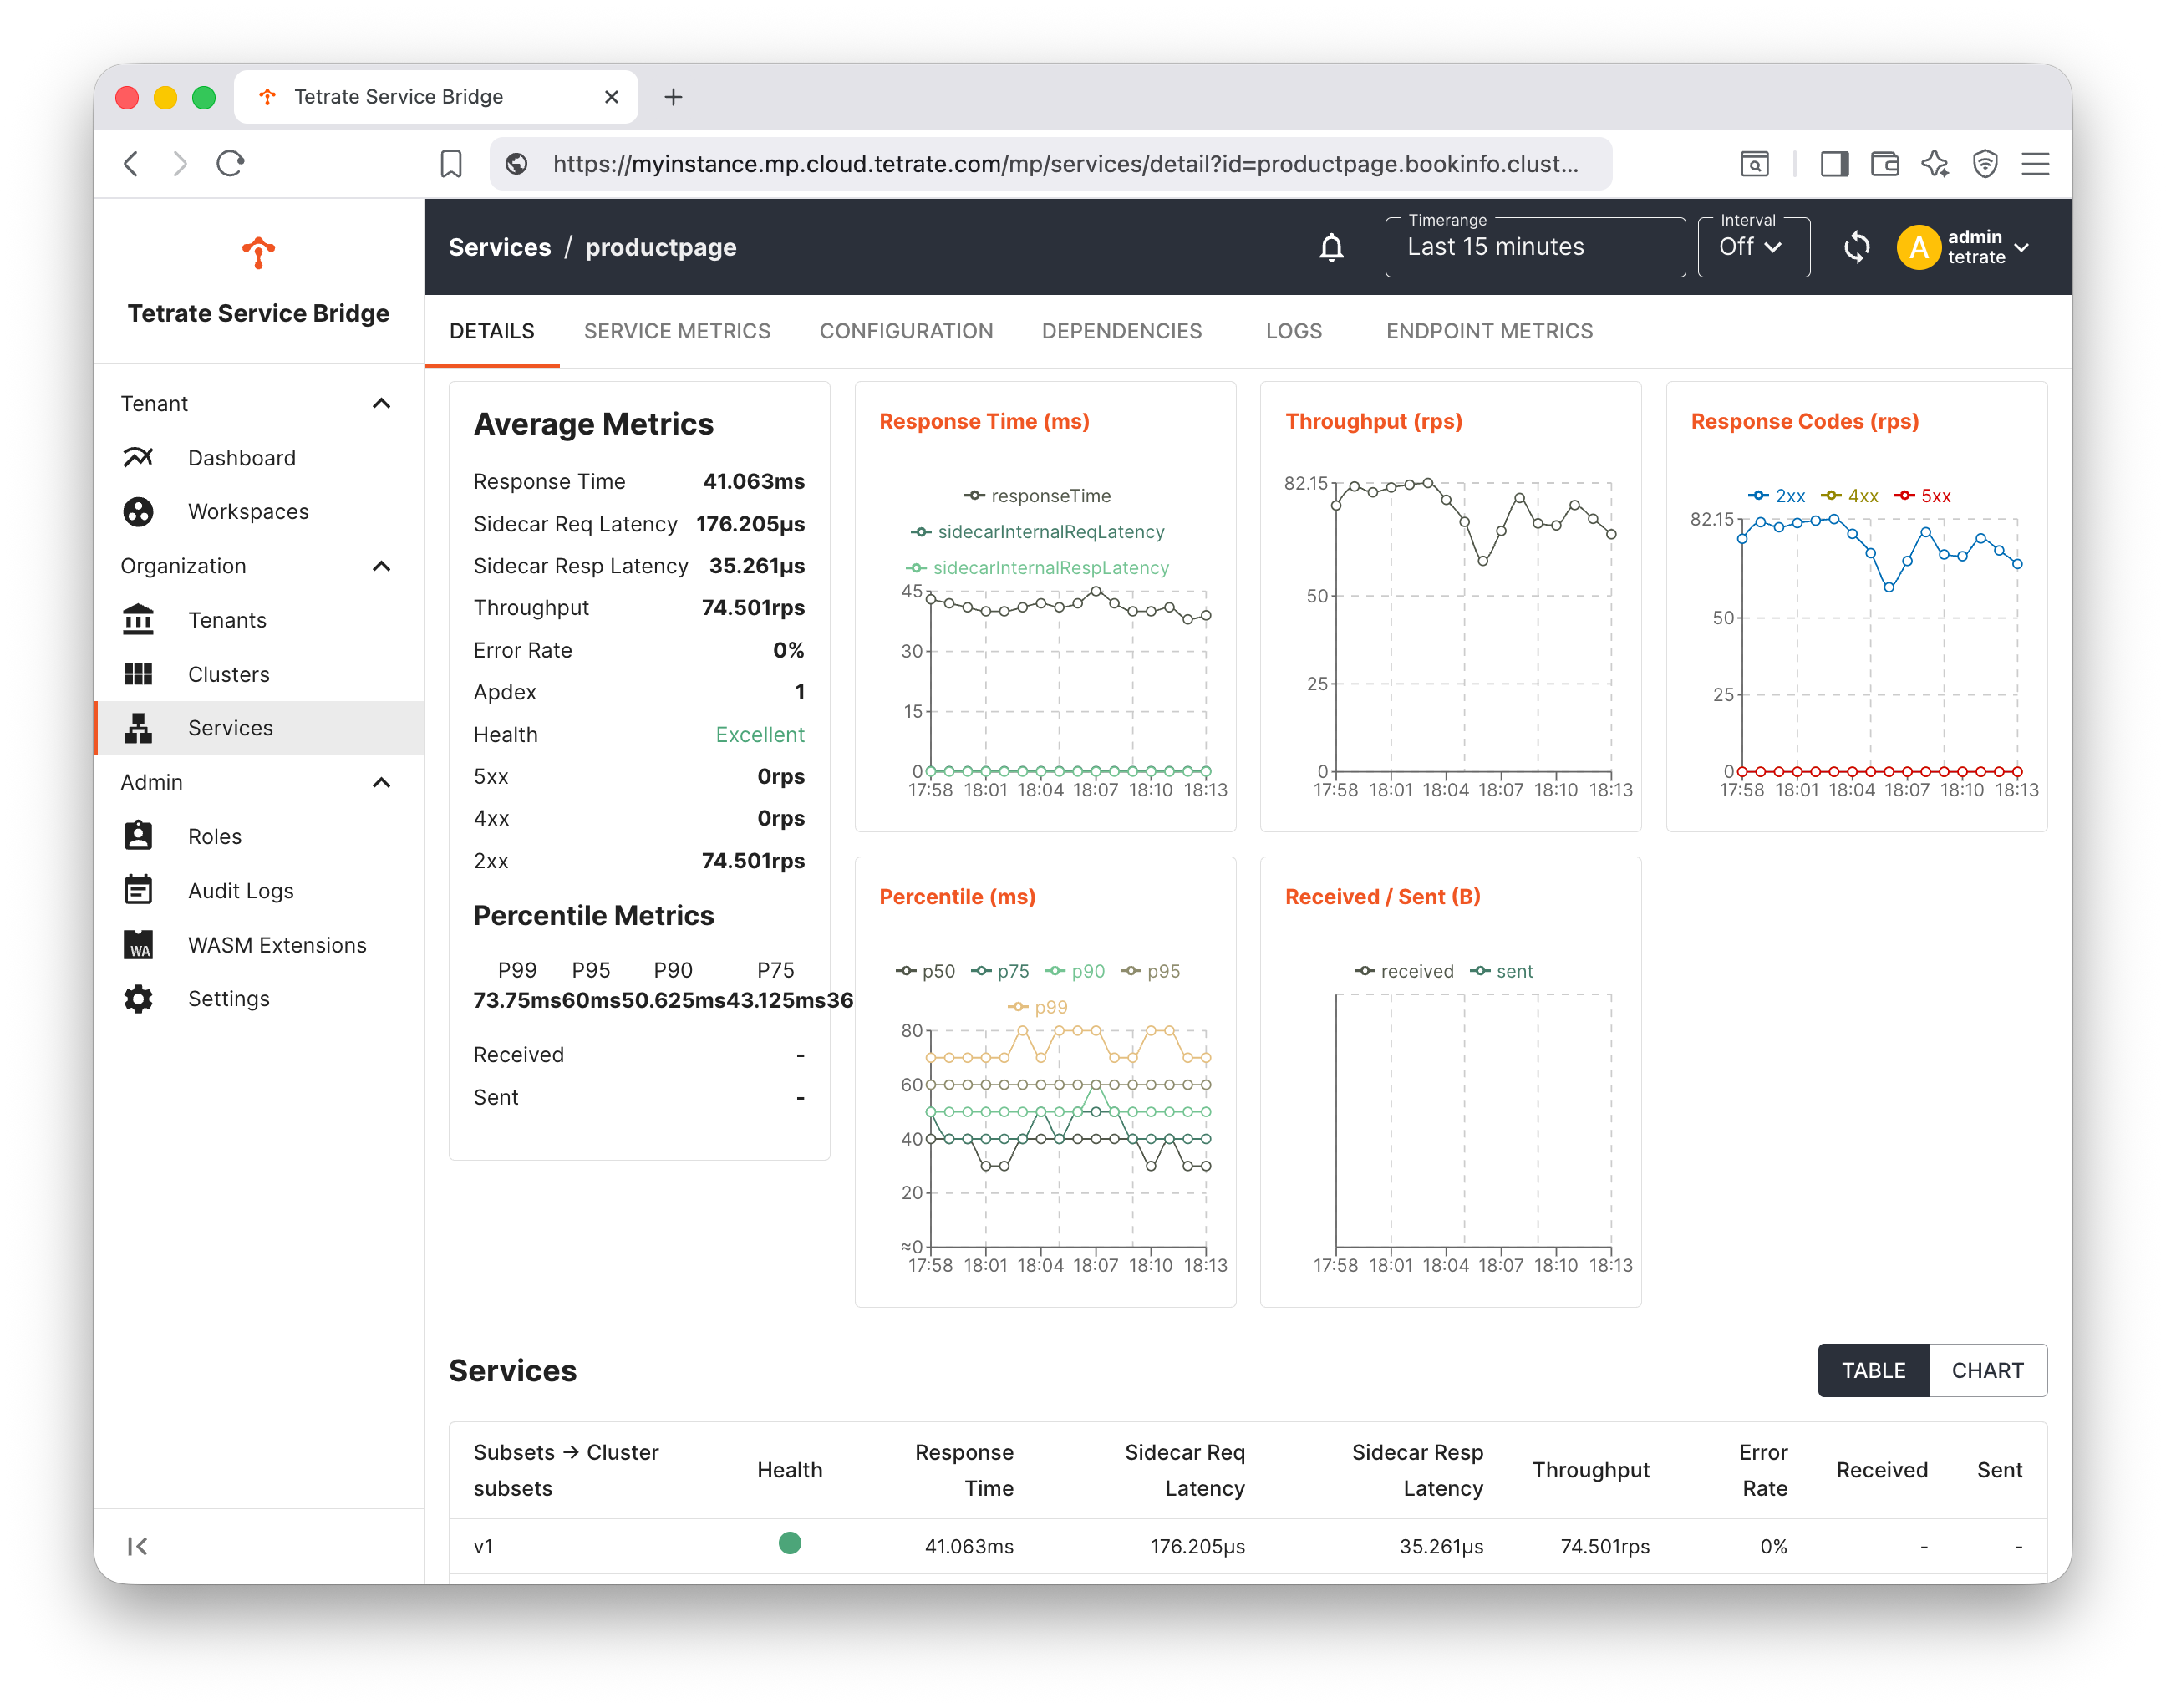
Services
Navigate to the Services pane in the UI and select one of the services. This reveals a rich, multi-pane dashboard from where you can drill down into a range of metrics relating to that service:
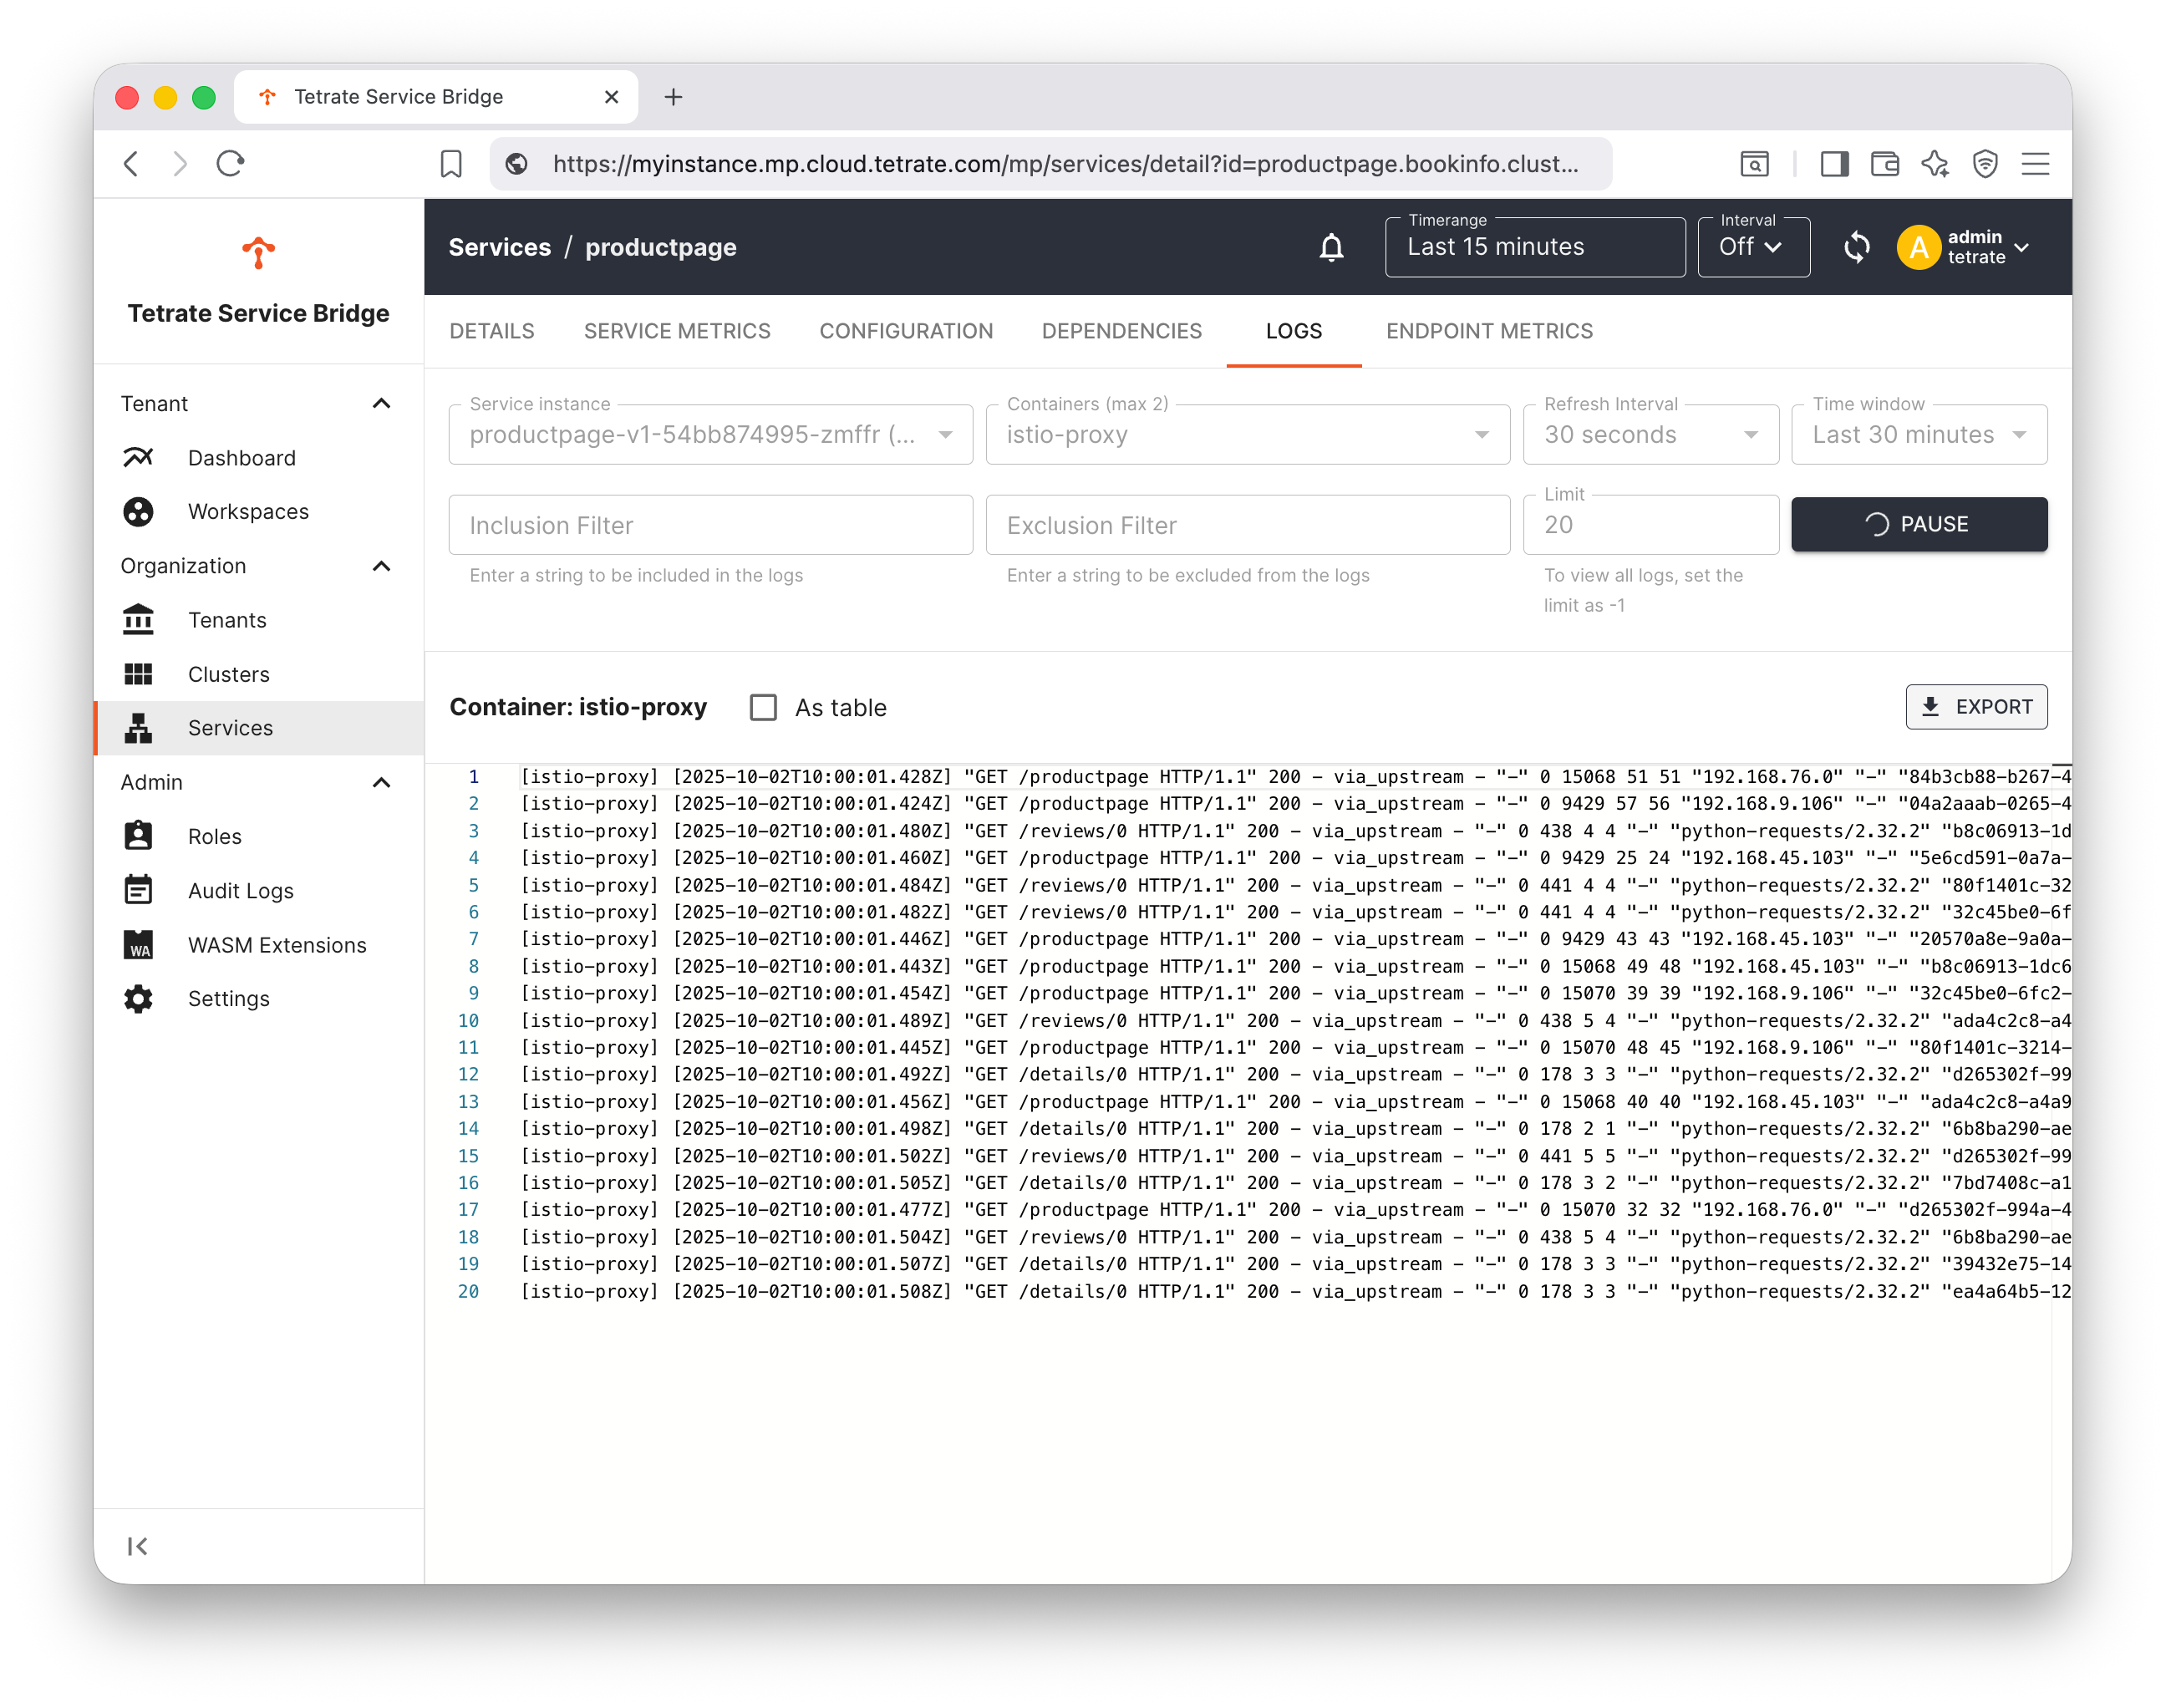
Logs
Finally, select the Logs tab for your selected service. From here, you can explore the sidecar amd other logs generated by that service:
What have we achieved?
Tetrate's observability platform is built on the Apache Skywalking project. It provides a long-term, searchable data store and a rich set of metrics and traces that are exposed through the TSB User interface. Metrics can also be exposed through a promql endpoint and scraped using third-party tools.