 Tetrate Service BridgeVersion: next
Service Metrics with PromQL
TSB OAP PromQL Service exposes service metrics, providing the same PromQL query language as the Prometheus server. Third-party systems or visualization platforms that already support PromQL (such as Grafana) can obtain metrics through PromQL Service in the TSB managed cluster.
Before you get started, make sure you:
✓ Familiarize yourself with TSB concepts
✓ Install the TSB demo environment
✓ Deploy the Istio Bookinfo sample app
The API Address
The PromQL API is provided by the oap (Observability Analysis Platform) service in the TSB Management Plane. It is exposed with the same address and authorization as the Web UI, and the base context path is promql.
${PROMQL_SERVICE_ADDRESS} = ${WEB_UI_ADDRESS}/promql
For example: if the Web UI address is https://localhost:8443, then the PromQL Service API address is https://localhost:8443/promql.
Usernames
You can use the built-in admin account and password to query the PromQL endpoint (https://localhost:8443/promql or similar). This can be used in a test environment, but means that dashboards built on this query cannot be shared with non-privileged users.
TSB also provides a non-privileged promql user account for the /promql endpoint was added. This account is disabled by default; it can be enabled as follows:
# Retrieve the current management plane values
helm get values managementplane -n tsb > values-mp.yaml

# Upgrade the managementplane, adding the secrets.tsb.promqlPassword value:
helm upgrade managementplane tetrate-tsb-helm/managementplane -n tsb -f values-mp.yaml --set secrets.tsb.promqlPassword=mypassword
Allow several minutes for the upgrade process to complete and the user to be provisioned.
When you perform this upgrade, TSB creates a dedicated, built-in promql user with the supplied password. This user is permitted to access the /promql endpoint only; it is unprivileged in the scope of TSB permissions. The SHA-256 hash of the password is stored (base64 encoded) in the admin-credentials Kubernetes Secret under the promql key in namespace tsb:
apiVersion: v1
data:
  admin: Mjc4ODg5OWQ1NjhiNDUzNDJhNGI4OWFhMmFjNjdmODRlMDNiYzQyOWU5MzU5ODI2MGM1Yjc1OTI0YmU1ZWJlMQ==
  promql: ODllMDE1MzZhYzIwNzI3OTQwOWQ0ZGUxZTUyNTNlMDFmNGExNzY5ZTY5NmRiMGQ2MDYyY2E5YjhmNTY3NjdjOA==
kind: Secret
...
Once TSB provisions this user, you can use the lesser-priviledged promql user:password promql:mypassword rather than the admin or other higher-privileged user for /promql queries, and in dashboards that you share.
Note that the Tetrate platform OAP metrics are not managed by the TSB RBAC controls. A user who can access the /promql endpoint has full access to all metrics. You should apply the necessary RBAC controls in the dashboards that you distribute.
Querying From the API
Querying Metadata
Metadata is the information about the metrics, such as the service name, instance name, endpoint name, and labels.
OAP's metadata exists in the following metrics(traffics):
- service_traffic
- instance_traffic
- endpoint_traffic
For example, querying all the services in the TSB managed cluster(Bookinfo):
curl -H "X-B3-Sampled: 1" -k -u '${user}:${pass}' ${PROMQL_SERVICE_ADDRESS}/api/v1/series -d 'match[]=service_traffic{layer="MESH"}&start=1677479336&end=1677479636'
The result could be:
{
    "status": "success",
    "data": [
        {
            "__name__": "service_traffic",
            "service": "-|bookinfo-gateway|bookinfo|demo|-",
            "scope": "Service",
            "layer": "MESH"
        },
        {
            "__name__": "service_traffic",
            "service": "v2|reviews|bookinfo|demo|-",
            "scope": "Service",
            "layer": "MESH"
        },
        {
            "__name__": "service_traffic",
            "service": "v1|details|bookinfo|demo|-",
            "scope": "Service",
            "layer": "MESH"
        },
        {
            "__name__": "service_traffic",
            "service": "v1|ratings|bookinfo|demo|-",
            "scope": "Service",
            "layer": "MESH"
        },
        {
            "__name__": "service_traffic",
            "service": "v3|reviews|bookinfo|demo|-",
            "scope": "Service",
            "layer": "MESH"
        },
        {
            "__name__": "service_traffic",
            "service": "v1|reviews|bookinfo|demo|-",
            "scope": "Service",
            "layer": "MESH"
        },
        {
            "__name__": "service_traffic",
            "service": "v1|productpage|bookinfo|demo|-",
            "scope": "Service",
            "layer": "MESH"
        }
    ]
}
You also can query all the services through API /api/v1/label/{label_name}/values, this API usually used for the Grafana variable query:
curl -H "X-B3-Sampled: 1" -k -u '${user}:${pass}' ${PROMQL_SERVICE_ADDRESS}/api/v1/label/service/values -d 'match[]=service_traffic{layer="MESH"}'
The result could be:
{
    "status": "success",
    "data": [
        "-|bookinfo-gateway|bookinfo|demo|-",
        "v1|ratings|bookinfo|demo|-",
        "v1|reviews|bookinfo|demo|-",
        "v1|details|bookinfo|demo|-",
        "v3|reviews|bookinfo|demo|-",
        "v2|reviews|bookinfo|demo|-",
        "v1|productpage|bookinfo|demo|-"
    ]
}
The following definitions apply to TSB
- Service Format Definition,
subset|service name|namespace name|cluster|-. For example,v2|reviews|bookinfo|demo|- - Hostname based virtual service Format Definition,
hostname|proxy service name|cluster name|env name. For example,bookinfo.com|bookinfo-gateway|demo|- - Layer Definition, All the metrics in the TSB managed cluster belong to the
MESHlayer.
Here are 2 ways to limit the number of metadata(service_traffic) results:
- Use
limitparameter in the query URL:
curl -H "X-B3-Sampled: 1" -k -u '${user}:${pass}' ${PROMQL_SERVICE_ADDRESS}/api/v1/label/service/values -d 'match[]=service_traffic{layer="MESH"}&limit=3'
- Use
limitas a label in thematch[]parameter:
curl -H "X-B3-Sampled: 1" -k -u '${user}:${pass}' ${PROMQL_SERVICE_ADDRESS}/api/v1/label/service/values -d 'match[]=service_traffic{layer="MESH", limit="3"}'
If the limit is not set by parameter or label, the default value is 100. And If the limit set in the query parameter and label both, will return the min number of the two.
For filtering the metadata(service_traffic), you can use the =,!=,=~,!~ in the service label to filter the results.
For example, if you want to filter the service name with reviews, you can use the following command:
curl -H "X-B3-Sampled: 1" -k -u '${user}:${pass}' ${PROMQL_SERVICE_ADDRESS}/api/v1/label/service/values -d 'match[]=service_traffic{layer="MESH", service=~"[^*]*\|reviews\|bookinfo\|demo\|-"}'
The result should be:
{
    "status": "success",
    "data": [
        "v1|reviews|bookinfo|demo|-",
        "v2|reviews|bookinfo|demo|-",
        "v3|reviews|bookinfo|demo|-"
    ]
}
Please read the Finding series by label matchers and Querying label values for more details.
Querying Metrics
For example, querying the Service Avg Response Time metric for the v1|productpage|bookinfo|demo|- service in 5 minutes:
curl -H "X-B3-Sampled: 1" -k -u 'admin:admin' https://35.220.249.46:8443/promql/api/v1/query -d 'query=service_resp_time{service="v1|productpage|bookinfo|demo|-", layer="MESH"}[5m]'
The result could be:
{
    "status": "success",
    "data": {
        "resultType": "matrix",
        "result": [
            {
                "metric": {
                    "__name__": "service_resp_time",
                    "layer": "MESH",
                    "scope": "Service",
                    "service": "v1|productpage|bookinfo|demo|-"
                },
                "values": [
                    [
                        1680861600,
                        "24"
                    ],
                    [
                        1680861660,
                        "24"
                    ],
                    [
                        1680861720,
                        "27"
                    ],
                    [
                        1680861780,
                        "23"
                    ],
                    [
                        1680861840,
                        "24"
                    ],
                    [
                        1680861900,
                        "28"
                    ]
                ]
            }
        ]
    }
}
Please read the PromQL Service document for more details.
Build Grafana Dashboard
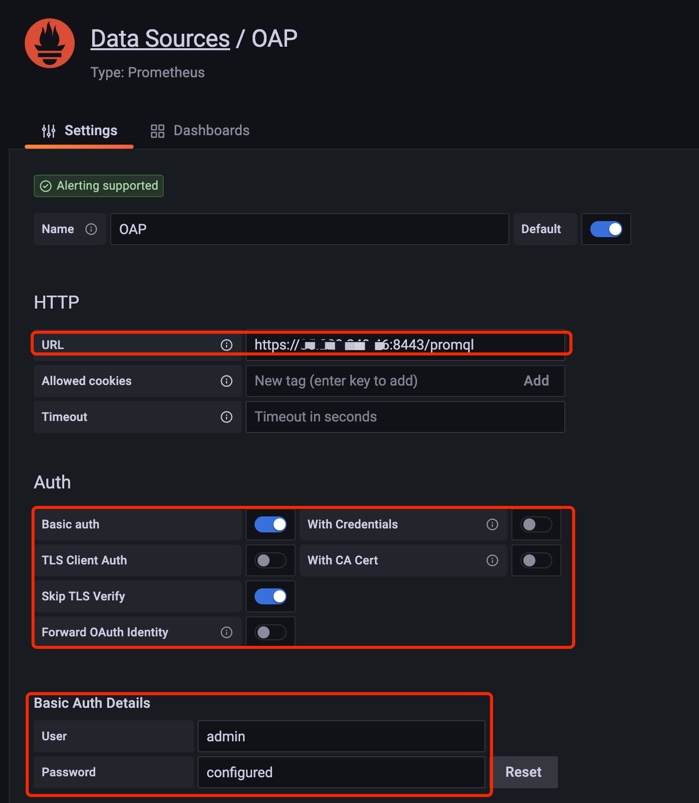
Config Data Source
- In the data source config panel, chose the
Prometheustype. - Set the
URLto the OAP PromQL Service address. - Select
Basic authand fill in theUserandPassword. - Click the
Save & Testbutton to test the connection.
Add Dashboard
When you complete the data source configuration, you can add a dashboard to visualize the metrics. The following example dashboards are a good starting point:
- Service Metrics dashboard file
- Hostname Metrics dashboard file
- Service relation metrics dashboard file
Import one of these dashboards to Grafana; once sufficient telemetry has been collected, you will be able to chart activity as follows:
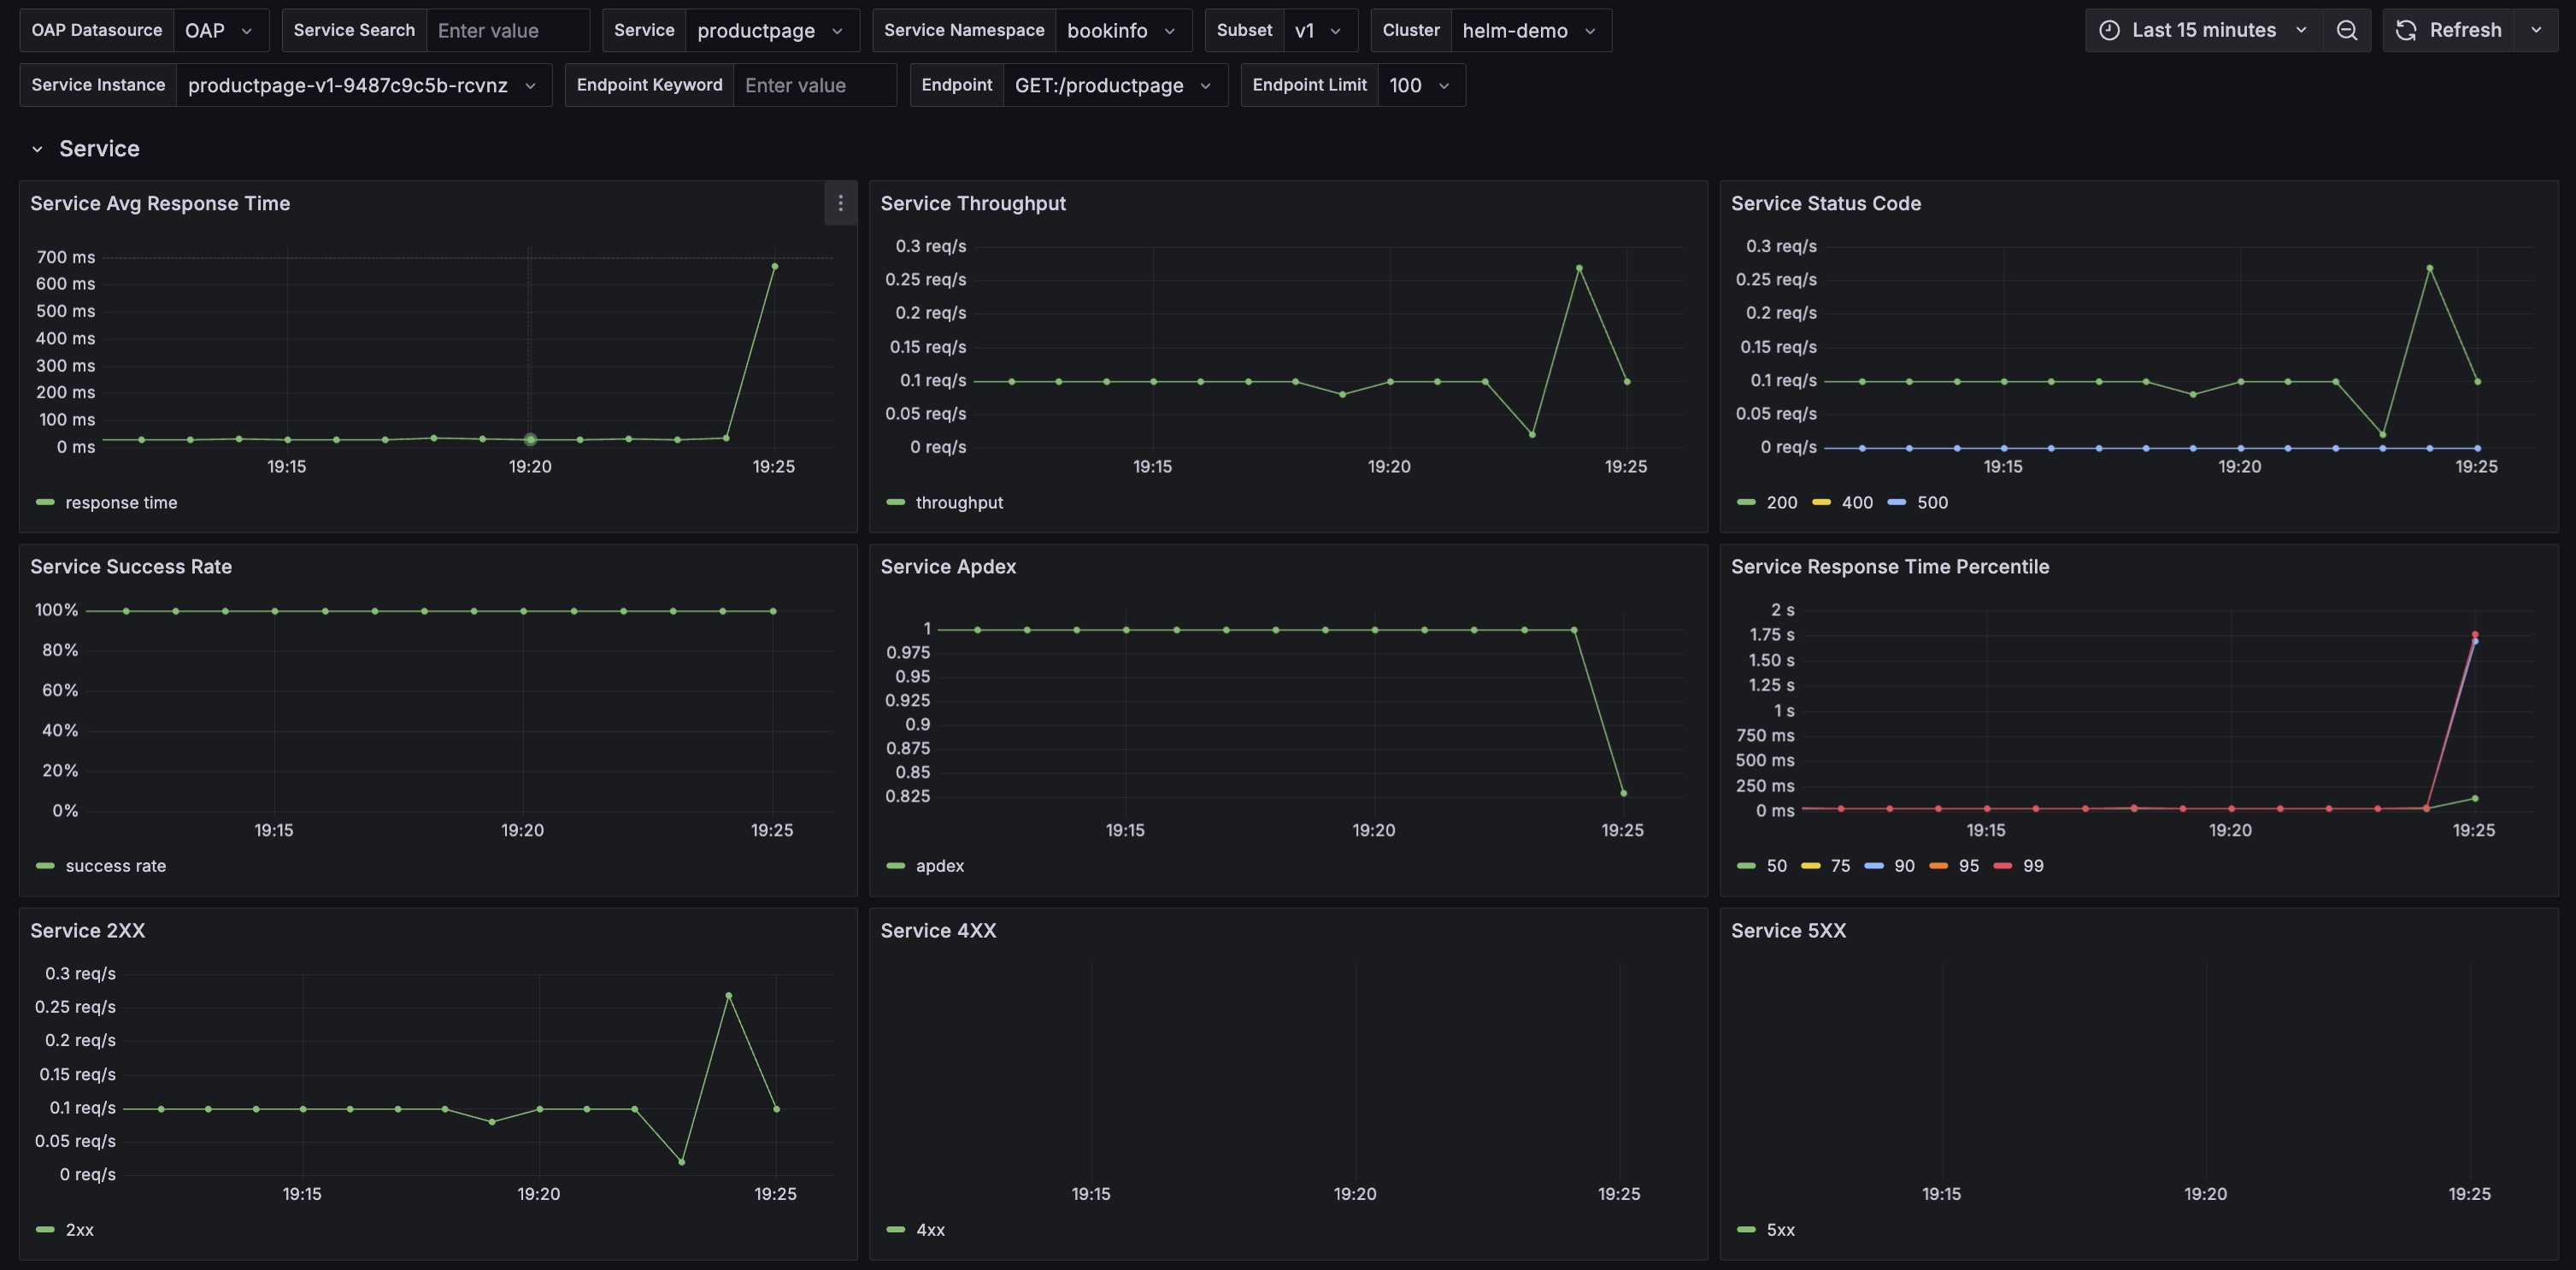
Please read the Use Grafana As The UI document for more details.
The dashboards service variable query limitation and filter are based on bookinfo example, you can modify it according to your requirement.