 Tetrate Service BridgeVersion: 1.14.x
Alerting Guidelines
Tetrate Service Bridge collects a large number of metrics and the relationship between those, and the threshold limits that you set will differ from environment to environment. This document outlines the generic alerting guidelines rather than providing an exhaustive list of alert configurations and thresholds, since these will differ between different environments with different workload configurations. These dashboards are intended to be installed only in the management plane cluster.
The alerting configuration using Prometheus Operator CR can be downloaded from here.
For more information on how to configure PrometheusRules, refer to
official Prometheus documentation.
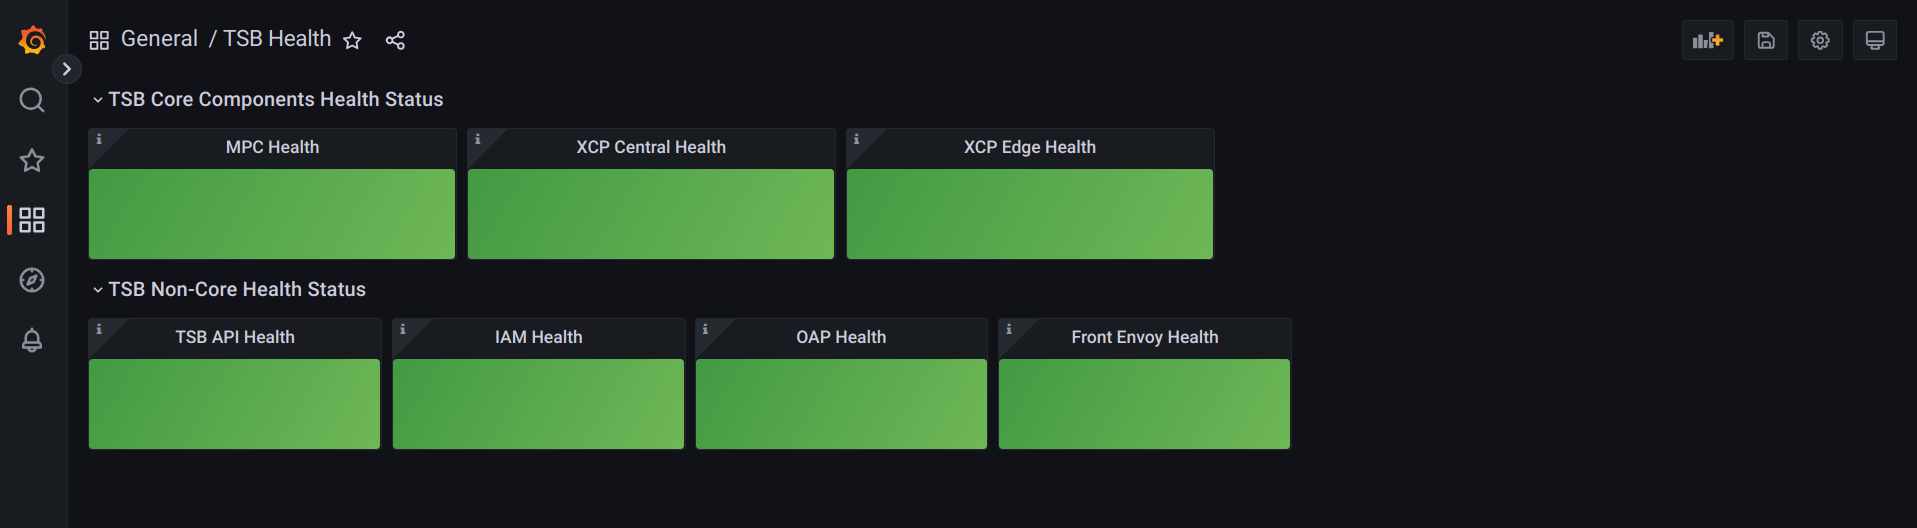
TSB Health Status
Dashboard indicating key components health for fast diagnosis.
Green or red colored panels for each TSB component, which is automatically diagnosed based on current metrics contrasted against its historic and weighted by severity.
You can find it in the Grafana Dashboards download button here.
The dashboard is divided into core (top) and non-core (bottom) components.
A red light indicates it is urgent to check the given component's health, whether
it is down, unable to report metrics, or the reported metrics indicate an uncommon
behavior. Take this example with edge. As it is distributed in each control plane,
you must dig deeper into which one and why it is being reported:
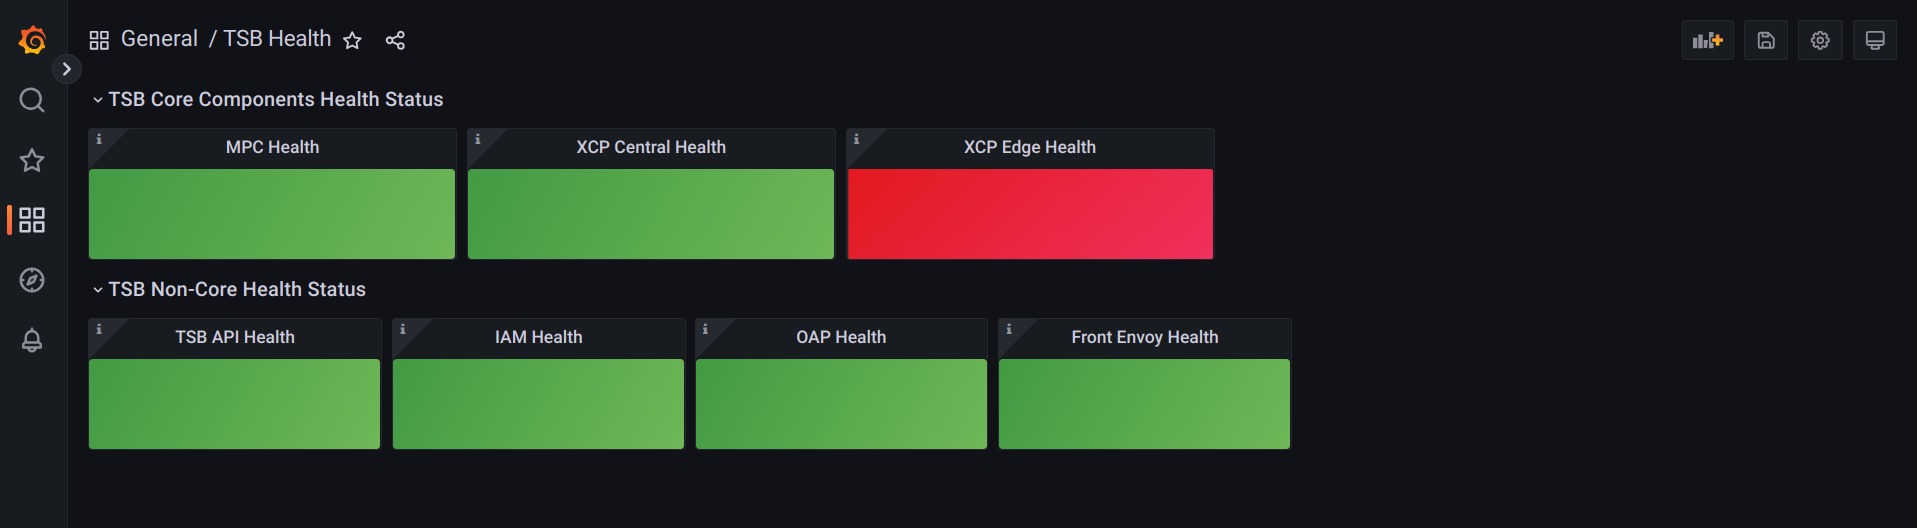
After identifying a failing component it is recommended to also check the more detailed alerts described later in this section: TSB and XCP Operational Status.
This tool is specially useful once your clusters are set up and operational. Early stages clusters, e.g. with incomplete onboardings, may fail to provide the necessary data for this diagnosis to be accurate.
Components dependencies
Since each component is tightly dependant upon the operation of the others, in some
situations the failure of one will also trigger a red light on a different one. This is
because of the nature of the metrics selected to diagnose the components.
It is specially the case of envoy in the management plane: if it fails, edge,
tsb and iam will have false positives. Be aware of the
dependencies so you can debug the right direction.
| MPC | XCP | XCPed | API | IAM | OAP | Envoy | |
|---|---|---|---|---|---|---|---|
| MPC | - | ||||||
| XCP | - | ||||||
| XCPed | - | ||||||
| API | - | ||||||
| IAM | - | ||||||
| OAP | - | ||||||
| Envoy | dep | dep | dep | - |
TSB Operational Status
Alerts describing the health of TSB API Management Plane components.
TSB Absent Metrics
TSB talks to its persistent backend even without constant external load. An absence of requests reliably indicates an issue with TSB metrics collection, and should be treated as a high-priority incident as the lack of metrics means the loss of visibility into TSB's status.
Check the health of the metrics ingestion infrastructure - from TSB's
otel-collector to your Prometheus installation.
TSB Request Traffic
The raw rate of requests to TSB API. The monitoring value comes principally from detecting outliers and unexpected behaviour, e.g. the rate of requests dropping to 0.
Things to check:
- health of the cluster ingress.
- health of TSB ingress infrastructure (e.g. AWS ALB etc).
- health of the metrics ingestion and processing infrastructure, i.e. Prometheus.
- possible DNS misconfiguration.
- inspect the TSB Front Envoy logs for any additional clues (e.g. TSL termination errors, TSB cluster network partitioning signs etc).
TSB API Availability
The rate of successful requests to TSB API. This is an extremely user-visible signal and should be treated as such.
Drill down to the "TSB Error Rate" panel in the "TSB Operational Status"
dashboard to find which gRPC method is
producing errors. To troubleshoot further, consult the deployments/tsb logs.
For example, if the leading source of errors is e.g. GetTenant, searching the
tsb component logs for the lines containing this method may provide
additional insight into the nature of the errors.
Front Envoy Availability
The rate of successful requests to TSB Management Plane Front Envoy. TSB
Management Plane Envoy Gateway (front-envoy) terminates all incoming requests
to TSB Management Plane components. This alert is MUST be inhibited if the "TSB
API Availability" alert is firing. Refer to Alertmanager
docs
on how to configure alert inhibition.
The monitoring value of this alert is "catch high error rates of non-API TSB
components, e.g. Control Plane sync, metrics propagation etc".
Drill down to the "Front Envoy Error Rate" panel in the "TSB Operational
Status" dashboard to to narrow down
which Envoy cluster is experiencing issues. Envoy cluster names correspond
to the TSB Management Plane components, as described in the TSB
architecture document.
TSB Front Envoy p99 Latency
The highest (99th percentile) latency of requests served by TSB Front Envoy. These include both the API requests (via UI or CLI) and XCP configuration propagation-related requests. High latency may be an indicator of one of TSB components overload/resource saturation and may impact both API experience (slow UI/CLI) and config propagation.
Drill down to the "Front Envoy Latency" panel in the "TSB Operational Status"
dashboard to narrow down which Envoy
cluster is experiencing issues. Envoy cluster names correspond to the TSB
Management Plane components, as described in the TSB
architecture document.
Further inspecting the relevant TSB Component logs may provide additional insight.
Also, it is always a good idea to inspect the "Data Store Latency" panel and search for any correlations between the increased TSB latency and Postgres operations latency.
Persistent Backend Availability
Persistent backend availability from TSB with no insight into the internal Postgres operations.
TSB stores all of its state in the persistent backend and as such, its operational status (availability, latency, throughput etc.) is tightly coupled with the status of the persistent backend. TSB records the metrics for persistent backend operations that may be used as a signal to alert on.
It is important to note that any degradation in persistent backend operations will inevitably lead to overall TSB degradation, be it availability, latency or throughput. This means that alerting on persistent backend status may be redundant and the oncall person will receive two pages instead of one whenever there is a problem with Postgres that requires attention. However, such a signal still has significant value in providing important context to decrease the time to triage the issue and address the root cause/escalate.
Data store panels provide a helpful set of metrics that should be consulted first when troubleshooting this alert.
Treatment of "resource not found" errors: small number of "not found" responses
are normal because TSB, for the purposes of optimisation, often uses Get
queries instead of Exists in order to determine the resource existence.
However, a large rate of "not found" (404-like) responses likely indicates an
issue with the persistent backend setup.
Consult the tsb and iam component logs to narrow down the nature of
Postgres errors. To troubleshoot further, verify the health of the Postgres
installation.
MPC Component Health
MPC (Management Plane Controller) is a TSB MP component that is responsible for
configuration and state validation and bi-directional sync between TSB API and
XCP Central component. MPC operational issues indicate that configuration
updates may not be applied or applied too slow.
MPC Operational Status dashboard provides
an extensive list of signals that can be helpful in troubleshooting MPC issues.
To troubleshoot further, consult the mpc component logs.
Note: MPC uses k8s API as an intermittent configuration storage. Any issues
affecting k8s APIServer (namely, its etcd installation) will result in
degraded MPC health. MPC logs can be helpful in confirming the health and
interaction between MPC and k8s.
XCP Operational Status
Alerts describing the health of TSB XCP Management Plane components.
Last Management Plane Sync
The max time elapsed since XCP Edge last synced with the management plane (XCP central)
for each registered cluster. This indicates how stale the configuration received from the
management plane is in a given cluster. A reasonable first iteration threshold
here is 300 (seconds).
Use "XCP Central Operational Status" and "XCP Edge status" dashboards to
narrow down which Control Plane cluster is experiencing syncing issues.
Verify the connectivity between the CP cluster and MP.
To troubleshoot further, xcp-central MP and edge CP component logs can
provide additional insight.