 Tetrate Service BridgeVersion: 1.14.x
New Relic integration
New Relic's popular software analytics platform enables businesses to monitor the health and performance of their applications, servers and databases. It collects and analyzes data from various sources, including application logs, server metrics and user interactions to provide detailed insights and metrics.
Tetrate's rich observability data integrates seamlessly with the New Relic platform. This article shows how to make telemetry data from Istio and Tetrate Service Bridge available in New Relic. For the metrics related to the application load - please follow the New Relic article that describes Istio Data plane metrics retrieval.
The steps below are validated, however some customers might have custom New Relic setup that requires additional customization.
Data-flow
The diagram below shows the metrics workflow processing that Tetrate Service Bridge exports to New Relic.
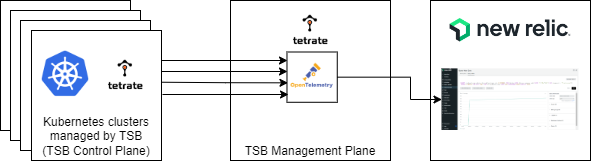
Every Tetrate Service Bridge control plane uses the OpenTelemetry Collector to collect an advanced set of metrics and aggregate them in the global TSB management plane, along with additional metrics data associated with activity in the management plane. Once aggregated, the OpenTelemetry Collector can be used to export data directly to New Relic.
Configuring Tetrate Service Bridge for New Relic
Tetrate's telemetry data collection and aggregation described above is an out-of-the-box TSB configuration and doesn't require any changes. Follow the steps below to integrate Tetrate's data with New Relic.
New Relic integration
Use the following steps to configure the OpenTelemetry Collector in TSB management plane to write data to the New Relic endpoint via the OTLP exporter.
The basic steps are as follows with detailed instructions below:
- Step 1: Create a copy of OpenTelemetry
configMapfrom the TSB management plane and modify it to enable the OTLP exporter. - Step 2: Configure the OpenTelemetry Collector that runs in the Tetrate Service
Bridge management plane to use the
configMapcreated in the previous step.
See the OTLP exporter project page and the New Relic documentation for more information.
The New Relic documentation suggests the deployment of a New Relic integration inside of your Kubernetes cluster. This step is not required to deliver Tetrate Service Bridge metrics to the New Relic platform.
Step 1: Create an OpenTelemetry configmap
Download and save this configMap yaml file as otel-cm-tsb.yaml.
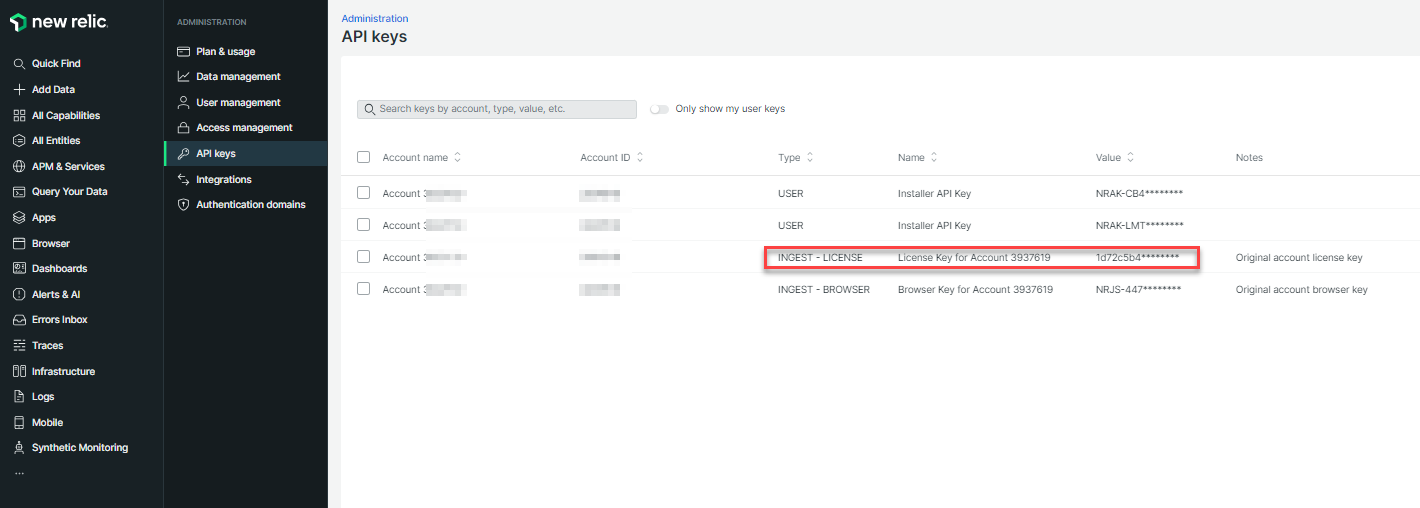
Edit the file to replace the <api key> field with one provided by New Relic. (per the screenshot below - identify INGEST - LICENSE key):
Apply the config to your Kubernetes cluster using the following command:
kubectl apply -f otel-cm-tsb.yaml
Step 2: Configure the Tetrate Service Bridge OpenTelemetry Collector
To point to the configMap created in the previous step, the TSB management plane
custom resource configuration needs to be patched with the following command.
Make sure your current Kubernetes context is set to the cluster running the Tetrate Service Bridge management plane.
Please note that tsb is the default namespace for the management plane. Modify
the command above accordingly if your TSB management plane is deployed in a different namespace.
kubectl patch managementplane managementplane -n tsb \
    --patch '{"spec":{"components":{"collector":{"kubeSpec":{"overlays":[{"apiVersion": "apps/v1","kind": "Deployment","name": "otel-collector","patches":[{"path":"spec.template.spec.volumes[0].configMap.name","value":"otel-collector-modified"}]}]}}}}}' \
    --type merge
Validate the New Relic Integration
Tetrate maintains a library of prebuilt dashboards available to use as a starting point; users may also build their own set of dashboards with custom New Relic queries.
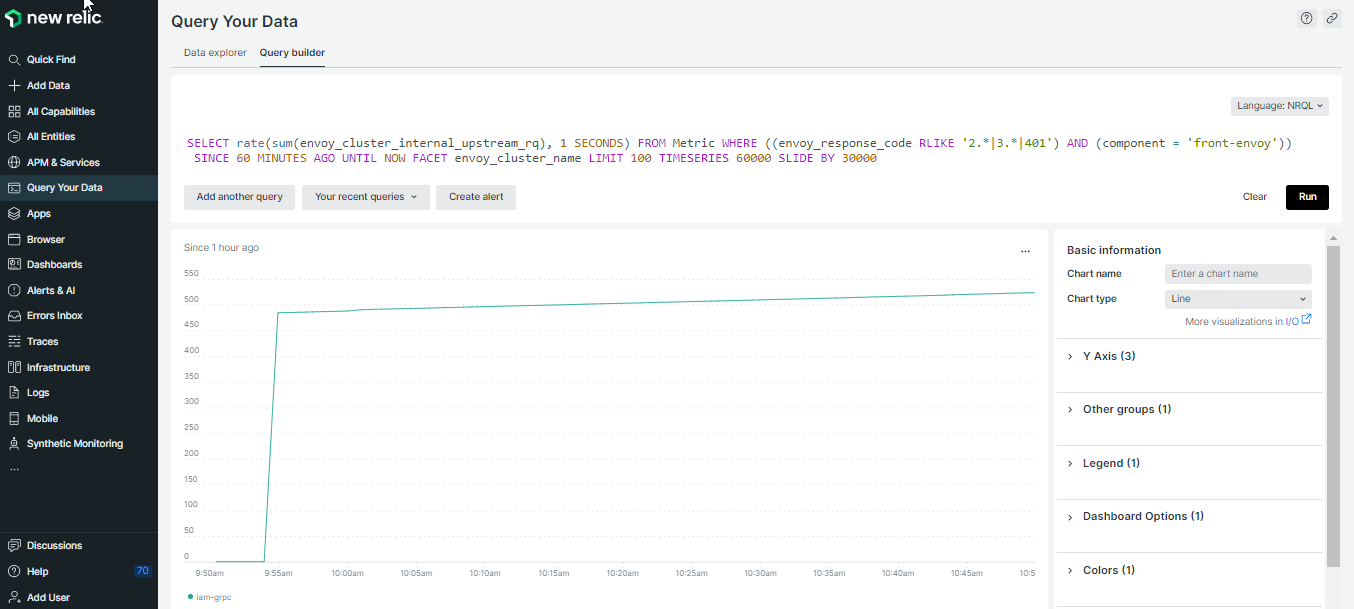
The following query will confirm that the New Relic integration is working:
SELECT rate(sum(envoy_cluster_internal_upstream_rq), 1 SECONDS) FROM Metric WHERE ((envoy_response_code RLIKE '2.*|3.*|401') AND (component = 'front-envoy')) SINCE 60 MINUTES AGO UNTIL NOW FACET envoy_cluster_name LIMIT 100 TIMESERIES 60000 SLIDE BY 30000
Summary
This page describes the steps required to integrate Tetrate Service Bridge metrics with the New Relic platform. Please contact Tetrate support if you need further information or assistance.