 Tetrate Service ExpressVersion: Latest
Observe Metrics, Logs and Traces
Inspect traffic and traces in near-real-time
Tetrate Service Express (TSE) automatically collects and indexes metrics and traces from running applications. TSE's insights go far beyond traffic levels; with TSE metrics, you can identify the causes of application slowdowns, discriminating between application, sidecar and network latency, to troubleshoot the most challenging service level issues.
Prerequisites
- You have installed TSE and onboarded a cluster
- You have installed the Bookinfo App and verified it is working
- You have published the Bookinfo App so that you can send traffic from outside the mesh
Generate Test Traffic
To generate service topology and metrics, we'll send traffic steadily to the Bookinfo application. You can use a variant of the following script:
export GATEWAY_IP=$(kubectl -n bookinfo get service bookinfo-ingress-gw -o jsonpath="{.status.loadBalancer.ingress[0]['hostname','ip']}")

while true ; do
  echo -n ...

  result=$(curl -m 5 -k -s -o /dev/null -I -w "%{http_code}" \
    -H 'X-B3-Sampled: 1' \
    --connect-to bookinfo.tse.tetratelabs.io:80:$GATEWAY_IP \
    "http://bookinfo.tse.tetratelabs.io/productpage")
  echo date: $(date),  status code: "$result"
  sleep 1
done
This will send a request to bookinfo's product page every 1 second. After a while, you can inspect the topology and metrics for this application in the TSE UI.
The X-B3-Sampled header is used to control request sampling in Envoy. If it is not included, TSE will configure the Envoy proxy to sample a small proportion (10% or less) of requests to generate traces. When the header is included and set to the value 1, the Envoy proxy will sample all requests.
You'll quickly gather traces in the Skywalking observability platform that is embedded in TSE, and you can inspect these as described below. You should omit this header for long-term tests, reverting to TSE's default sampling rate.
View Metrics
- On the left panel, select Dashboard
- Click Select Clusters-Namespaces
- Select the cluster and namespace containing the Bookinfo application you are testing
 TSE Dashboard UI: namespace selection screen TSE Dashboard UI: namespace selection screen |
|---|
You can set the duration of data you wish to view, and enable automatic refresh. Settings are found in the top menubar in the TSE UI:
- Select a time range, for example, Last 5 minutes, for the data you wish to view
- Click the Refresh Metrics icon to manually reload metrics, or select a refresh Interval to automatically refresh the page
Topology
Begin with the Topology page, and explore the topology graph of your collection of services and look at the metrics relating to traffic volumes, latency and error rates:
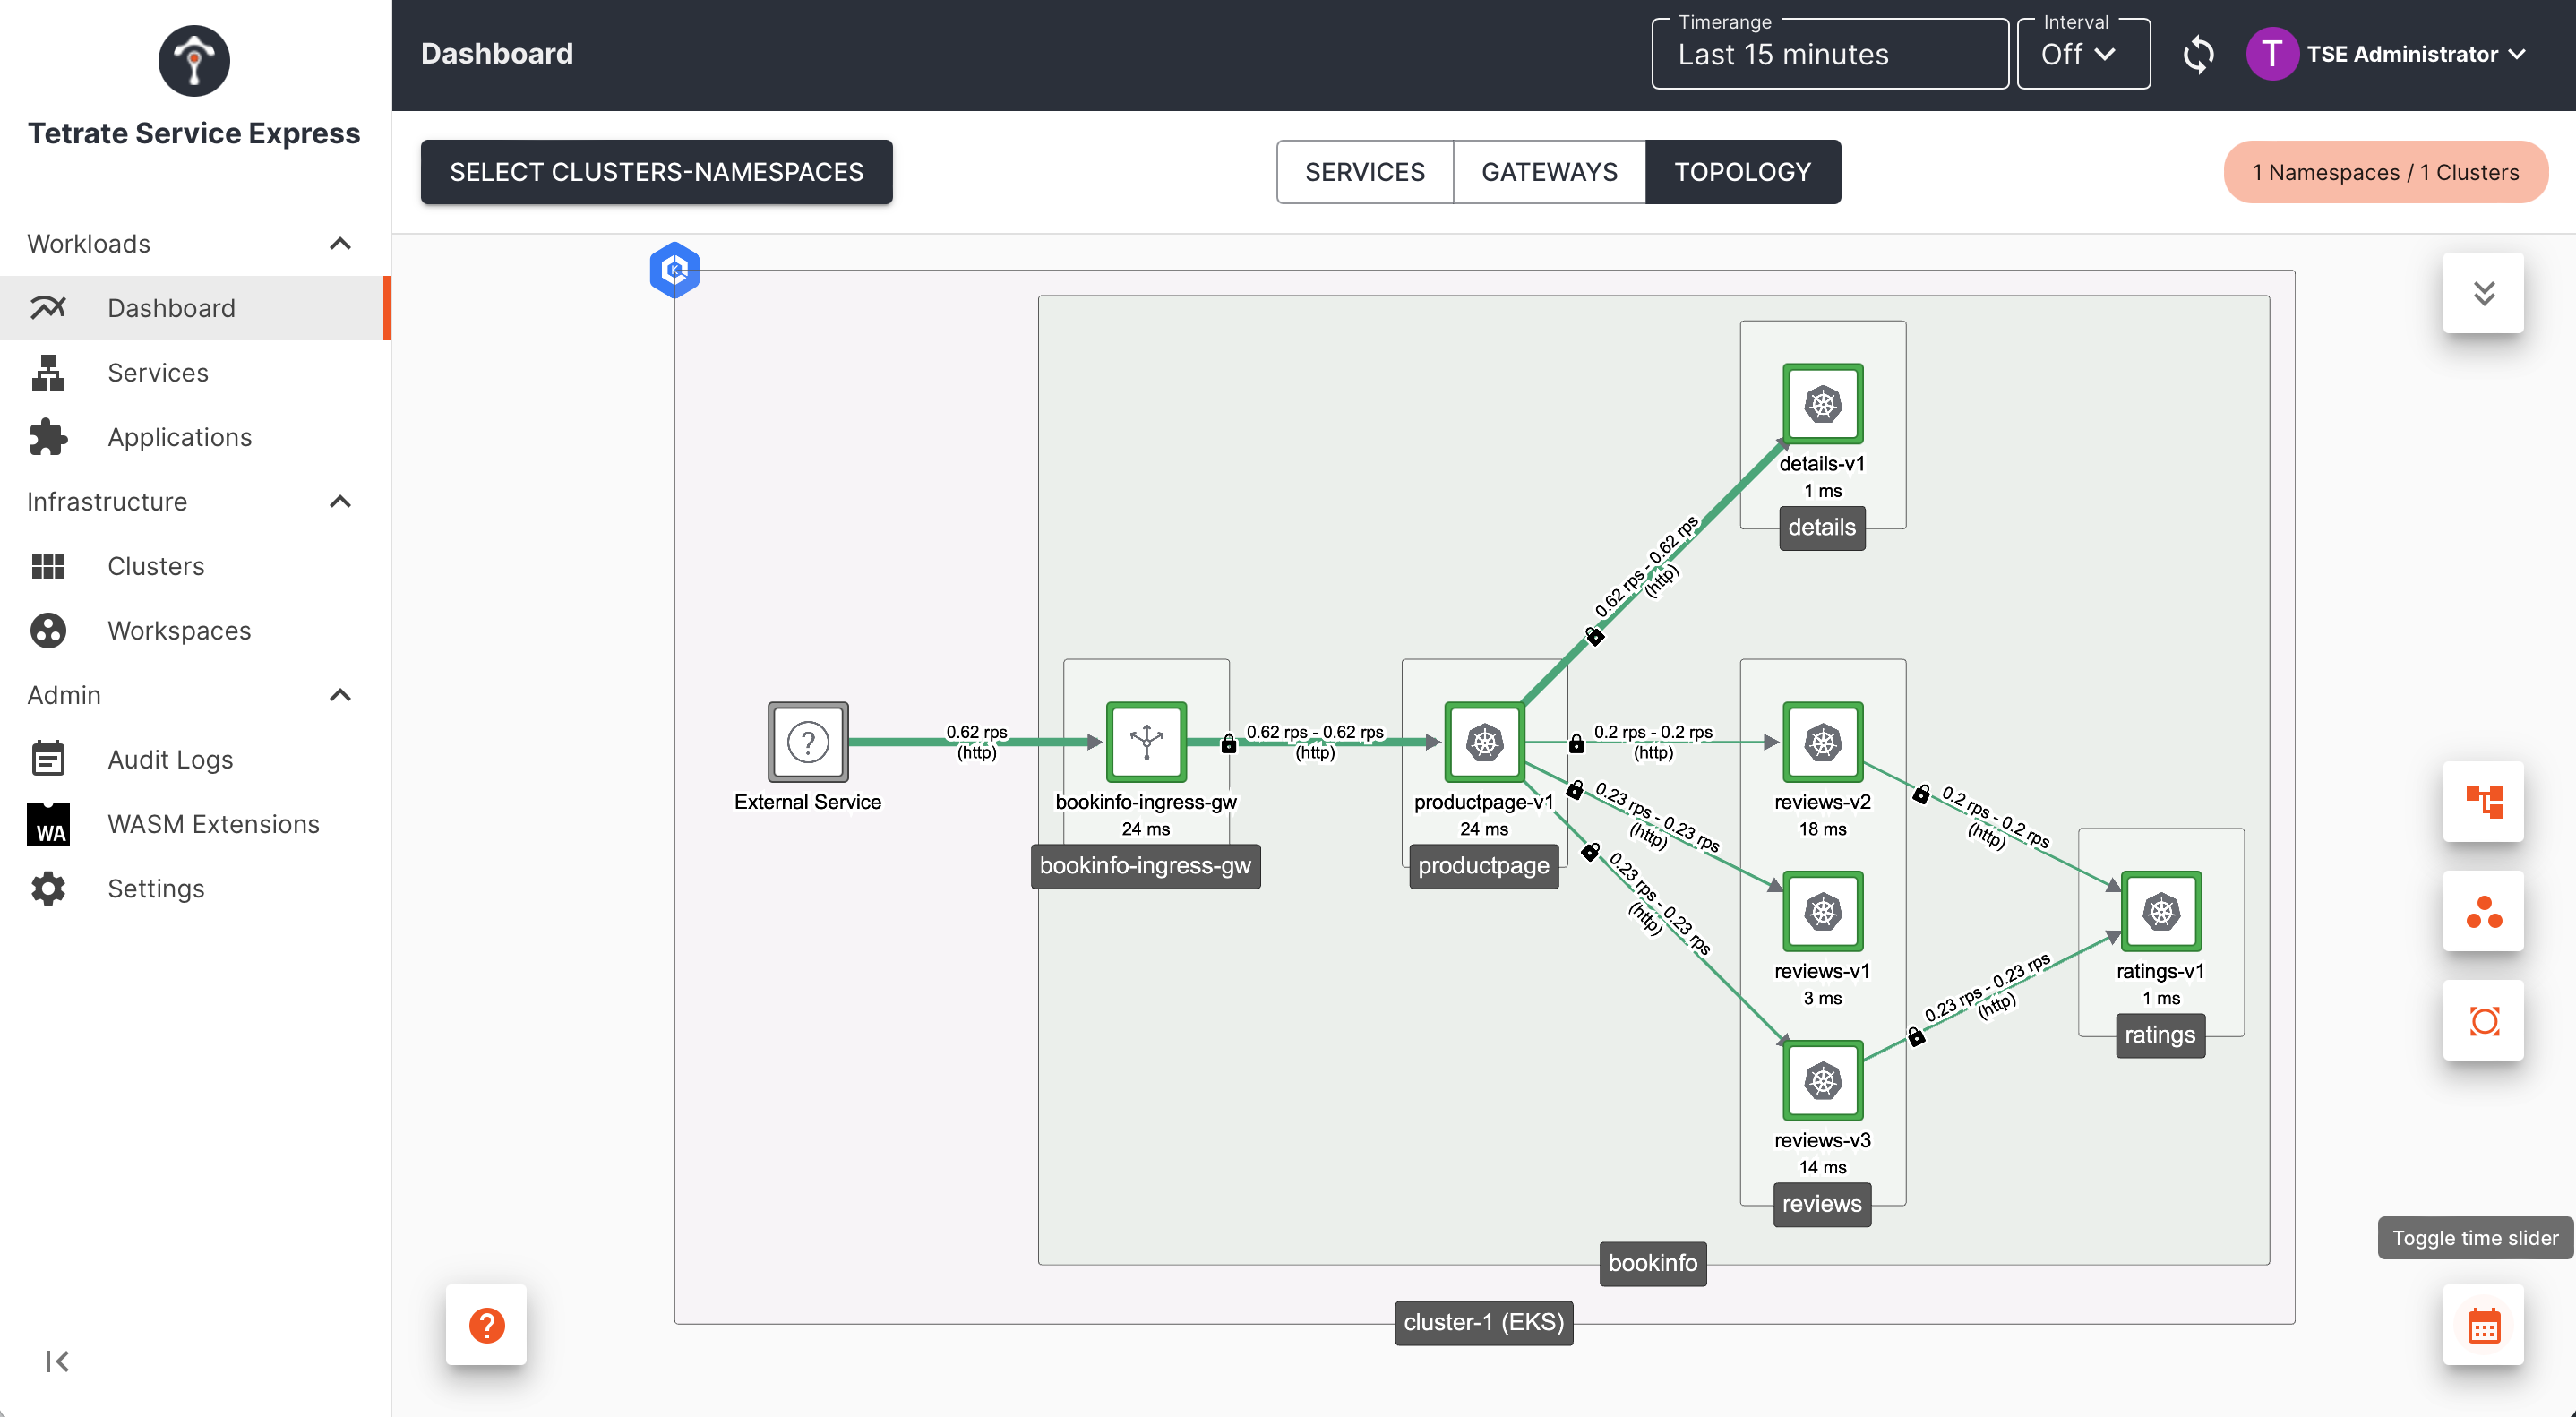 TSE Dashboard UI: topology view TSE Dashboard UI: topology view |
|---|
Metrics and Traces
You can hover over an individual service instance to get more detailed metrics, or click for a fuller breakdown:
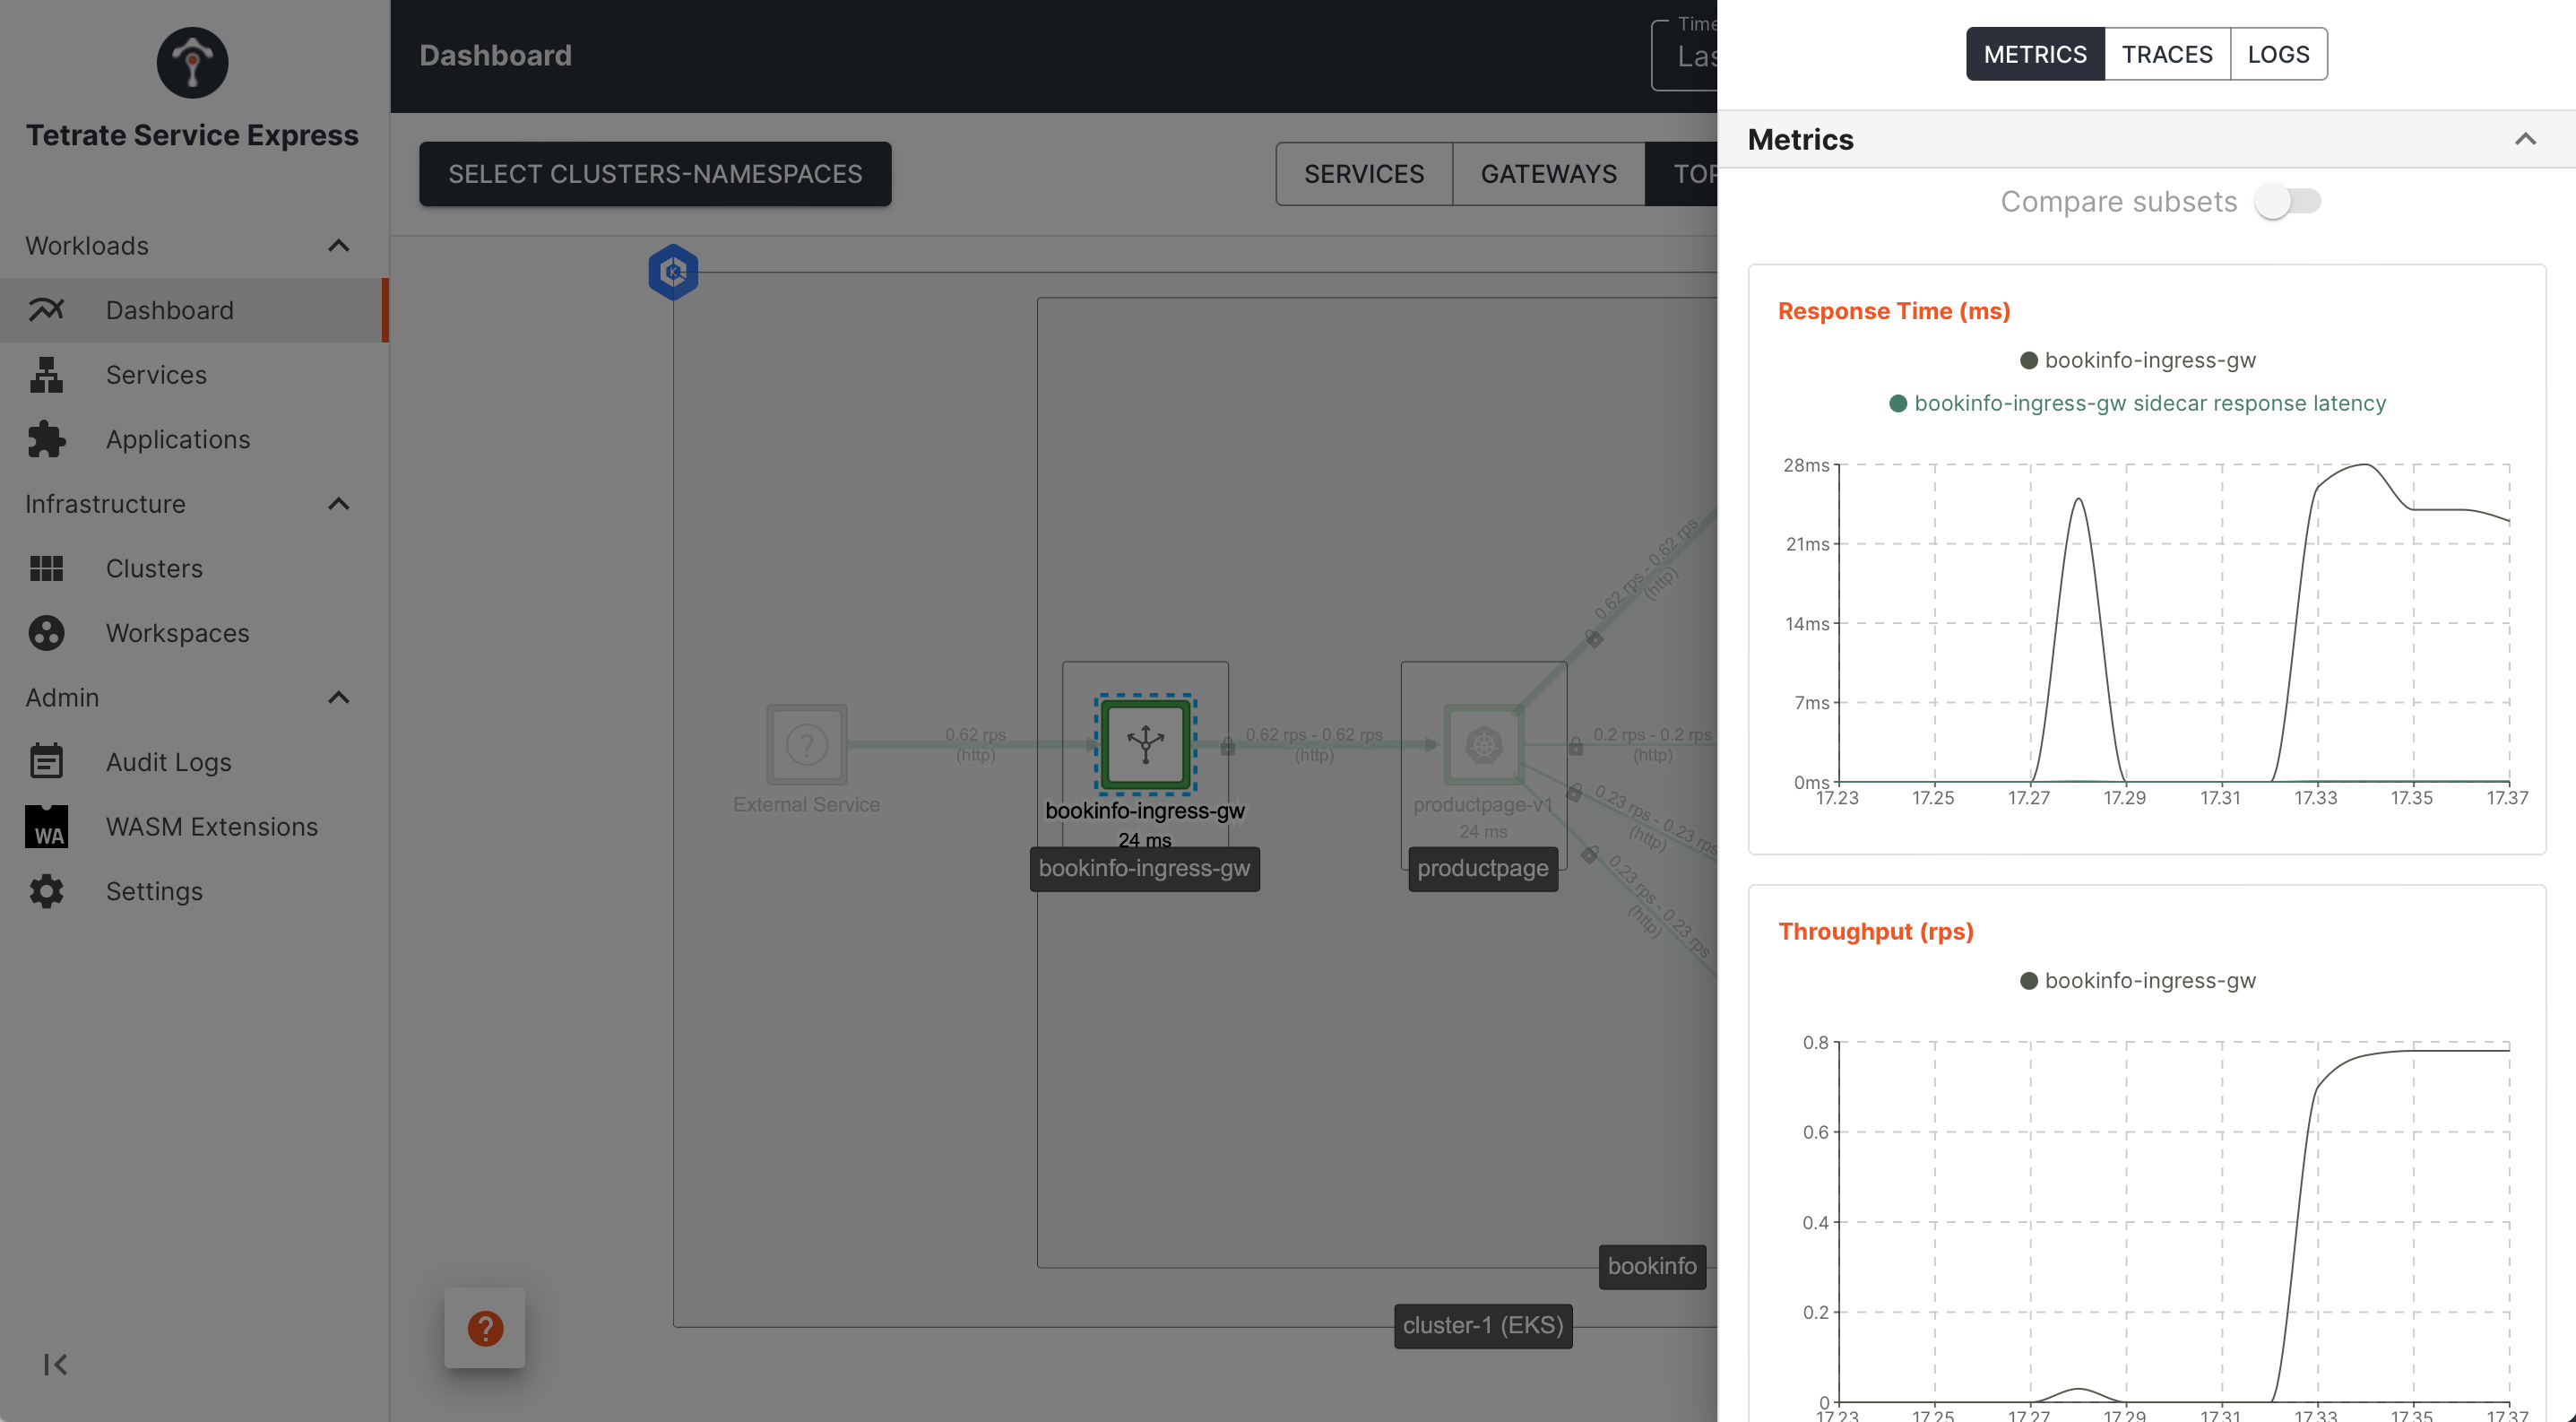 TSE Dashboard UI: service instance metrics TSE Dashboard UI: service instance metrics |
|---|
TSE automatically samples requests and gathers trace data for a subset of requests (note the comment about X-B3-Sampled above!). Select one of the services, and click Trace to list the recent traces captured through that service. You can then explore the full trace, and identify traffic flows, timings and error events:
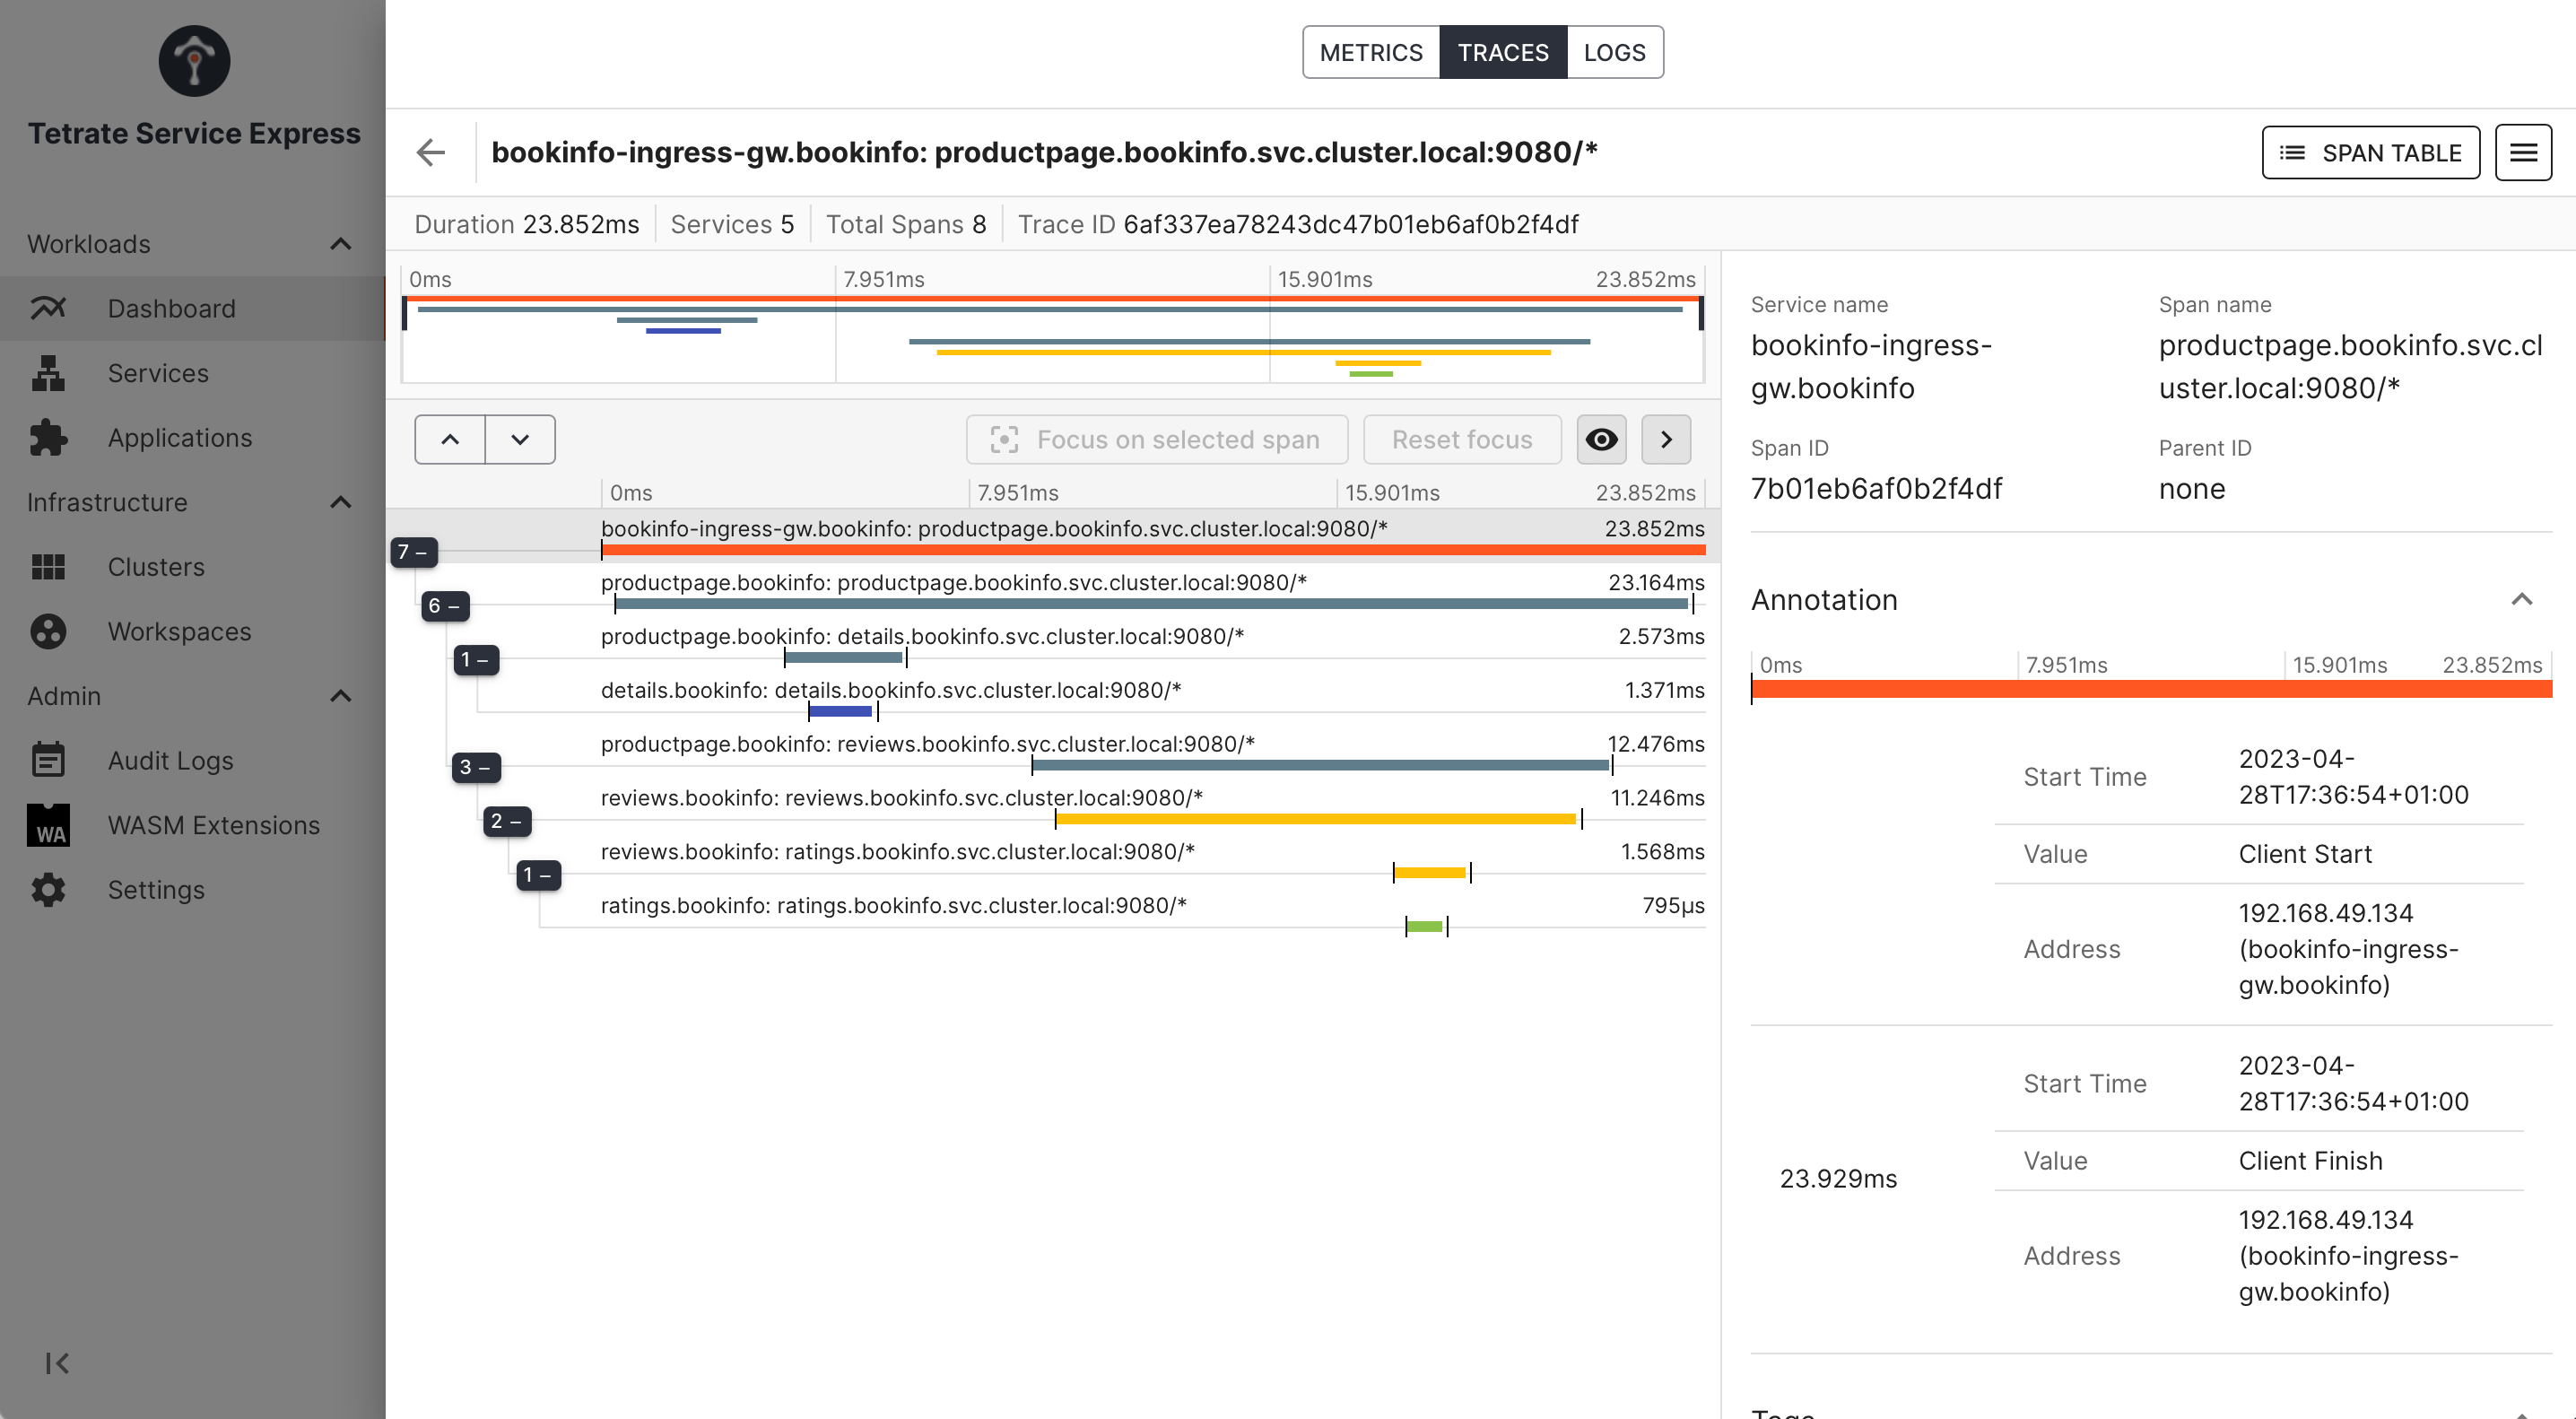 _TSE Dashboard UI: inspecting a trace _ _TSE Dashboard UI: inspecting a trace _ |
|---|
We can interpret this trace, understanding that:
- bookinfo-ingress-gw.bookinfo calls productpage.bookinfo.svc.cluster.local:9080, invoking service productpage in namespace bookinfo
- productpage.bookinfo first calls details.bookinfo.svc.cluster.local:9080, invoking details in namespace bookinfo
- productpage.bookinfo later calls reviews.bookinfo.svc.cluster.local:9080, invoking reviews in namespace bookinfo
- reviews.bookinfo calls ratings.bookinfo.svc.cluster.local:9080, invoking ratings in namespace bookinfo
We can see the deltas in time between the caller making the calls, and the callee reading and responding. The deltas correspond to the (typically small) latency of the network call and the mesh sidecar proxies.
For more complex call graphs, you can start from an internal service, thereby filtering out the front-end gateway and other front-end services.
Service Dashboard
Finally, navigate to the Services pane in the TSE UI and select one of the services managed by TSE. This reveals a rich, multi-pane dashboard from where you can drill down into a range of metrics relating to that service:
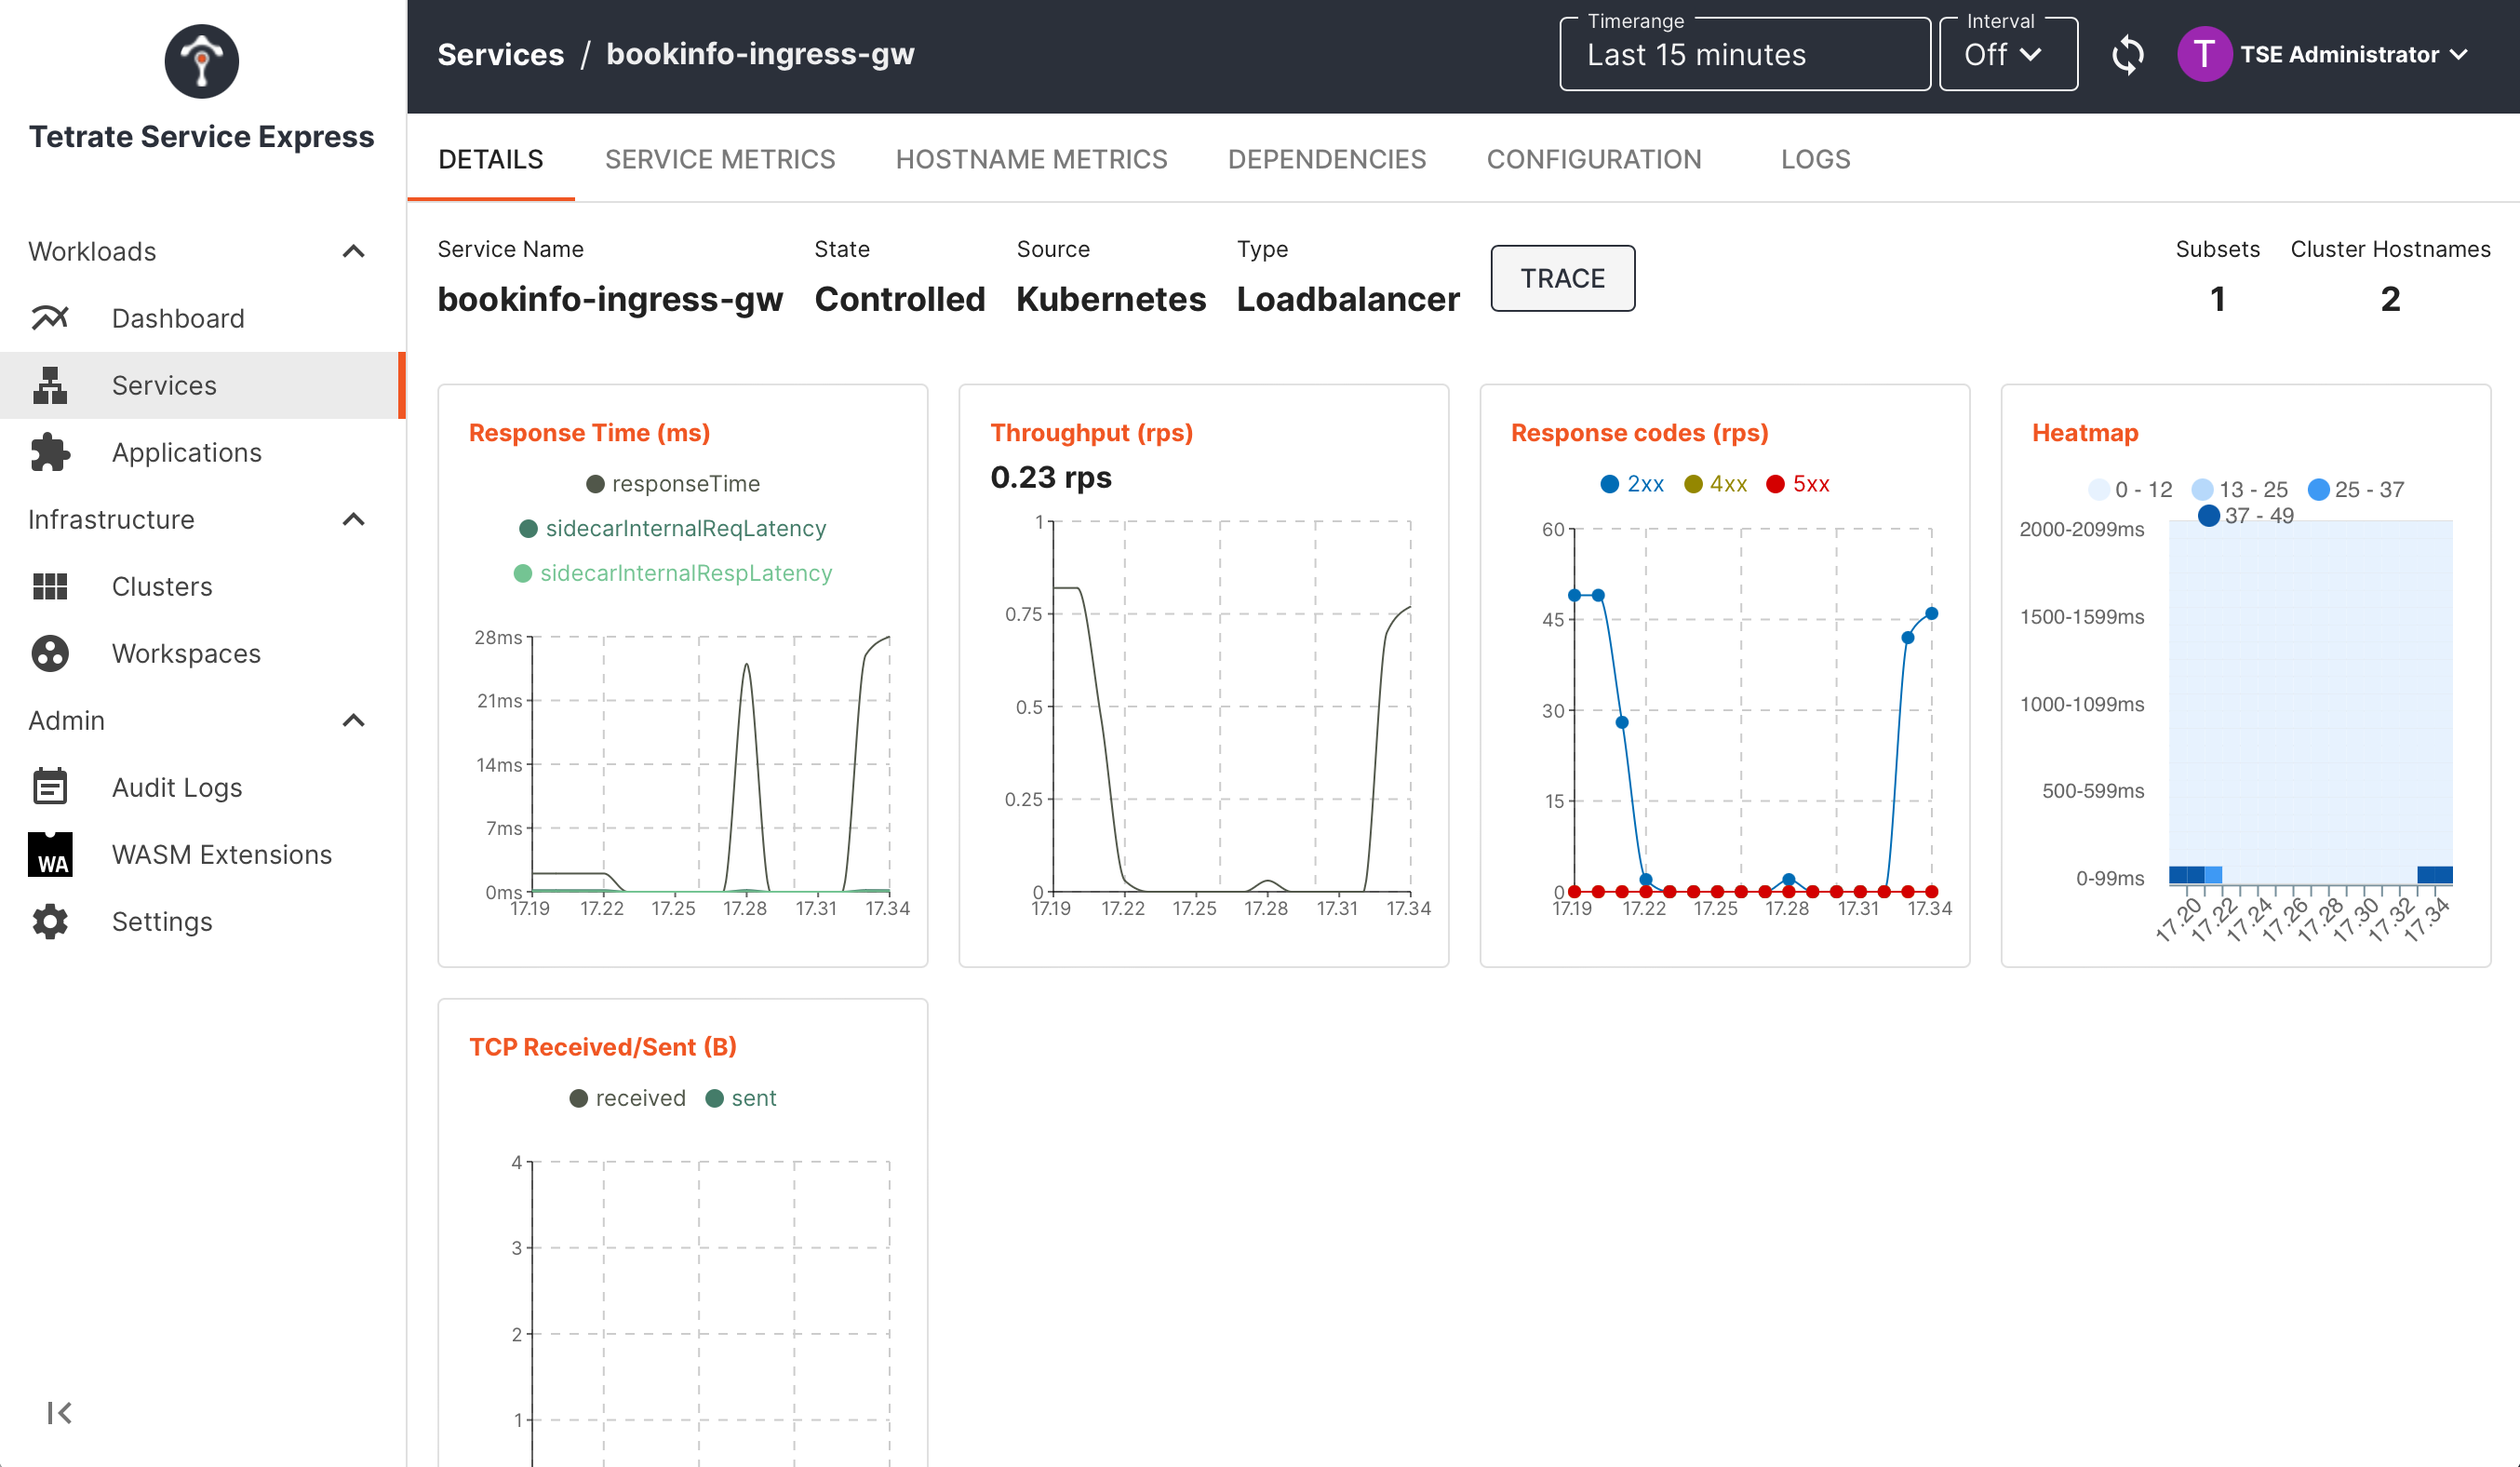 TSE Service UI: inspecting metrics for a service TSE Service UI: inspecting metrics for a service |
|---|