 Tetrate Service ExpressVersion: Latest
Amazon Managed Grafana and TSE Integration
View TSE-collected metrics in Amazon Managed Grafana
Amazon Managed Grafana allows you to integrate and configure TSE as a Prometheus data source. The TSE provides PromQL support, facilitating the querying of service metrics and creation of service dashboards in Grafana.
Constructing Basic Queries
The PromQL endpoint in TSE can be accessed at $TSE_ADDRESS/promql.
Ensure that TSE has received some traffic before you start requesting metrics. You can achieve this by deploying services and routing requests to your service.
Querying Metadata
Metadata refers to the metrics accompanying information, such as the service name, instance name, endpoint name, and labels. The following TSE metrics contain metadata:
- service_traffic
- instance_traffic
- endpoint_traffic
For instance, you can query all services within TSE clusters using the following request. Please replace TSE_USERNAME, TSE_PASSWORD, and TSE_ADDRESS with the actual values from your TSE deployment:
current_timestamp=$(date +%s)
start_timestamp=$((current_timestamp - 1800))

curl -k -u "${TSE_USERNAME}:${TSE_PASSWORD}" ${TSE_ADDRESS}/promql/api/v1/series -d "match[]=service_traffic{layer='MESH'}&start=${start_timestamp}&end=${current_timestamp}"
The response might look like this:
{
  "status": "success",
  "data": [
    {
      "__name__": "service_traffic",
      "service": "v1|productpage|bookinfo|app1|-",
      "scope": "Service",
      "layer": "MESH"
    },
    {
      "__name__": "service_traffic",
      "service": "v3|reviews|bookinfo|app1|-",
      "scope": "Service",
      "layer": "MESH"
    },
    ...
  ]
}
When querying TSE via PromQL, keep these points in mind:
- All metrics in TSE clusters belong to the MESH layer.
- The service name in TSE follows the format:
subset|service name|namespace|cluster|-.
Querying Metrics
Here's an example of querying the Service Average Response Time metric for the service v1|productpage|bookinfo|app1|- over the past 5 minutes:
curl -k -u "${TSE_USERNAME}:${TSE_PASSWORD}" ${TSE_ADDRESS}/promql/api/v1/query -d 'query=service_resp_time{service="v1|productpage|bookinfo|app1|-", layer="MESH"}[5m]'
The response might look like this:
{
  "status": "success",
  "data": {
    "resultType": "matrix",
    "result": [
      {
        "metric": {
          "__name__": "service_resp_time",
          "layer": "MESH",
          "scope": "Service",
          "service": "v1|productpage|bookinfo|app1|-"
        },
        "values": [
          [
            1683708420,
            "14"
          ],
          [
            1683708480,
            "13"
          ],
          [
            1683708540,
            "14"
          ],
          [
            1683708600,
            "15"
          ],
          [
            1683708660,
            "13"
          ],
          [
            1683708720,
            "0"
          ]
        ]
      }
    ]
  }
}
For additional details, consult the SkyWalking PromQL Service documentation.
Add TSE Service Dashboard
To view PromQL support in action, you can add a TSE sample service dashboard into your Amazon Managed Grafana.
If necessary, first create a Grafana workspace.
Configure your data source for your chosen workspace:
- In the data source configuration panel, select the Prometheus type.
- Set the URL to the TSE PromQL address.
- Enable
Basic authand fill in the User and Password fields. - You might need to Enable
Skip TLS Verifyif you are using self signed certificate for TSE. - Click on the Save & Test button to validate the connection.
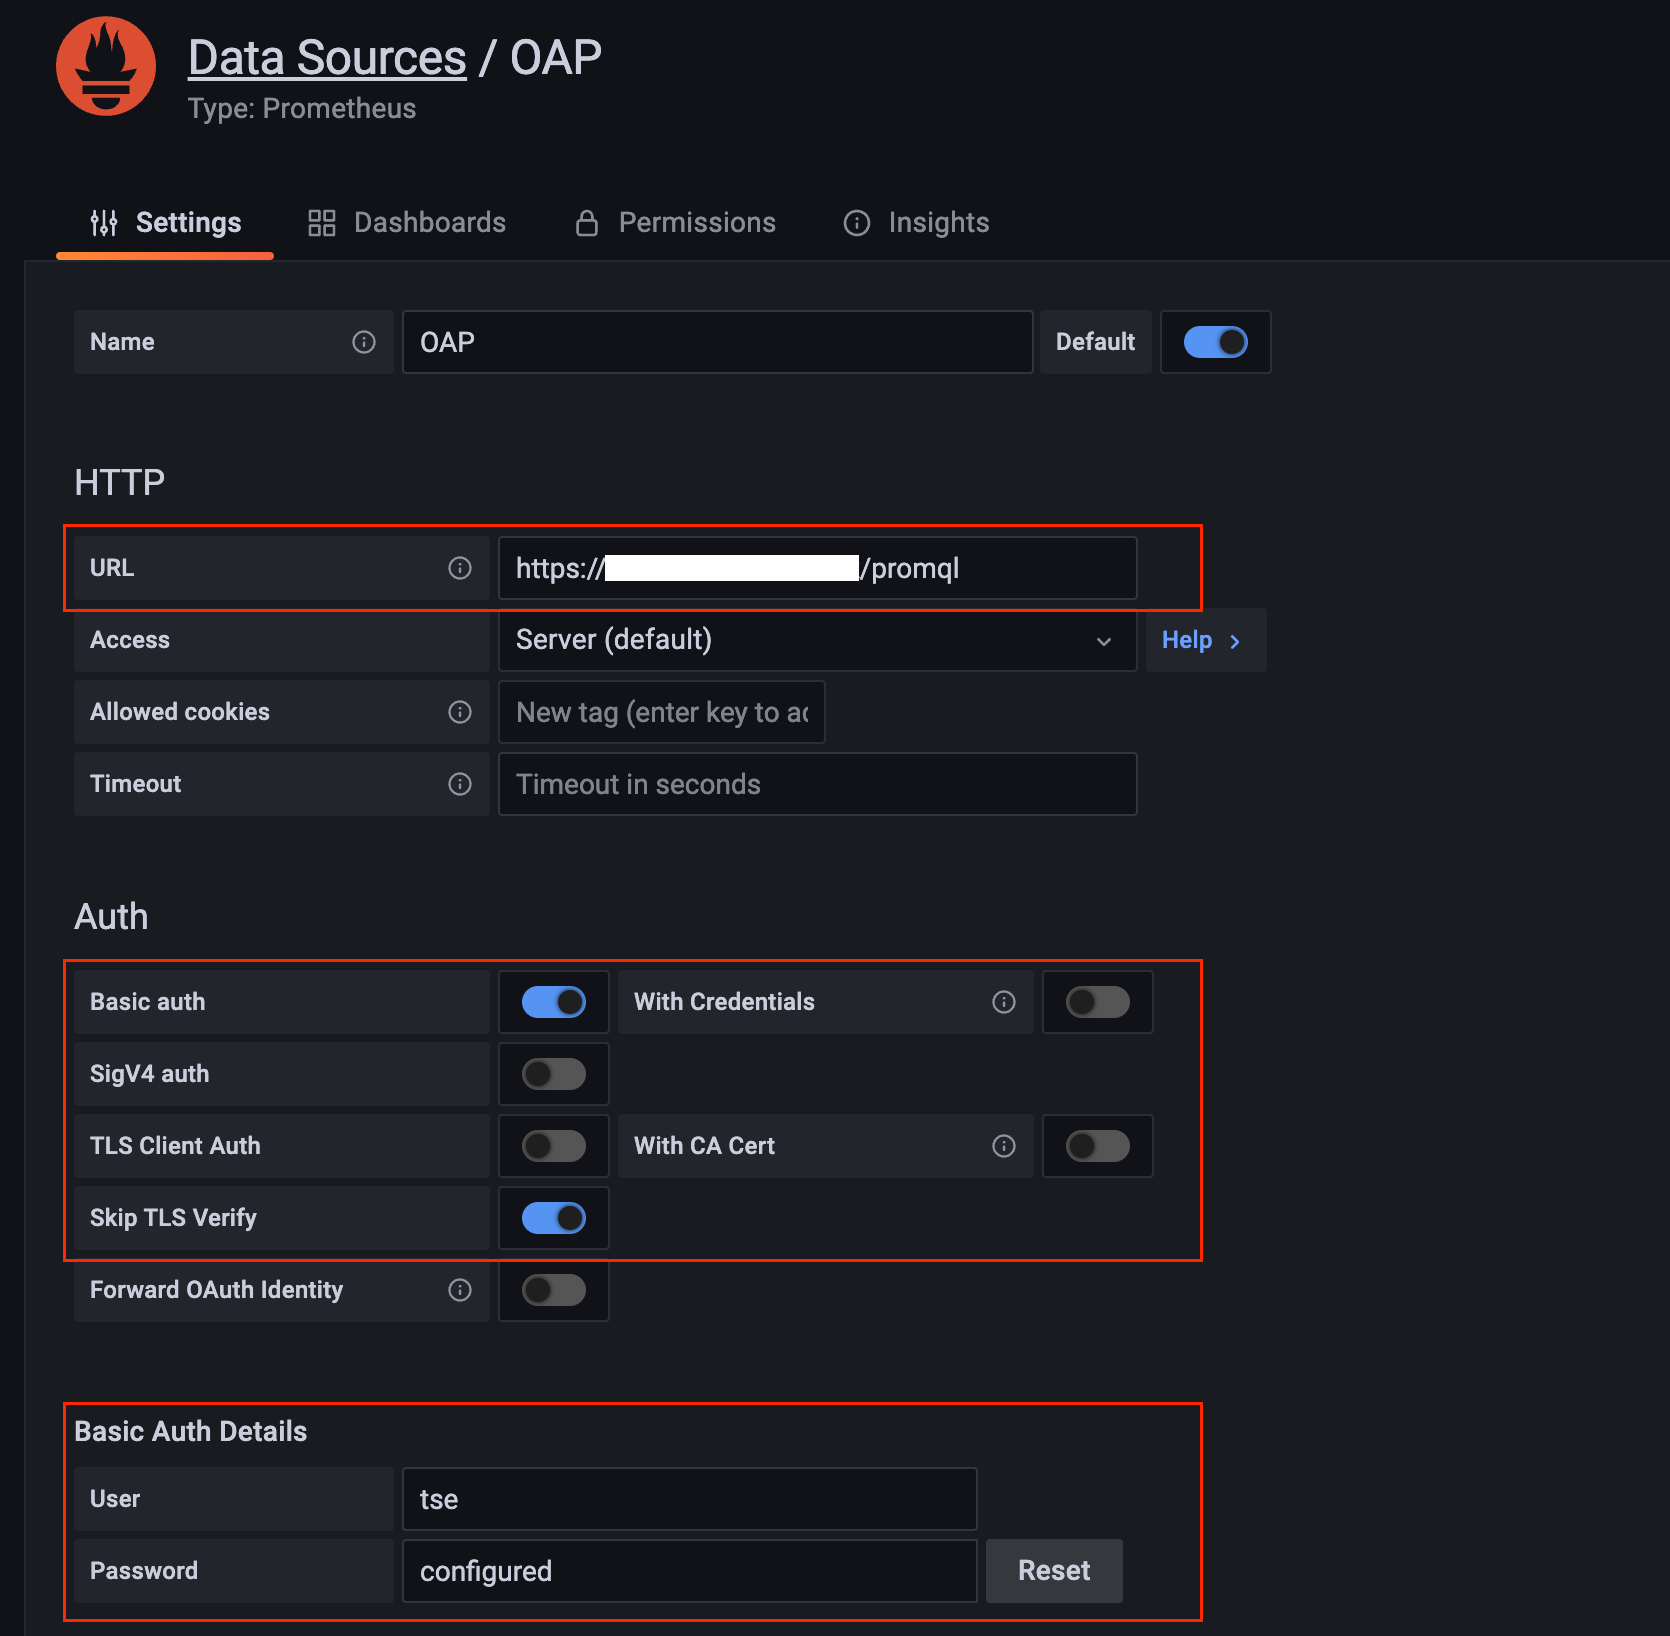 Grafana data source Grafana data source |
|---|
Then proceed to import the TSE service dashboard into your Amazon Managed Grafana.
Here's a preview of the dashboard:
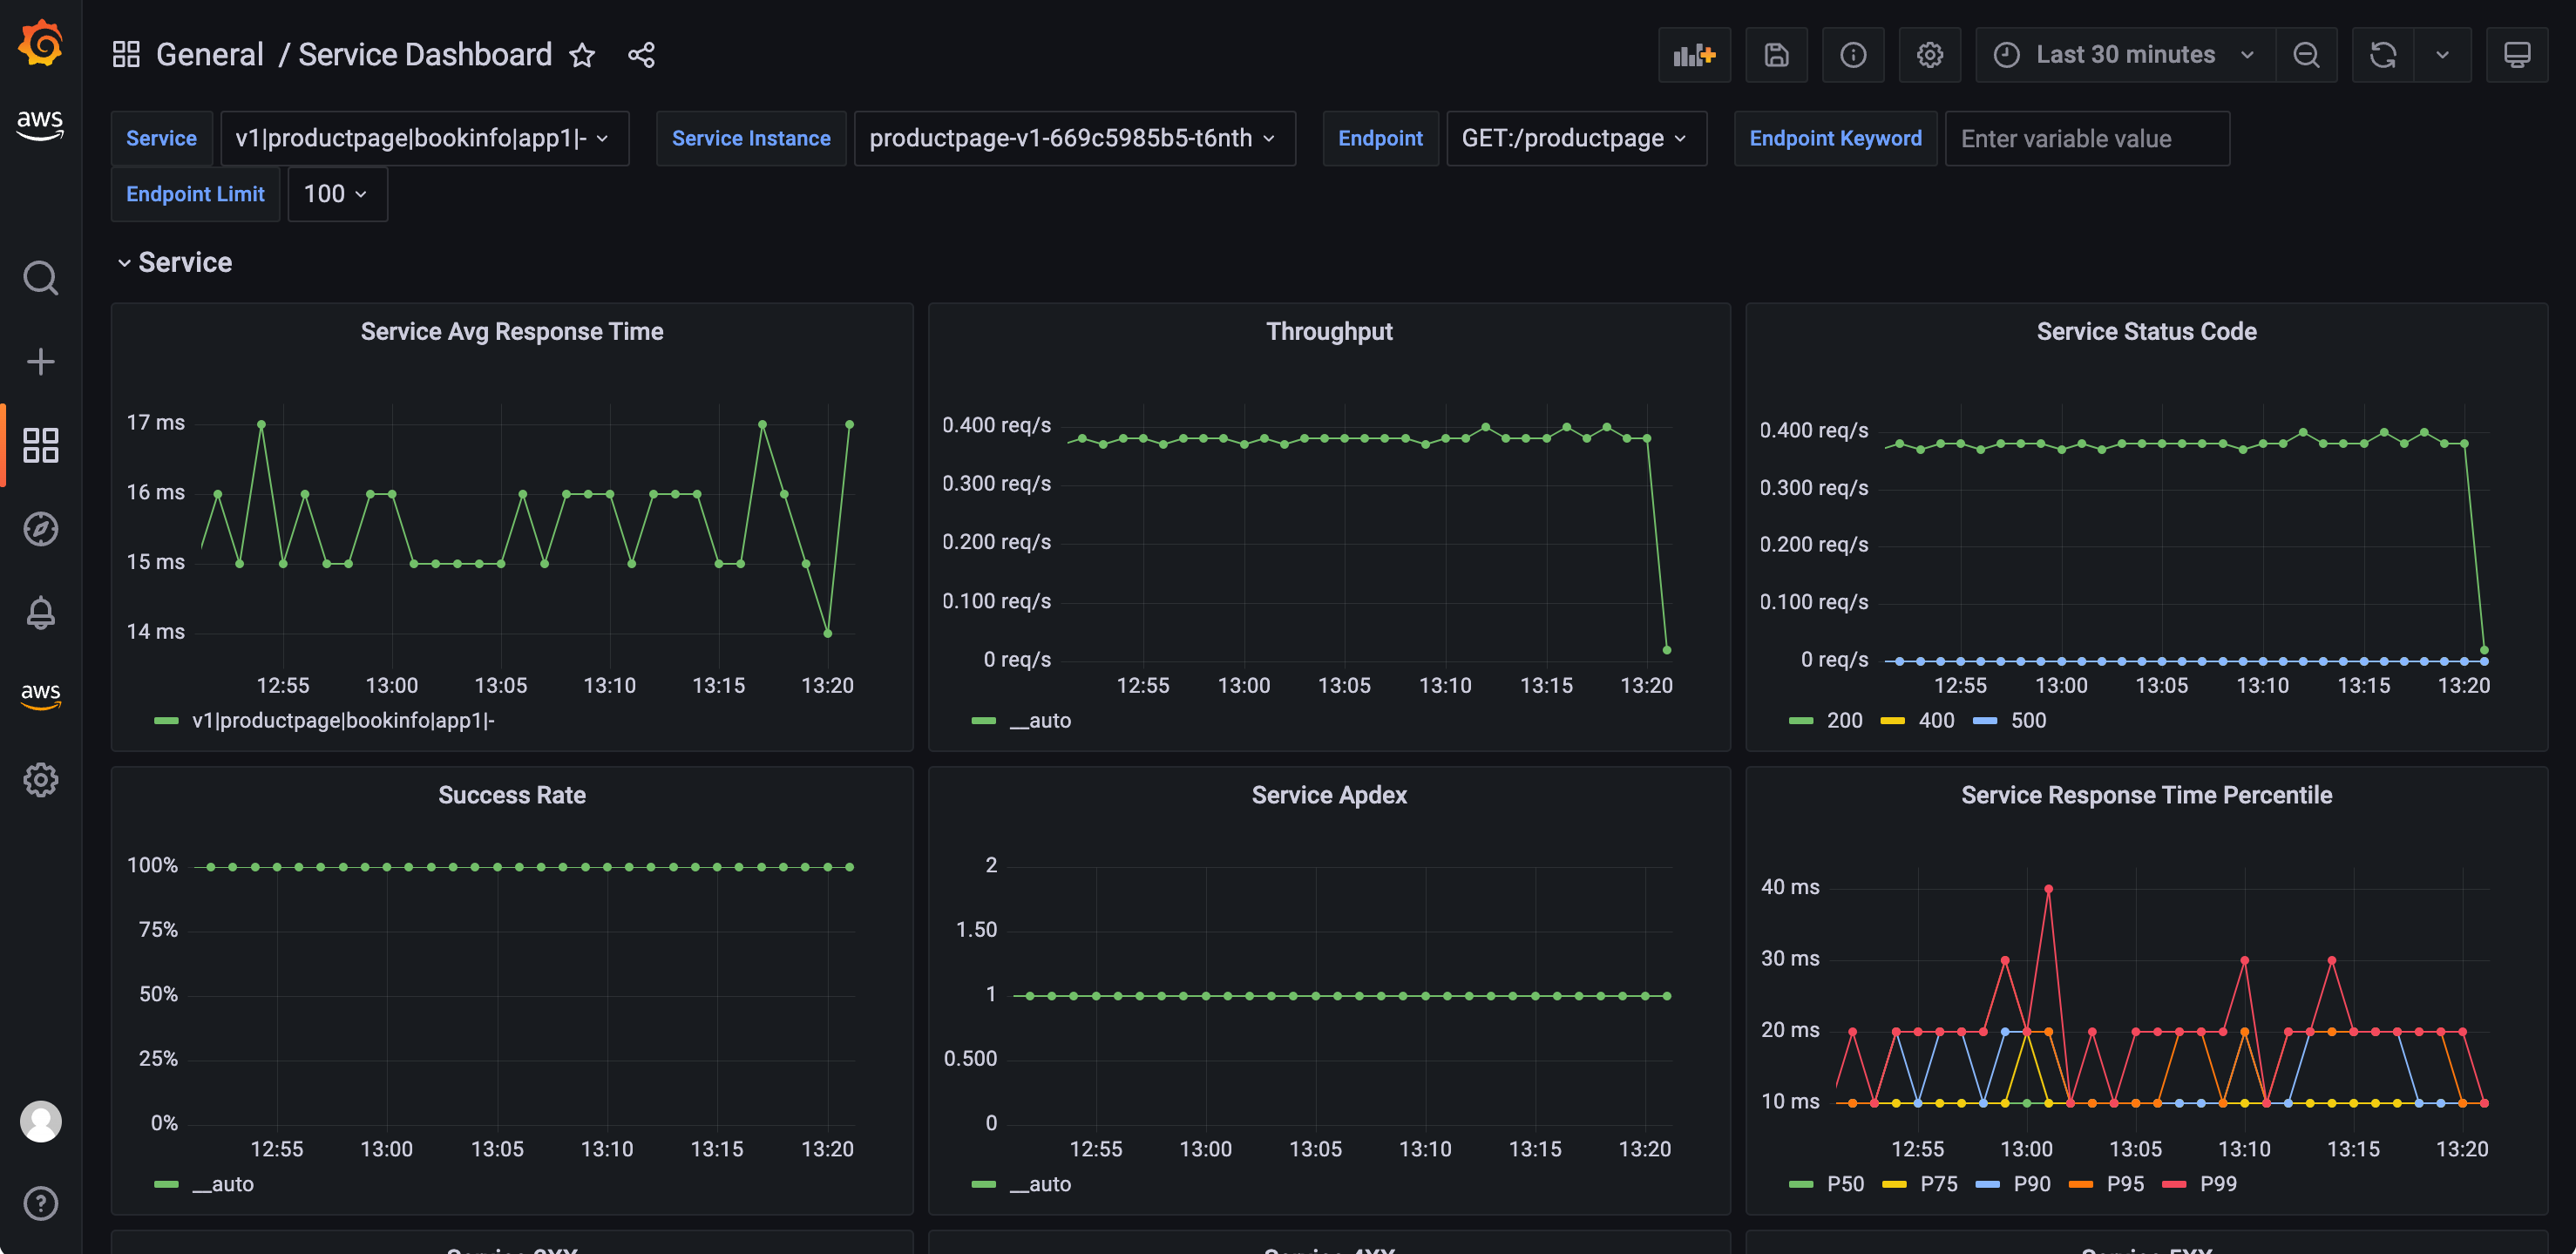 Grafana service dashboard Grafana service dashboard |
|---|