TSB UI
Metrics
The TSB UI displays metrics and health status for your Applications. If you don't see the metrics, use this guide to troubleshoot.
- Ensure you have traffic flowing in your application. Metrics are generated when some traffic occurs.
- Ensure the time window is appropriate and traffic happened during that window.

- Check if UI query run in your browser return a status. You can use your
browser
inspectcommand and check the request/response.
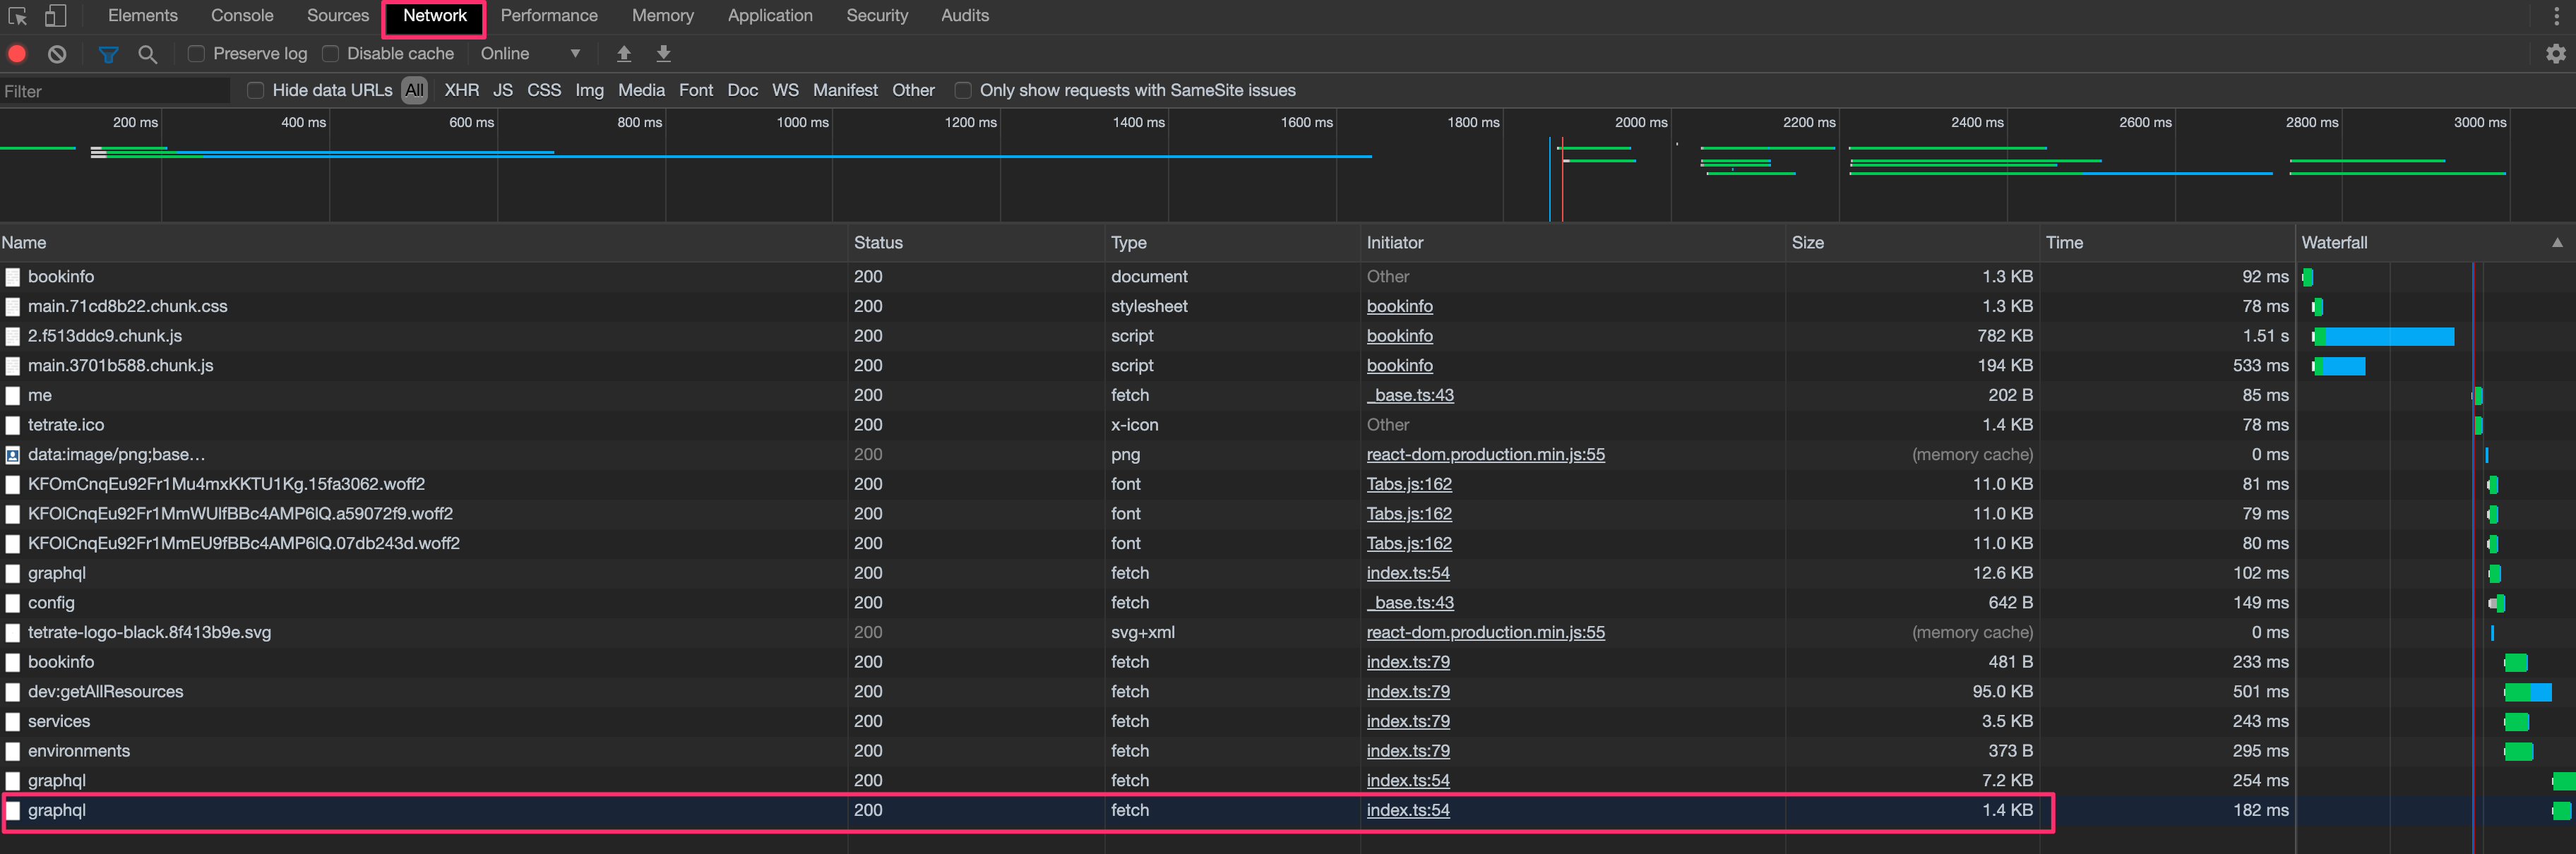
From the inspector, select theNetworktab and open you application from the TSB UI. You should see a list of all the requests between your browser and the TSB UI.
Search for the lastgraphqlrequest:
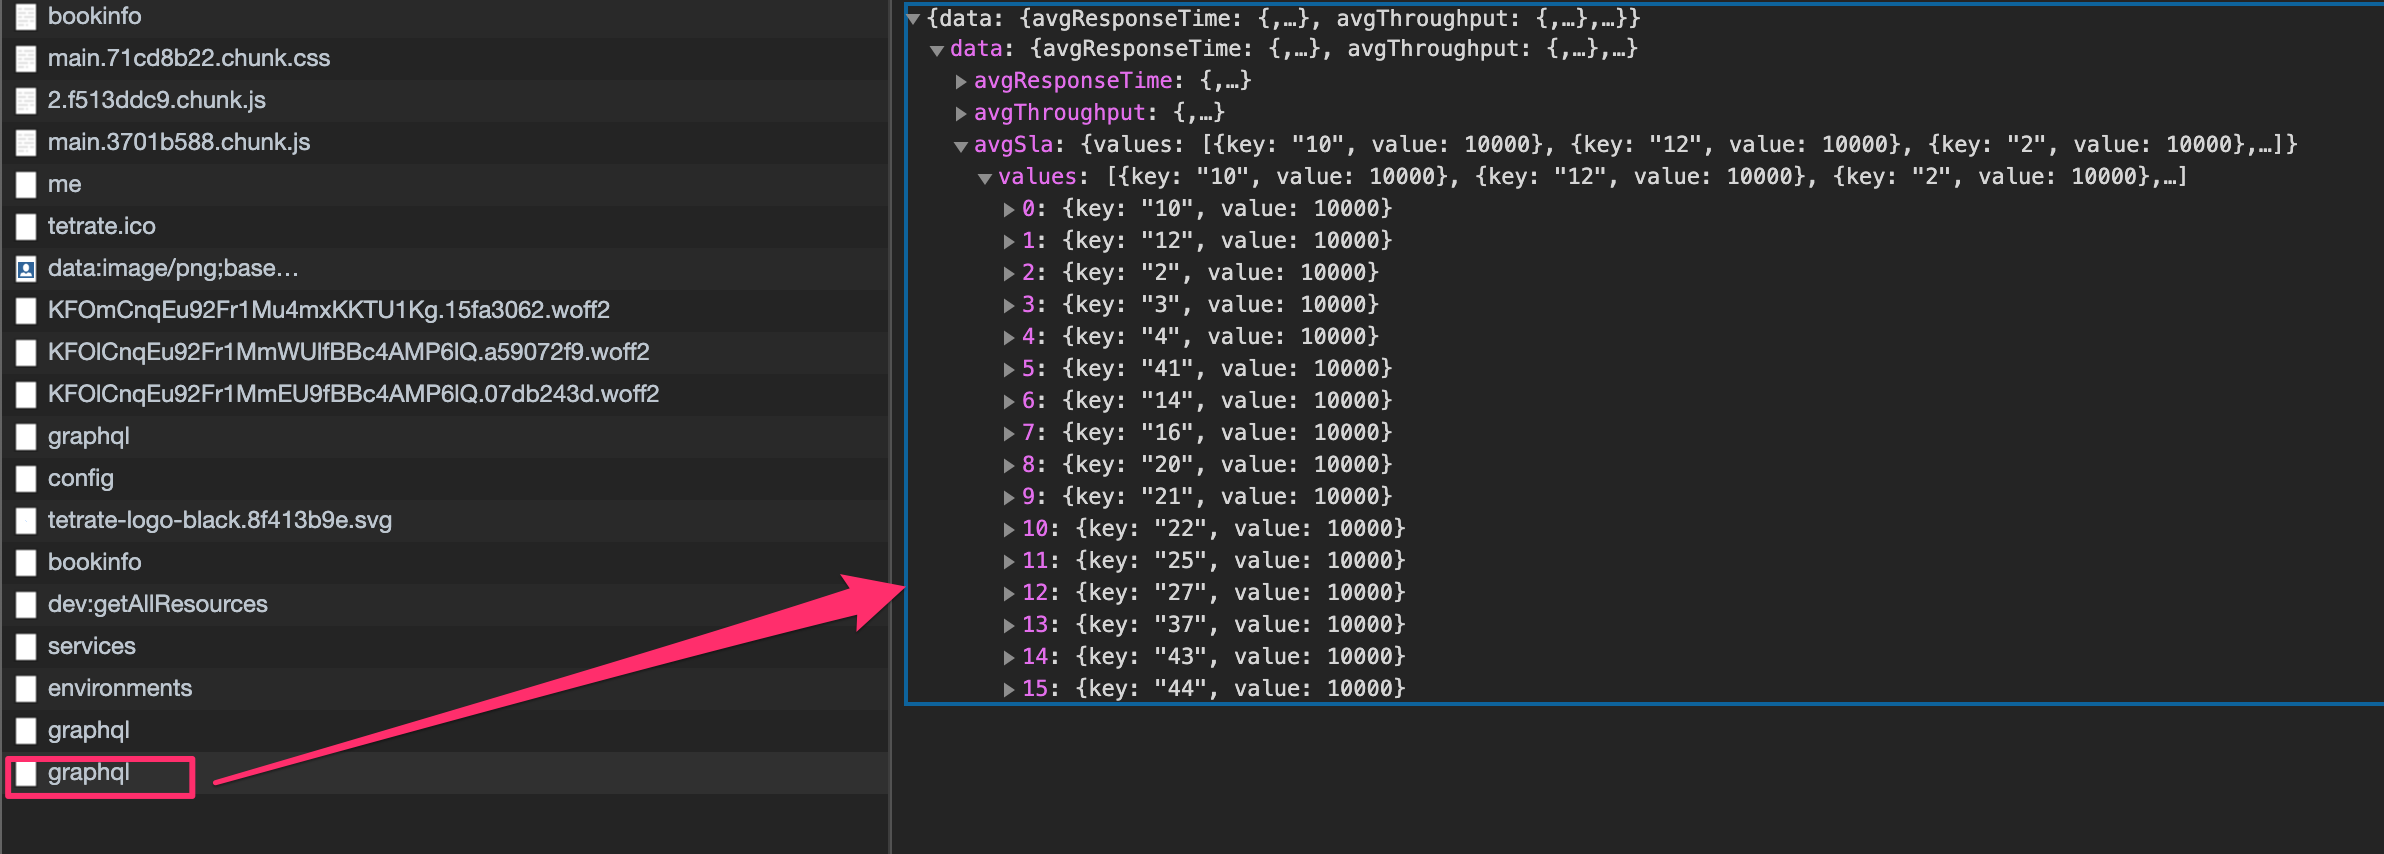
If you don't have the query, it may indicate that your application is not handling any traffic or you're having a problem with the OAP deployment. Follow through to ensure OAP is not in error state.
- Ensure
OAPPod in thetccNamespace is up and running. For example, check there are no errors in the pod's log:
kubectl -n tcc logs -l app=oap
Errors from the logs will tell you where the problem is. It may be an Elasticsearch related issue.
- Check if OAP in the Control Plane Namespace (istio-system) is receiving ALS data from various envoys. To do that, forward the monitoring port of the OAP pods to your local computer and query some metrics:
# start the port-forward in a shell
k -n istio-system port-forward deployment/oap-deployment 1234
Forwarding from 127.0.0.1:1234 -> 1234
Forwarding from [::1]:1234 -> 1234

# curl the metrics in another shell
curl -s http://localhost:1234/ | grep "envoy_als_in_count"
...
envoy_als_in_count{id="router~10.28.0.25~tsb-gateway-7b7fbcdfb7-726bf.bookinfo~bookinfo.svc.cluster.local",cluster="tsb-gateway",} 67492.0
envoy_als_in_count{id="sidecar~10.28.0.19~details-v1-94d5d794-kt76x.bookinfo~bookinfo.svc.cluster.local",cluster="details.bookinfo",} 33747.0
envoy_als_in_count{id="sidecar~10.28.0.23~reviews-v3-5556b6949-pvqfn.bookinfo~bookinfo.svc.cluster.local",cluster="reviews.bookinfo",} 22500.0
envoy_als_in_count{id="sidecar~10.28.0.24~productpage-v1-665ddb5664-ts6pz.bookinfo~bookinfo.svc.cluster.local",cluster="productpage.bookinfo",} 101240.0
envoy_als_in_count{id="sidecar~10.28.0.22~reviews-v2-6cb744f8ff-mf8s6.bookinfo~bookinfo.svc.cluster.local",cluster="reviews.bookinfo",} 22498.0
envoy_als_in_count{id="sidecar~10.28.0.20~ratings-v1-744894fbdb-ctvpd.bookinfo~bookinfo.svc.cluster.local",cluster="ratings.bookinfo",} 22499.0
envoy_als_in_count{id="sidecar~10.28.0.21~reviews-v1-f7c7c7b45-8v2sf.bookinfo~bookinfo.svc.cluster.local",cluster="reviews.bookinfo",} 11249.0
...
The numbers on the right hand side should be increasing if your application is in use.
- Check if Application Sidecars (Envoy) are sending ALS metrics to the control
plane OAP. To do that, do a
port-forwardof the Istio Sidecar on port 15000 and query theenvoy_accesslog_servicemetric. In a regular situation, thecx_activemetric (number of current connections) should be 2.
In this example we are using theproductpageservice of thebookinfoapplication:
# start the port-forward in a shell
kubectl -n bookinfo port-forward deployment/productpage-v1  15000
Forwarding from 127.0.0.1:15000 -> 15000
Forwarding from [::1]:15000 -> 15000

# curl the config in another shell
curl -s http://localhost:15000/clusters | grep "envoy_accesslog_service" | grep cx_active
envoy_accesslog_service::10.31.243.206:11800::cx_active::2
- Add debut to OAP if counters are not as expected
You need to edit theconfig.ymlused by OAP by using the command:kubectl -n istio-system edit cm oap-config.
Search for the following lines and remove the comments around it:
<!-- uncomment following line when need to debug ALS raw data
   <logger name="io.tetrate.spm.user.receiver.envoy" level="DEBUG"/>
-->
Should become:
<logger name="io.tetrate.spm.user.receiver.envoy" level="DEBUG"/>
You need to restart OAP for the configuration change to take effect:
kubectl -n istio-system delete pod -l app=oap
You can then search the logs for downstream_remote_address. If you have logs
that generally means that the metrics are reaching the OAP service.
- search in the Elasticsearch back-end
Metrics are kept in Elasticsearch (ES) indices. You can check the status and health of the ES by sending some queries.
As the ES server is not managed by TSB, please refer to your documentation to get the correct connection string.
In this example, we set a port-forward to the ES pod inside thetccnamespace.
# port forward to ES server
kubectl -n tcc port-forward statefulset/elasticsearch 9200

# check cluster health
curl -s  'http://localhost:9200/_cluster/health?pretty=true'
{
  "cluster_name" : "elasticsearch",
  "status" : "yellow",
  "timed_out" : false,
  "number_of_nodes" : 1,
  "number_of_data_nodes" : 1,
  "active_primary_shards" : 64,
  "active_shards" : 64,
  "relocating_shards" : 0,
  "initializing_shards" : 0,
  "unassigned_shards" : 5,
  "delayed_unassigned_shards" : 0,
  "number_of_pending_tasks" : 0,
  "number_of_in_flight_fetch" : 0,
  "task_max_waiting_in_queue_millis" : 0,
  "active_shards_percent_as_number" : 92.7536231884058
}
The status line should be either green or yellow. If red, you have an issue
with the ES cluster. You can then check the indices status using the command:
# Indices status for the 26 March 2020
curl -H'Content-Type: application/json' -s -XGET 'http://localhost:9200/_cat/shards/*20200326

service_5xx-20200326                                 0 p STARTED  31236   1.4mb 10.28.1.12 elasticsearch-0
service_instance_relation_client_call_sla-20200326   0 p STARTED  53791   5.1mb 10.28.1.12 elasticsearch-0
endpoint_percentile-20200326                         0 p STARTED 128707  12.7mb 10.28.1.12 elasticsearch-0
endpoint_2xx-20200326                                0 p STARTED 123131   7.4mb 10.28.1.12 elasticsearch-0
...
You should see a list of all the indices. They should all be in the STARTED
state. Next numbers are the number of documents and the size of the index. By r
running the command at different time you should see these numbers increasing.
Tracing
If you're having trouble reaching the traces, follow these steps.
- check Zipkin tracing health
Use a port-forward to reach the Zipkin Collector from theistio-systemNamespace:
# check the status
curl -s http://localhost:9411/health | jq '.'
{
  "status": "UP",
  "zipkin": {
    "status": "UP",
    "details": {
      "ElasticsearchStorage": {
        "status": "UP"
      }
    }
  }
}

# check the metrics
curl -s http://localhost:9411/metrics | jq '.'
{
  "counter.zipkin_collector.messages.http": 81965,
  "counter.zipkin_collector.spans_dropped.http": 168,
  "gauge.zipkin_collector.message_bytes.http": 1128,
  "counter.zipkin_collector.bytes.http": 107587202,
  "gauge.zipkin_collector.message_spans.http": 1,
  "counter.zipkin_collector.spans.http": 97692,
  "counter.zipkin_collector.messages_dropped.http": 0
}
Status should be UP and metrics should increase when you run the command
multiple times.
You can manually get traces from Zipkin by using the following URL:
"http://localhost:9411/zipkin/api/v2/traces?endTs=1566915079702&limit=10&lookback=3600000"
Where:
endTsholds Unix timestamp in milliseconds as end time (defaults to now)limitholds maximum number of traces to return (defaults to 10)lookbackwindow up toendTsin milliseconds. (defaults to 900000 - 15 minutes ; Common setting to use 1 hour = 3600000)
Ex to get only one trace from the last 15 minutes:
curl -s 'http://localhost:9411/zipkin/api/v2/traces?limit=1' | jq '.'
[
  [
    {
      "traceId": "05262907959bfbfe76eff0191e84f9e6",
      "id": "76eff0191e84f9e6",
      "kind": "SERVER",
      "name": "frontend.hipstershop-map.svc.cluster.local:8080/*",
      "timestamp": 1585225111558350,
      "duration": 65995,
      "localEndpoint": {
        "serviceName": "frontend.hipstershop-map",
        "ipv4": "10.28.1.41"
      },
      "tags": {
        "component": "proxy",
        "downstream_cluster": "-",
        "guid:x-request-id": "70c86038-19af-9452-9127-10cfc5c58897",
        "http.method": "GET",
        "http.protocol": "HTTP/1.1",
        "http.status_code": "200",
        "http.url": "http://frontend.hipstershop-map:8080/product/OLJCESPC7Z",
        "node_id": "sidecar~10.28.1.41~frontend-75c999c99-zsvck.hipstershop-map~hipstershop-map.svc.cluster.local",
        "peer.address": "10.28.1.42",
        "request_size": "0",
        "response_flags": "-",
        "response_size": "7932",
        "upstream_cluster": "inbound|8080|http-frontend|frontend.hipstershop-map.svc.cluster.local",
        "user_agent": "python-requests/2.21.0"
      }
    }
  ]
]
- Check if Zipkin can send traces to Elasticsearch
You can add more debug to the Zipkin collector to ensure it is sending the traces to the ES storage.
Edit the Zipkin deployment and addES_HTTP_LOGGING=BASICin an environment variable.
kubectl  -n istio-system edit deployment istio-tracing


...
      containers:
      - env:
        - name: ES_HOSTS
          value: http://127.0.0.1:9200
        - name: QUERY_PORT
          value: "9411"
        - name: STORAGE_TYPE
          value: elasticsearch
        - name: ZIPKIN_STORAGE_MEM_MAXSPANS
          value: "500000"
        ...
        - name: ES_HTTP_LOGGING
          value: BASIC
...
After the Zipkin pod is restarted, you should start seeing logs for every connection to the ES server. Here is an example of a working connection:
istio-tracing-6b7884855-q5cq2 zipkin 2020-03-26 12:29:22.600  INFO 1 --- [.0.0.1:9200/...] z.e.ElasticsearchStorage                 : --> POST http://127.0.0.1:9200/_bulk http/1.1 (-1-byte body)
istio-tracing-6b7884855-q5cq2 zipkin 2020-03-26 12:29:22.686  INFO 1 --- [.0.0.1:9200/...] z.e.ElasticsearchStorage                 : <-- 200 OK http://127.0.0.1:9200/_bulk (85ms, 242-byte body)